Home » Products » API Monitoring » Postman API Monitoring
- Postman Collections
- v2.0 · v2.1 native
Postman API Monitoring That Turns Your Collections Into 24/7 Production Monitors
Postman API monitoring with Dotcom-Monitor turns the API tests your team already maintains in Postman into 24/7 production monitors — import the Collection, run it from 30+ global locations on a 1-minute cadence, with environments and scripts intact.
- Direct .json upload
- Environments preserved
- 1-min monitoring frequency
- Cancel anytime · No auto-charge after trial
Direct import
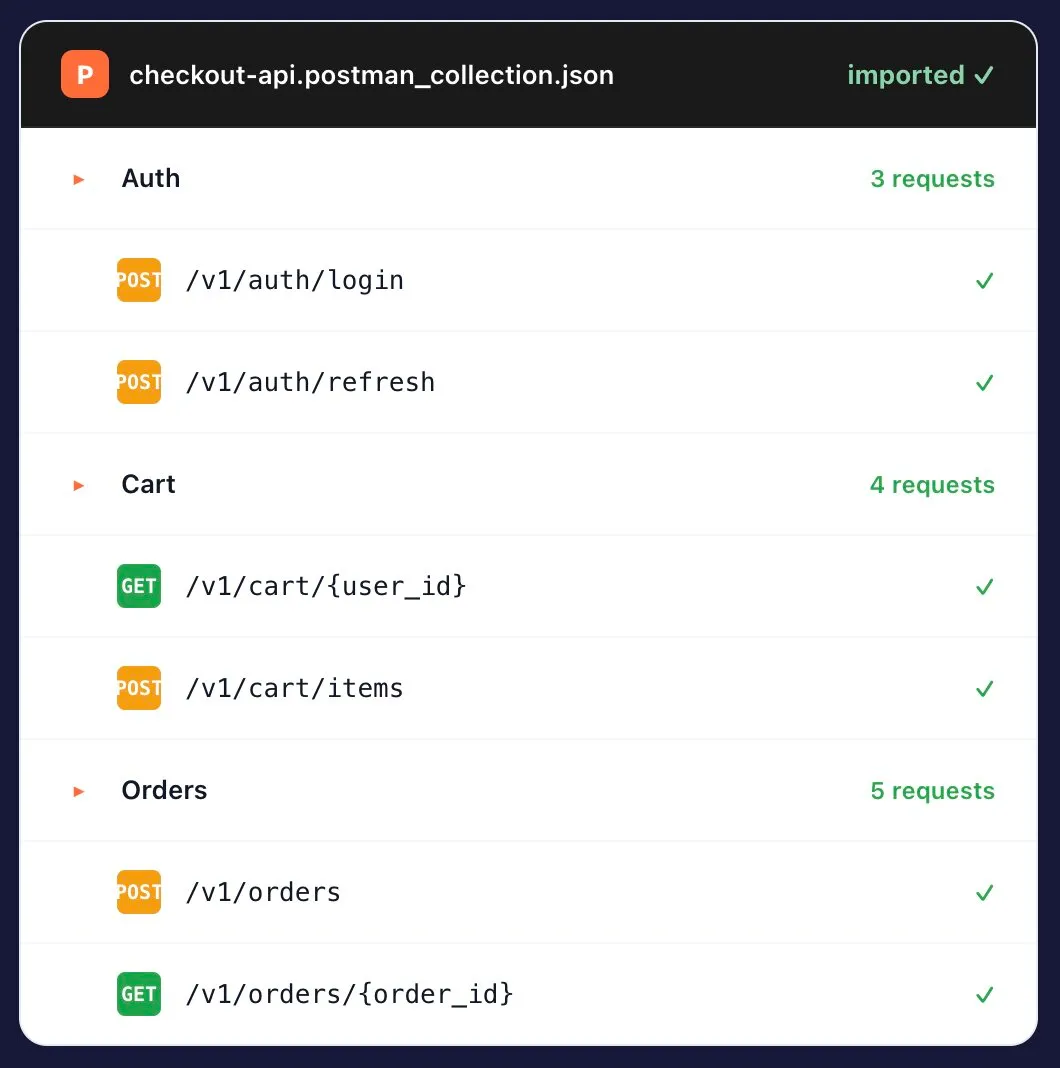
Everything You Wrote in Postman, Ported in One Click
You spent months building these Collections. We import the JSON as-is — folders, requests, scripts, environment variables, test assertions — and turn each request into a synthetic monitor that runs from real global locations on a fixed cadence.
- Postman Collection v2.0 and v2.1 JSON imports natively.
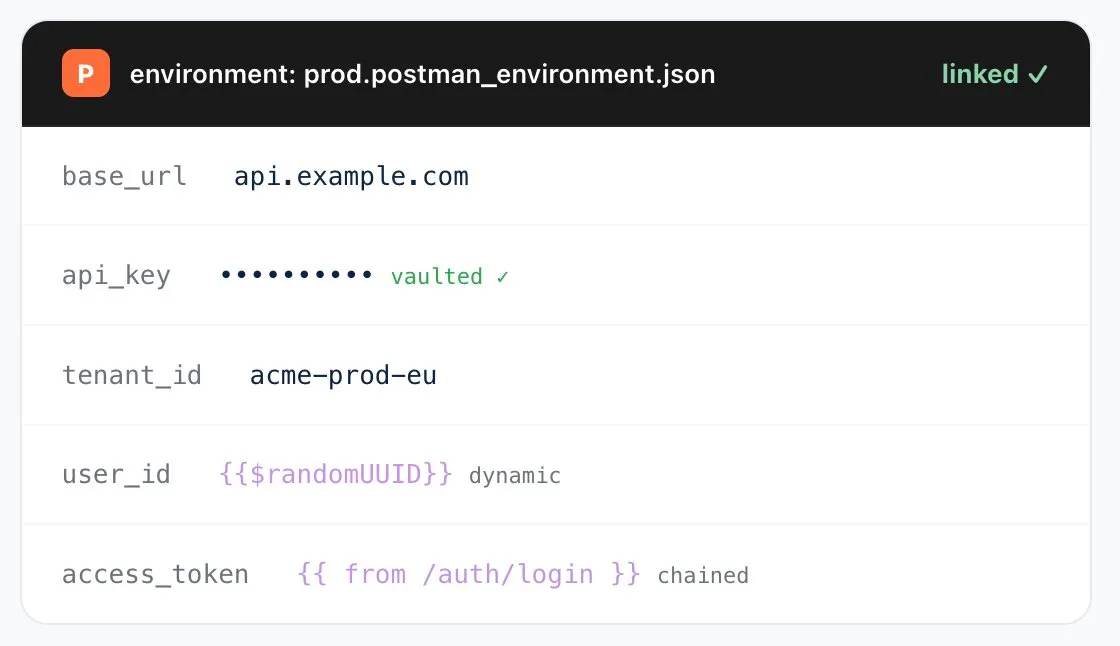
- Environments preserved — static + dynamic vars, dev/staging/prod switching.
- Pre-request and test scripts — JavaScript-style assertions run on every monitor execution.
- Folder structure intact — your Collection hierarchy maps cleanly to monitor groups.
Capability | Dotcom-Monitor | Postman Monitors |
|---|---|---|
Import Postman v2.0/v2.1 Collections | (native) | |
Global monitoring locations | 30+ | Limited |
Private Agents (behind firewall) | ||
Native PagerDuty / Slack / Teams | Limited | |
1-min check frequency | Tier-gated | |
SLA on the monitoring platform | 99.99% | Best effort |
Free trial | 30 days, full features | Paid plans |
Why import to Dotcom-Monitor
Postman Monitors Is a Test Runner. We’re a Monitoring Platform.
Postman Monitors is great for sequential test runs from Postman’s cloud. But production monitoring needs more: real geographic distribution, behind-firewall coverage, native incident routing, and an SLA on the monitoring tool itself.
- 30+ owned global locations vs. Postman’s limited cloud regions — catch geo-specific failures.
- Private Agents for behind-firewall and internal-API monitoring — Postman Monitors can’t reach these.
- Native PagerDuty / Slack / Teams alert routing — not just email.
- 99.99% Uptime SLA on the platform itself — your monitor never becomes the single point of failure.
Coming from Postman Monitors? Import your Collection in under 5 minutes — or get a walkthrough first.
Use cases
What Teams Do Once Their Collections Are Running 24/7
QA Tests → Production Monitors
The Collection your QA team built for release testing becomes a 24/7 production monitor without rewriting anything. Same coverage, no maintenance fork.
Post-Deploy Smoke Tests
Trigger the Collection from CI after every deploy. Gate the release on assertion results — catch contract regressions before they reach production traffic.
Regional Failure Detection
Run the same Collection from 30+ locations in parallel. Detect the CDN issue affecting only APAC, or the DNS rollout that didn’t propagate to EU-West.
Third-Party API Sla Tracking
Import the Collection you use to probe Stripe, Twilio, Auth0, or any upstream. Track their latency and error rate against the SLA you’re paying for.
Internal Microservices
Drop a Private Agent inside your VPC. The same Postman Collection runs against internal endpoints with no inbound firewall rule.
Sync as Collections Evolve
Re-import as your Postman workspace evolves. Newly added requests show up in your monitor set; environment changes flow through.
Not ready for a trial?
Want a 15-Minute Walkthrough First?
A performance engineer will walk you through your existing Postman Collection running as a production monitor from 30+ locations — no sales pitch, just a working monitor by the end of the call.
Fits your stack
Plays Well With the Tools Your Team Already Runs
Slack
PagerDuty
Microsoft Teams
Opsgenie
Webhook
Email / SMS
Grafana
Prometheus
GitHub Actions
Jenkins
Azure DevOps
Power BI
Global monitoring network
Checks That Run Where Your Users Live
Postman Monitors ships your Collection from a small set of cloud regions. Dotcom-Monitor runs it from 30+ owned monitoring locations across six continents — and can run it inside your network with a Private Agent.
30+
Global monitoring locations
6
Continents covered
1 min
Minimum check interval
Private Agents
For behind-firewall

What teams say
From Postman Users Who Flipped to Production Monitoring
"I absolutely love the comprehensive monitoring services Dotcom-Monitor provides. The real-time alerts and detailed performance analytics have been a game-changer for our website's uptime and speed. The global monitoring feature ensures that our site is optimized everywhere, and the intuitive dashboard makes it easy to track performance. Their customer support is exceptional — always responsive and efficient."
Tomer C.
Managing Director · Facilities Services
Verified Capterra review · March 2025
"One of Dotcom's best features is the push/pull API capabilities that provide us with network performance data. We use this to monitor for performance issues as well as page loading stats. Dotcom-Monitor allows us to monitor multiple services within one interface and platform. It's allowed us to operate more efficiently."
Gregory S.
Manager · Broadcast Media
Verified Capterra review · May 2020
"I have been thoroughly impressed with the level of detail and comprehensiveness of the reports generated by the software. Moreover, the support team at Dotcom-Monitor has exceeded my expectations. On almost a daily basis, I reach out with various questions and they have consistently demonstrated unwavering patience, providing detailed and insightful answers."
Shirin R.
Software Test Engineer · Computer Software
Verified Capterra review · February 2023
"I'm a network analyst and use Dotcom tools inside the ISP I work, it's a really good and reliable tool for monitoring things along the network, and testing network components, I usually use it to make diagnostics of servers latency, and dns resolve time."
Leonardo J.
IT & Network Infrastructure Analyst Internet
Verified Capterra review · October 2022
4.5
Capterra
82 reviews
4.6
Ease of Use
Capterra Score reviews
4.6
Customer Service
Capterra Score reviews
All reviews sourced from Capterra verified reviews. Ratings as of July 2026.
Want to kick the tires without committing? Free Forever plan available — up to 25 targets, 2 monitoring locations, 7 days of data retention. Get started free → or Compare plans
Frequently asked questions
Postman Monitoring Questions Teams Ask Before Signing Up
Can I import my Postman Collections directly?
Yes. Import Postman Collection v2.0 and v2.1 JSON files directly. Folders, requests, environment variables, pre-request scripts, and test assertions are all preserved on import.
How is this different from Postman Monitors?
Postman Monitors runs your Collection from Postman’s cloud regions on a schedule. Dotcom-Monitor runs the same Collection from 30+ owned global locations, adds Private Agents for behind-firewall checks, native PagerDuty/Slack/Teams routing, and treats it as a full synthetic monitor with its own 99.99% SLA — not a sequential test run.
Do you preserve environment variables and scripts?
Yes. Static and dynamic environment variables (including Postman built-ins like {{$randomUUID}}) import directly, along with pre-request scripts and test assertions written in Postman’s JavaScript dialect.
Can I run the same Collection from multiple locations?
Yes. Choose from 30+ global monitoring locations and run the Collection in parallel from each. Catch the regional CDN issue or DNS propagation gap that single-location monitoring misses.
Can I monitor Collections at 1-minute intervals?
Yes. As often as every minute per Collection. For critical paths (login, payment, checkout) we recommend 1-minute intervals; less critical Collections typically use 5- or 15-minute intervals.
Does it work with Postman's environments?
Yes. Import environments alongside Collections — pick which environment to use per monitor (dev/staging/prod), and re-import as your Postman workspace evolves.
Can I trigger Postman Collection runs from CI/CD?
Yes. Trigger monitor runs from GitHub Actions, Jenkins, Azure DevOps, or any tool that can make HTTP calls. Gate the deploy on assertion results, latency, or availability thresholds.
Can I monitor private / internal Postman Collections?
Yes. Deploy Private Agents inside your VPC or datacenter — the same Collection runs against internal endpoints with no inbound firewall rule required.
What if I'm using Insomnia instead?
Same story — import Insomnia v4 exports directly. See Insomnia API monitoring →
What Postman pre-request scripts are supported?
Postman JavaScript scripts using the pm.environment, pm.variables, and pm.collectionVariables APIs are supported. Dynamic variables ({{$randomInt}}, {{$randomUUID}}, etc.) execute at request time. Scripts that depend on Postman-specific APIs unavailable outside Postman are flagged on import.
Does it handle Postman environments with dynamic variables?
Yes. Dynamic environment variables resolve at each monitor run, so values like timestamps, random UUIDs, and unique IDs are regenerated per check.
Can I share an imported Collection with my team?
Yes. Imported Collections live at the account level and can be shared with team members via role-based access control. Updates to the imported Collection apply to all monitors that reference it.
Does it support Newman (Postman CLI)?
You can run Newman locally in CI as part of pre-deploy testing AND register the same Collection with Dotcom-Monitor for continuous post-deploy monitoring. Both use the same Collection JSON.
Monitoring more than Postman Collections? See the full API Monitoring platform →
Your Postman Collection. Running 24/7 From 30+ Locations.
30-day free trial. No credit card. Import a Collection in under five minutes.
- 10,000+ organizations
- Monitoring leader since 1998
- 99.99% Uptime SLA