When was the last time you looked into the loading time of your website on actual end user screens? Do you know that the load time of your website content may significantly vary from different geographical locations? An end user sitting in Los Angeles may face a delay in downloading your web page and content than a user accessing your web page from London. The simple fact is lots of back-end processes are happening behind the scene to deliver your website and content to the end uses. Speed, security, and SEO are not going to cut it for you to get a fast deliverable web content. There are other aspects to ensure your success in the online arena, and that is where a Content Delivery Network (CDN) comes into play.
The amount of security and the speed your website could possibly be affected by your CDN. Additionally, like any other business, it is all numbers’ game, so the more people land on your website, the more revenue you are likely to generate.
So, how will you know if you need a CDN and when?
Time for CDN
Let’s take your website as an example. Your services are thriving, and the traffic has the best statistics of all time, with prospects of higher ROI. You keep expanding your network and enter new markets around the globe.
However, you start getting complaints from various locations where users claim that your web pages load time are unbearably slow. You run a speed test at your end, and everything seems to be working flawlessly.
So, where does the problem lie?
One of the culprits is the location of the servers delivering your content to the end users. These servers may not be remotely close to the location of the end user. For example, a person in Europe is trying to access your web page, but the server is somewhere on the west coast, causing a delay in load times. Therefore, the closer the server is to the end user’s location, the better the performance and user experience.
The geographical location of the server is not the only issue; a huge traffic influx can also crash your website. For example, you are rolling out a new software update or maybe running a promotional or seasonal campaign for your product, too many users on your website will overwhelm your servers.
CDN can assist you in such scenarios, as it distributes your content across various local servers in different geographical locations. It will reduce a load of traffic on your original servers preventing crashes. Plus, it will provide your users access to your content nearer to their location with faster loading times.
Signs of When You Need CDN
“When Do I need a CDN, and how can I find out?” It’s a question asked by many business owners and developers, and surprisingly the answer can be relatively simple. There are three points to consider, and if your organization fits any one or all of these parameters, it indicates CDN has become a necessity for your productivity, speed, and security.
The exponential growth of your website
If your website is getting popular, it is likely to get increased traffic, and having a single web server managed that load is more likely to see performance issue. Implementing a CDN into your infrastructure will certainly help.
Global Expansion
Whether you are expanding into the global market or you notice that a significant chunk of your web traffic is coming from global users. It is time to consider CDN.
Static Content and Large Files Are Slowing Your Servers
Large images, CSS, and scripts, various elements can drag your servers down, especially websites, such as online magazines, and other media contents.
However, when you consider a CDN, make sure to go for a reputable provider. Implementing a mediocre CDN may end up costing you more. To know which CDN will work best for your website, you can troubleshoot and benchmark its performance using a waterfall chart evaluation.
Waterfall Chart Evaluation
It is also known as a waterfall graph, providing you a visual representation of how all the features and content on your website load. It includes JavaScript, CSS, HTML, plug-ins, images, and other third-party content. The waterfall chart also lets you observe the order in which your content renders in a browser. This order of rendering is crucial as it can affect various aspects from FOIT (Flash of Invisible Text) issues to render-blocking CSS.
A waterfall chart depicts various vital pieces of information in its evaluation breakdown.
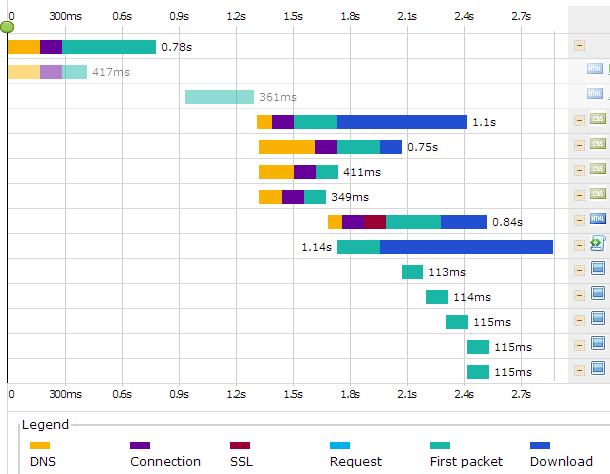
DNS lookup
When accessing a web page, your browser finds all resources via DNS lookup and waits for them to complete before the download commences. The DNS lookup basis on hostnames, therefore, the more third party assets and content you host on your CDN, the better. It will minimize single DNS lookup requests.
Initial Connection
The initial connection or TCP connection refers to the total time required to establish a TCP connection between the server and the localhost/client. A quick TCP connection can help you address network latency issues.
SSL/TLS
SSL or SSL negotiation is the total time a web browser takes to perform an SSL/TSL handshake. However, you will only be able to see this happening during the test if your CDN and website run on HTTPS. You can speed up your HTTPS websites via HTTP Strict Transport Security (HSTS), OCSP stapling, by using HTTP/2 protocol.
TTFB/Waiting
It stands for time to the first byte. It is the time that it takes for the first byte to reach the client from the webserver. TTFB is vital to website optimization; the faster the TTFB, the faster the delivery of the content to the client’s browser. A CDN will help you know where TTFB stands and how to improve it.
Content Download
This is pretty self-explanatory; it depicts the time it takes for the browser/client to download your content.
DOM Content Loaded
DOM stands for Document Object Model. In layman’s term, the visual inspector shows you the performance of DOM. Simply put, you can see what could be potentially blocking your DOM in runtime, causing a delay in your web page load time.
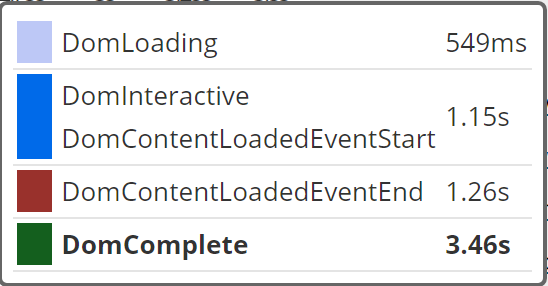
Load Time
The waterfall chart also shows the total time it takes your web page and content to load at the end user’s location.
Data Transferred
It is also known as Bytes In. It is the total size of your web page and your content.
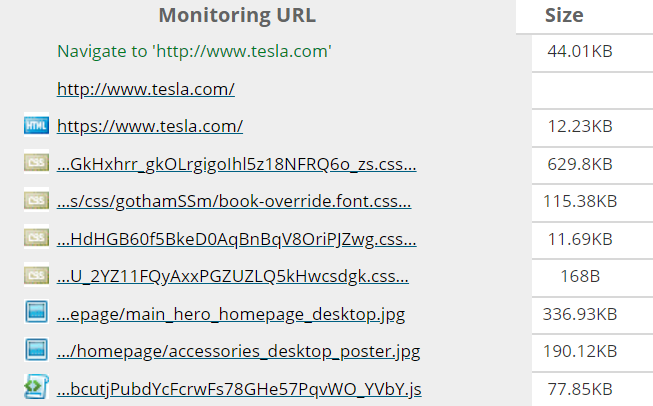
HTTPS requests
To the left of the content size, you can see the total HTTPS requests generated on your web page. The more HTTPS request you receive, the slower it will load.
Status Codes
If any errors are occurring with HTTPS requests on your server for each location, the waterfall chart will flag them along with the status, error codes, and server response codes. It will help you identify and rectify the problems efficiently for customer satisfaction.

Conclusion: Get the Right Tools
As you can see, waterfall charts can help you see the bigger picture of how your web pages perform, and what may be holding them back. If you’re seeing significant, continuous performance issues, it might be time for a CDN. A CDN can help improve performance for your users, can manage traffic spikes better, and can provide a more reliable, cost effective solution in the long run.
To get the right tool to diagnose the issue is crucial. Dotcom-Tools is one such service that allows you to test your website speed and performance in real-time, choosing from over 20 locations. All you need to do is enter your URL, and it will show you the performance results, including speed insights and a waterfall chart. Or try the full Dotcom-Monitor platform for free for 30 days to set up monitoring from nearly 30 locations around the world