
Why You Need Native IPv6 Network Monitoring
Ensure 100% uptime across all routing paths. Learn how native IPv6 network monitoring catches hidden DNS, firewall, and gateway configuration errors.

Concurrent vs Round-Robin Monitoring Explained
Round-robin vs concurrent synthetic monitoring: how each schedules checks across locations, the cost trade-off, and when to use which.

Website Monitoring Alerts – Maximize Uptime and Reduce Noise
Updated June 2026 · 11-minute read Ask any on-call engineer about their monitoring and they will tell you the same thing: the alerts are not the problem. The noise is.

What is Application Performance Monitoring (APM)?
What application performance monitoring (APM) is, how instrumentation, collection, and correlation work, which metrics matter, and the best practices that make APM useful in production

Top 8 Application Performance Monitoring Tools (2026 Edition)
Compare the top 8 application performance monitoring tools of 2026 on features, alerting, OpenTelemetry, and real pricing, plus the hidden costs to avoid.

Website Availability Monitoring: A Practical Guide to Staying Online
Learn how to monitor website uptime, compare synthetic vs. real user monitoring, evaluate tools, and audit your setup with a practical checklist.

Best Pingdom Alternatives in 2026: 7 Top Tools Compared
Looking for Pingdom alternatives? Compare top tools like Dotcom-Monitor, UptimeRobot, and Datadog with accurate features, pricing, and API monitoring strengths.

Web Application Performance: Metrics, Process & Best Practices
Web application performance is not just a technical concern – it is a business imperative. Google’s research shows that as page load time increases from one second to five seconds,

Website Monitoring Best Practices Engineers Actually Use
What it is, why it matters, and best practices to choose the best website monitoring service for uptime, performance, and user experience.
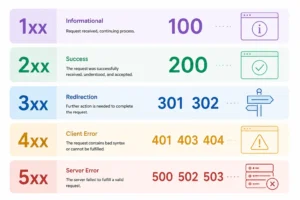
The Most Common HTTP Status Codes (And What to Do About Each)
A practical reference for engineers who get paged when these codes show up.
Best 8 API Monitoring Tools for Production Environments
Learn what an API monitoring tool really does, key features to evaluate (auth, assertions, alerts, SLAs), and how to choose the right one for production APIs.

API Monitoring: Definition, Metrics, Types & Setup Guide
API monitoring is the continuous, automated practice of validating API endpoints for availability, response time, and data correctness — confirming not only that an endpoint responds, but that it returns the right data, in the right format, within acceptable latency, from the perspective of users and dependent systems.