
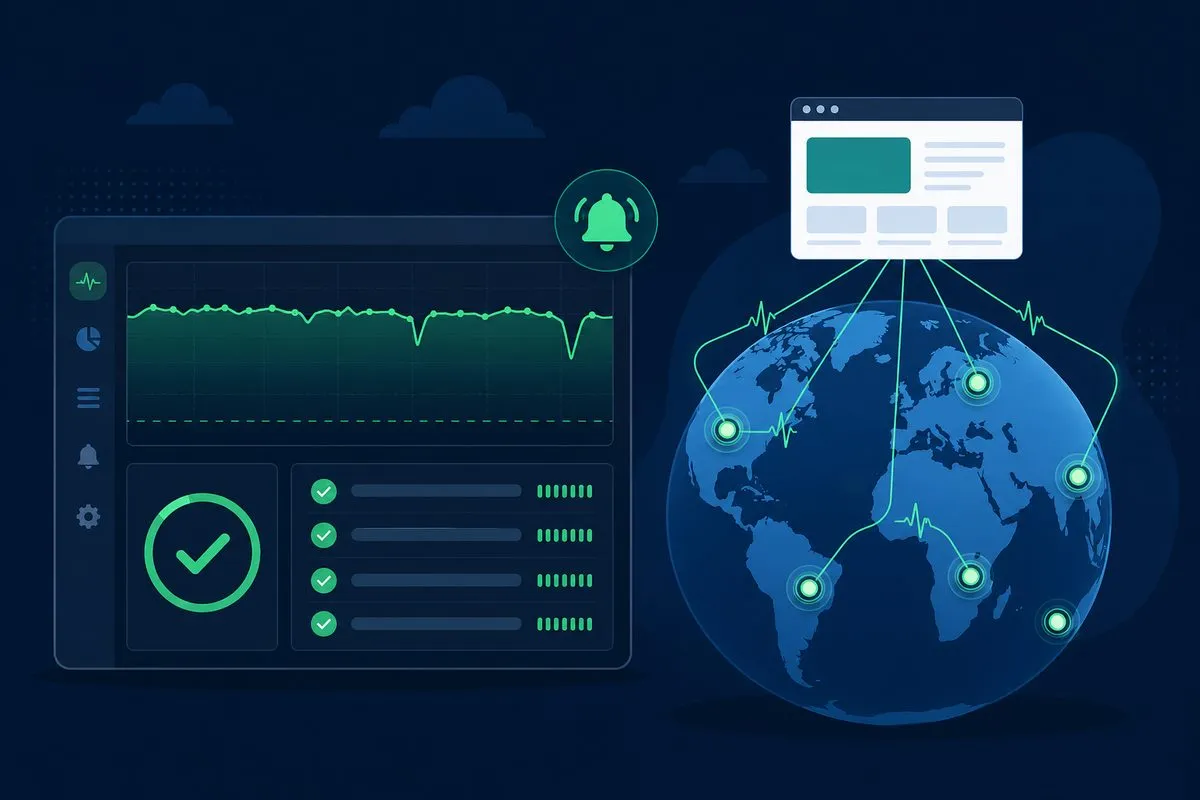
Most teams find out their site is down from a customer email, a social post, or a sales dashboard that quietly flatlines. By the time a human notices, the outage has been running for however long it took someone to complain, and the damage started well before that.
Uptime monitoring closes that gap with a simple mechanism: automated checks fired at your site on a schedule, from outside your own network, that raise an alert the moment a response comes back wrong or not at all. The setup takes minutes. Getting it to tell the truth takes a handful of decisions most tutorials skip, because a monitor left on defaults misses real failures and cries wolf about imaginary ones.
This guide walks through those decisions in seven steps: defining what “up” means, choosing check types, setting frequency, verifying from multiple locations, wiring alerts, filtering false positives, and reporting uptime against an SLA.
One idea ties the seven steps together: treat the monitor as a truth stack, not a single check. DNS proves the name resolves, TCP proves the service is reachable, TLS proves browsers will trust it, HTTP proves the application responds, content validation proves the right page rendered, and journey monitoring proves a visitor can finish the task. Build the stack from the outside in, and every alert names the layer that failed instead of shrugging “site down.”
Step 1: Define What “Up” Means for Your Site
The laziest definition of up is “the server answers.” It is also the one that burns people. A host can answer ping while the web server process is dead. A web server can return HTTP 200 while serving a maintenance page, a half-rendered template, or somebody else’s content after a DNS hijack. None of those count as up to a visitor.
It helps to name the three states of down. Hard down: the host answers nothing at all. Soft down: the server returns a 200 while serving a database error, a blank template, or someone else’s content after a DNS hijack. Phantom down: your servers are healthy, but a broken CDN edge or a regional routing failure hides the site from one slice of your audience. A monitor that only catches hard down misses the two states that happen more often.
So before you configure anything, write down what has to be true for your site to be genuinely available:
- The domain resolves to the correct address, quickly.
- Critical pages respond with a success status code. Critical means the homepage plus every page whose failure costs money or trust: checkout, login, signup, key API endpoints.
- The response contains the right content. A keyword or element that only appears when the page rendered properly, so an error template served with a 200 still fails the check.
- The certificate is valid and the response arrives within a time you would accept as a user.
That list is not bureaucracy. It maps directly onto the layers where requests actually fail, and failures happen at DNS, TCP, TLS, and HTTP in distinct ways. A check that only tests one layer is blind to the other three. The list also settles which URLs to monitor: not every page on the site, just the ones on your definition.
Written out for an ecommerce site, the homepage monitor might read: returns 200 within 3 seconds, contains “Free shipping,” presents a certificate with more than 14 days left, resolves through the expected CNAME to the CDN. The checkout monitor is stricter: returns 200, contains “Order Summary,” fails if the payment provider’s script is missing. Both URLs count as up. They do not deserve the same definition.
Step 2: Choose Your Uptime Check Types
With the definition written, pick checks that verify each part of it. Five check types cover almost every uptime scenario, and each one can lie if you treat it as proof of the whole experience:
| Check type | What it verifies | What it catches | Where it can mislead |
|---|---|---|---|
| HTTP(S) | Status code and response content of a URL | Server errors, error pages served with a 200, wrong or hijacked content | A 200 can still carry the wrong template or a cached error page |
| Ping (ICMP) | The host answers echo requests | Network and host-level failures, packet loss, routing problems | A host can answer ICMP while the web service or TLS is broken |
| TCP port | A specific port accepts connections | A crashed service process on a host that still answers ping | An open port proves a listener exists, not that the app behind it is healthy |
| DNS | The domain resolves to the expected records | Expired domains, botched record changes, DNS provider outages | One resolver can hold the right answer while another region serves stale records |
| SSL certificate | Certificate validity and days to expiry | Expired or misconfigured certificates that browsers block | A valid certificate says nothing about the content served behind it |
HTTP and HTTPS Checks
The foundation check. It requests a URL, verifies the status code, and, if configured well, asserts that a keyword appears in the response body. Anything outside the success range, like the common 4xx and 5xx status codes, counts as a failure. The content assertion is what separates “server responded” from “page actually loaded”: a 200 carrying an error template passes a naive check and fails a keyword check.
Ping (ICMP) Checks
ICMP ping monitoring verifies that the host is reachable and measures latency and packet loss along the way. It is cheap, fast, and useful for network-level triage. It is also weak as your only check, because a machine can answer ping with its web server down, and some networks deprioritize or block ICMP outright.
TCP Port Checks
A TCP port check confirms that a specific port accepts connections: 443 for web traffic, 25 for mail, or whatever custom port your application listens on. It catches the classic in-between failure, where the host is fine and ping succeeds but the service process has crashed and the port refuses connections.
DNS Checks
DNS monitoring verifies that your domain resolves to the records you expect and tracks how long resolution takes. When DNS breaks, through an expired registration, a bad record change, or a provider outage, your site is down for everyone even though every server you own is healthy. It is the failure mode teams most often forget to cover.
SSL Certificate Checks
SSL certificate monitoring tracks expiry dates and validation-chain problems. An expired certificate is functionally an outage: browsers interpose a full-screen warning most visitors will not click past. With certificate lifetimes getting shorter, tracking expiry by calendar reminder no longer works, so let a monitor count the days and alert at 30, 14, and 7.
A sensible starting stack: HTTP(S) checks with content assertions on every critical page, plus DNS and certificate checks on the domain, with ping and TCP checks added where they help you tell network problems from application problems.
Step 3: Set the Right Check Frequency
Your check interval is the ceiling on detection speed. An outage that begins seconds after a passing check runs for almost the full interval before the next check can catch it, and then verification and alerting add their own time on top.
Put that against an availability target and the lag gets expensive. A 99.9% monthly target allows about 43 minutes of downtime. A five-minute interval can spend more than a tenth of that budget before anyone even knows there is a problem, which is part of the real cost of downtime. Work it as a detection budget: decide how much of the monthly allowance you are willing to burn before the first human knows. Allow 10% of a 99.9% budget and you get about 4 minutes, which rules out a five-minute interval before escalation even enters the conversation. In revenue terms, a site earning $5,000 an hour loses over $400 inside one five-minute blind spot. As a working rule:
- Every minute for revenue-critical targets: checkout, login, payment APIs, anything under a formal SLA.
- Every 3 to 5 minutes for standard marketing sites and content pages.
- Every 15 to 60 minutes for internal tools, staging environments, and low-stakes services.
Lightweight HTTP checks are cheap enough to run at high frequency everywhere. Heavier browser-based checks usually run on a slower schedule, layered over fast basic checks. For a deeper treatment of how interval and geography interact, see this guide to monitoring frequency and locations.
Step 4: Monitor From Multiple Locations
A single monitoring location gives you a single vantage point, and that produces two failure modes at once. You miss outages that only affect some regions, like a bad CDN edge, a geo-DNS misconfiguration, or a routing problem between one ISP and your host. And you inherit every hiccup of that one location’s network as a false alarm.
Pick locations that match where your users are. A site serving North America and Europe should be checked from both US coasts and at least one European city, not from a single data center in one country. Platforms with a global monitoring network, Dotcom-Monitor among them, let you select checkpoints across continents so the monitor sees what your actual audience sees.
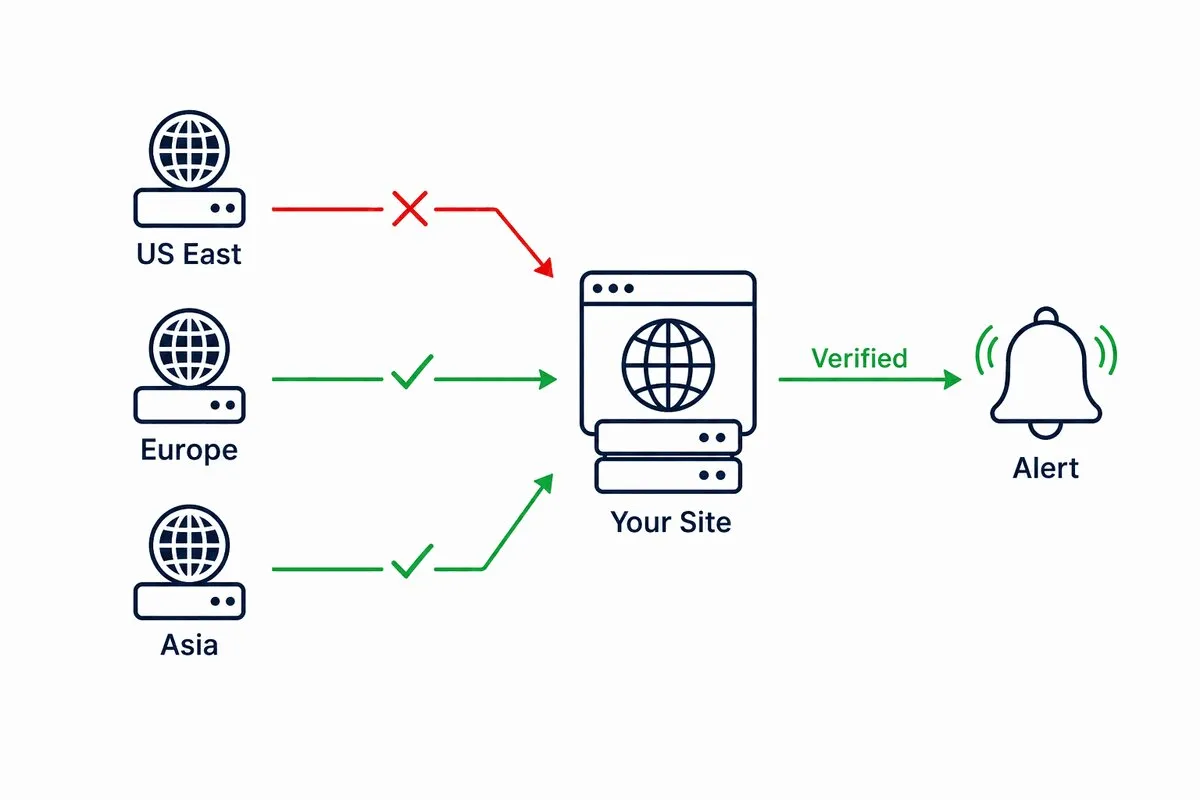
Multiple locations also unlock cross-verification, which step 6 depends on: when one location reports a failure, the platform re-checks from others before declaring the site down. And when an incident is real, the geographic pattern is your first diagnosis. Failing from every location points at origin, global DNS, certificate, or a bad deploy. Failing from one geography points at a CDN edge, regional routing, or a local provider. Passing HTTP everywhere but failing the content assertion points at a wrong template or a cached error page. Each pattern is a different ticket to a different vendor, which is why the location breakout is worth reading before anyone restarts a server.
Step 5: Set Up Alerting and Escalation
Detection only matters if the right person acts on it. Before the first incident, decide who hears about which failures, through which channel, and in what order:
- Match the channel to the severity. Email is fine for a certificate expiring in 30 days. A confirmed hard outage should hit phone, SMS, or the on-call tool your team already watches. Alert delivery can run through email, SMS, phone, and integrations with tools like Slack, Teams, and PagerDuty.
- Escalate on silence. First alert goes to the on-call engineer. No acknowledgment within a set number of minutes, and it moves to the next tier automatically. An alert nobody saw is an alert that never happened.
- Alert on degradation, not just death. A response time that triples is often the prelude to an outage. A warning threshold on performance buys you time a binary up/down alert never will.
- Silence planned maintenance. Scheduled windows keep deploys from paging anyone, which protects the credibility of every alert that does fire.
Write the alert itself as a contract: what failed, from where, for how long, and what changed since the last good check. “Checkout content check failed from Frankfurt and London for two consecutive runs; DNS and TLS passed; expected ‘Order Summary’ not found; last success 09:41 UTC” hands the responder a starting hypothesis. A bare “site down” hands them a siren.
For a fuller set of rules on thresholds, routing, and escalation tiers, see these website monitoring alert practices.
Step 6: Cut Out False Positives
False positives are how monitoring programs die. A few 3 a.m. pages that turn out to be nothing, and the on-call engineer starts sleeping through the one that is real. Most false alarms come from four sources: transient network blips between checkpoint and site, timeouts set tighter than the site’s normal behavior, trouble at the monitoring location itself, and deploys nobody told the monitor about.
Each has a direct countermeasure:
- Confirm from a second location before alerting. One failed check should trigger immediate re-verification from other checkpoints, not a page. On Dotcom-Monitor, a location that disagrees with the rest prompts checks from all selected locations, so a single checkpoint’s bad day cannot page your team on its own.
- Set timeouts from data, not hope. Base thresholds on the response times your site actually posts, with headroom, so a slow-but-working page is a performance warning rather than a phantom outage.
- Validate content, not just connectivity. Keyword assertions cut both ways: they catch soft failures a status code misses, and they stop a monitor from calling a page down when a slow third-party widget was the only problem, because the check targets what must render, not everything that might.
- Put deploys on the calendar. Maintenance windows are the cheapest false-positive fix there is.
Then triage whatever noise remains into three buckets in a weekly review: bad vantage point, bad threshold, or bad definition of up. A bad vantage point gets cross-location confirmation. A bad threshold gets reset from the response times your site actually posts. A bad definition gets a sharper content assertion. An alert that fits none of the three stays noisy until you understand it, because hiding it behind a longer interval only delays the real incident.
Step 7: Measure Uptime Against Your SLA
Every check result feeds a permanent availability record, and that record is what turns monitoring from a smoke detector into evidence. Uptime targets sound abstract until you translate them into minutes:
| Uptime target | Downtime allowed per 30-day month | Downtime allowed per year |
|---|---|---|
| 99% | 7.2 hours | About 3.7 days |
| 99.9% (“three nines”) | 43.2 minutes | About 8.8 hours |
| 99.95% | 21.6 minutes | About 4.4 hours |
| 99.99% (“four nines”) | 4.3 minutes | About 53 minutes |
The arithmetic explains the earlier frequency advice: at four nines, a five-minute check interval can miss more downtime than the entire monthly budget. Run your own targets through an availability calculator to see what your SLA actually promises in minutes.
Keep the record independent. If your host or CDN commits to an SLA, your claim for credits rests on your own externally measured data, not on the provider’s status page. Keep that evidence boring and exportable: timestamp, checkpoint location, resolved IP, TLS result, HTTP status, response time, and the failed assertion. A screenshot of a status page is an argument; a location-stamped check history is evidence, whether you are claiming credits or backing a public status page of your own. Scheduled uptime and SLA reports can land that record in stakeholder inboxes automatically, broken out by check and by location. The breakout matters: a healthy global average can hide a region that spent all of Tuesday down.
Beyond Uptime: Monitor Full User Journeys
Everything above answers one question: is the site reachable and responding correctly? It cannot tell you whether a visitor can search the catalog, add to cart, pay, or log in, because those flows span multiple pages, scripts, and third-party services that a single-URL check never touches.
For marketing teams, the journey worth scripting is the one your campaigns promise. If paid search sends visitors to “Start Free Trial,” the script should load the landing page, click the CTA, fill the form with test-safe data, and confirm the thank-you state. When that path breaks while the campaign is live, homepage uptime is a vanity metric.
That is the job of synthetic monitoring: scripted, real-browser sessions that walk your critical journeys step by step and flag the exact step that broke. With a recorder like EveryStep, a checkout or login flow becomes a repeatable monitored script without writing code. Once the seven steps here are solid, transaction-level monitoring is the natural next layer.
The Bottom Line
Monitoring website uptime well means building the truth stack, not ticking a box. Define up in business terms and name which state of down you are defending against. Cover every layer a request crosses with HTTP, ping, TCP, DNS, and certificate checks, and know where each one can mislead. Run them inside a detection budget your SLA can afford. Check from the places your users live. Write alerts that carry a hypothesis, escalate on silence, confirm before you page, and keep an independent, exportable record of what your availability really was, by region and by check.
Configured this way, an uptime monitor stops being a box you tick and becomes the first system to know about a problem, minutes ahead of your customers. That head start is the entire point.
Start Monitoring Your Uptime in Minutes
Set up HTTP, ping, TCP, DNS, and SSL checks from a global monitoring network with Dotcom-Monitor uptime monitoring, then wire the alerts your on-call team will actually trust. Start a free trial.
