The new DNS caching features at Dotcom-Monitor allow you to perform some interesting tests that show how DNS caching can affect your page load speed.
We realize that many organizations monitor their online services with a number different goals in mind, and so we listened to the feedback we received that some users want to include the DNS response time in their monitoring and some users want to be able to remove DNS response from their monitors.
How you wish to handle DNS response time in regard to your monitoring needs is up to you, but we want to take this opportunity to show the differences in how DNS response time affects website load using our new tools.
We ran a test monitoring YouTube from a single location in the midwest United States with three different DNS cache settings. A basic HTTP full page load on the YouTube front page resulted in some interesting, although not that surprising results.
Keep in mind the results will vary depending upon a number of variables such as which locations you are monitoring from, the time of day, the load on the DNS servers, and on the website servers.
Synthetic Monitoring Reveals How DNS Affects Your Website
Performing ongoing synthetic monitoring on your website can give you a better baseline to understand how DNS affects your website. The new DNS features allow you to changing the way DNS lookup is handled by the monitoring agent. This DNS specification can be applied to all of our monitoring solutions whether you are monitoring your httpss performance or your VOIP servers.
The agent is capable of using several sources for DNS lookup including uncached, cached, ttl cached, and making direct requests to a specified DNS server. Uncached means that the agent will clear its cache before each new task while cached will check the agents local cache for a record before sending a DNS query. ttl cached is probably the best option to use over time if you are attempting to replicate an actual user experience because the agent will keep the record cached until the record has naturally timed out (based upon the time to live specified by the record itself). Using a specific DNS server allows you to enter a DNS server name or IP address and monitor how the requests perform specifically from that server.
We ran three tests during the same time period comparing the different options for DNS caching: Non-cached, ttl cached, and using the Google DNS server as our primary DNS server.
DNS Caching Disabled
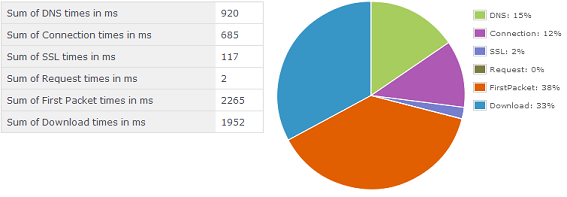
The first test that we ran was with DNS caching disabled, so the monitoring server cleared out the DNS cache every single time it ran a new task.
As you can see in the chart above, the DNS resolution for all elements on the page took about 15% of the page load time. To be fair, many developers and web ops gurus may criticize the validity of these as stand alone metrics because technology used today gives us the ability to optimize page load performance and thus mitigate the affect of DNS lookup on a page. There are a variety of methods to aid page load optimization such as maximizing use of parallel connections, using asynchronous scripts, enabling compression and many additional page load optimization techniques.
DNS Caching Enabled using TTL
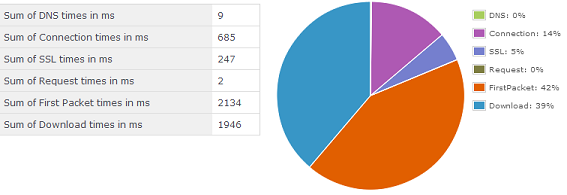
Ok, now lets see what it looks like with DNS caching enabled.
We can see that with the DNS cache turned on using the TTL set by the authoritative nameserver, DNS requests took less than 1% of the page load time. This looks like a big difference but in order to see how this affected the page load we want take a look at the waterfall chart generated by the monitoring tool when we ran each task.
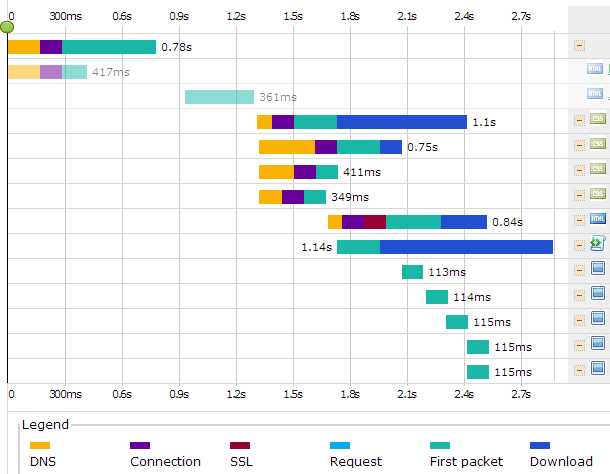
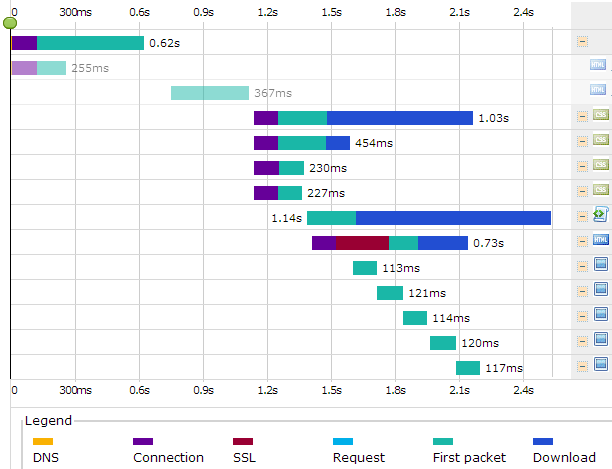
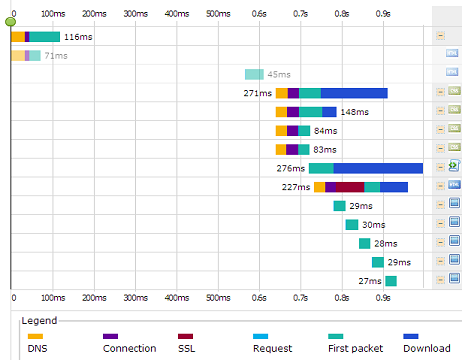
Taking a look at the two charts we can see that the DNS caching clearly did make a difference of over .3 seconds on the entire load time, and if you follow the orange bars that represent the DNS portion of the load times they do appear to have shortened the load time of each individual elements.
We can also see by looking at the waterfall charts that the page is optimized well so that most elements load in parallel and do not hold up other individual elements. Overall they have done a good job limiting the effect that DNS load times have on their page. So, whether or not you think your website is optimized for the best page load speeds or not, it is pretty easy to tell what areas are slowing your site down and what areas you can focus on for improvement.
Custom DNS Server
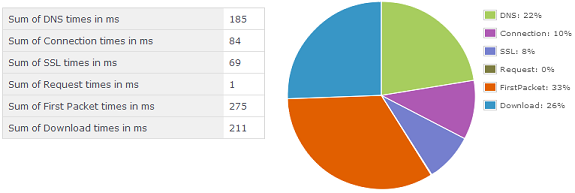
Just for fun let’s see what happens if we use the DNS caching feature to instead specify the Google DNS servers at 8.8.8.8 as our primary DNS server. I wonder if Google has their own site Youtube already cached!
It took 22% of the load time when we went straight to the Google DNS servers, however the actual load time of the content was much faster, which will also inflate the percentage of total time. The actual time in ms is 185 ms through google vs 920 ms through the default DNS server.
This clearly shows that the closer the user is to the cached content there is a significant difference in page load speed. Even with the DNS records cached, we know that content and DNS records time out eventually, so we recommend you take this test to the next level.
Instead of just running individual tests like this you can set up continuous monitoring so that WHEN, not if, something goes wrong with your site, you will receive immediate feedback through our alerting system and you can take action to resolve the issue. At the very least you will have an ongoing baseline of your website load speeds including everything from DNS to 3rd party content or content on a Content Distribution Network (CDN). Then, if any of these load times change significantly you will have reports to drill down into and find out what the cause is.
With these tools you will also be notified if there is an issue in a particular geographic region. In such a case, you may find out that your DNS host is having intermittent issues and if the problem continues you may want to switch to a more robust provider that has more servers in diverse geographic locations.
Dotcom-Monitor Web Performance Tools – Try for Yourself
We ran this test using just one specific feature of the Dotcom-Monitor suite of web performance tools. A Free Trial of these tools is available so you can test your own websites and setup ongoing monitoring to catch site slowdowns and other issues before your website visitors even notice them.

