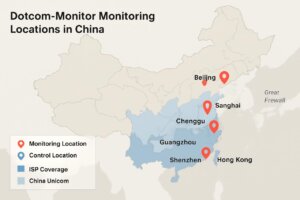
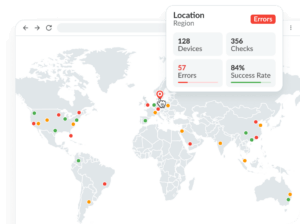
There are many levels of detail that you can chose to monitor or ignore when setting up website monitors.website-monitoring

First, you must determine which webpages are critical enough to your website to monitor.  People usually select the home page, a portal login and key internal functions such as a dashboard or a shopping cart checkout. Next, determine how critical these pages are to the health of your organization.  For example, a SaaS web application may be your sole product so every minute it is down is a huge problem.  Knowing the impact downtime has on your business will help determine how frequently you should be monitoring the website or web application.  The owner of an informational marketing site may be satisfied knowing that the website is online a few times a day while the administrator of an online shopping cart may need to know if there is a problem as soon as possible.

Once you have a rough idea what the cost of downtime could be to your business you have to weight it against the price of monitoring. More frequent monitoring is going to increase the price of the service due to the cost of bandwidth and storage space of the monitoring data.  Dotcom-Monitor provides valuable troubleshooting tools such as screenshots and video capture of monitoring results but saving those comes at a slightly higher cost due to the need for additional storage space.  In addition to what pages to monitor, you need to know what type of monitoring would work best for your website.

Select a website Monitor Type

First, identify what type of monitoring is required for the website.  There are several options available, listed here from simplest to most complex:

  • Ping -ServerView Ping

If you simply want to know if the server is up, then a ping monitor may be the best fit.

  • Traceroute (Identifies the path to reach the host from each location) -ServerView Traceroute
  • Port Availability -ServerView Telnet Port
  • HTML Load (Check for a 200 response from the server) -ServerView http/s

A ServerView http/s monitor can query the web server to see if it sends an html file and a 200 OK response.

  • Full Page Download (Download all elements including 3rd party elements) -ServerView http/s Full Page Download

ServerView http/s full page download monitor will download all content on the page and verifying that there are no 400 or 500 server errors.

  • Download and render the full page in a specific browser -BrowserView

Setup BrowserView monitor using any browser or mobile device to monitor the performance of a single webpage as your users would see it in their own browser.

  • Multi step download without render -ServerView Multiple tasks recorded with EveryStep

ServerView http/s scripts recorded with EveryStep can monitor pages that are behind a secure login, or monitor a sequence of pages without rendering.

  • Multistep download, render and interact in a real browser -UserView Recorded with EveryStep

Select a browser and record a script in EveryStep to monitor true performance of your website from an end-user’s perspective.  A full browser script records every action you take as you navigate and use a website including data entry and button clicks. The most complete and thorough monitoring option is to record a user session with the EveryStep script recorder to capture how a user actually interacts with multiple pages on the website.  UserView monitoring can also interact with complex Rich Internet Applications (RIAs) to record things like flash and Silverlight.


Filter out Non-Critical Elements

Once you have recorded or identified what you want to monitor, you should run some tests to establish baseline performance, and identify any problematic elements that may exist in the scripts or on the web page.  If there are elements causing problems with monitoring, you can select specific file types to include or exclude and even choose specific domains from which to exclude content.

For example, your website may contain icons in the footer with links to social media platforms such as Facebook or Twitter.  For some websites these may be considered critical components-  if the icons and links are missing, some website administrators may want to be notified immediately while others may not care at all.  With BrowserView and UserView monitors you can filter out individual elements or content from specific domains from causing an error and sending alerts.  You can also setup schedules so if the entire webpage goes down, you can be alerted at 2:00 AM but if the follow me button for twitter is down, you can set a schedule to not send you a notification until 6:00 AM.

After you have established baseline performance of your website by running the script for a few days, you may want to tweak your monitoring script to exclude elements on the page that are not critical to the page load process.  One way to edit a script is to use “deny and allow” filters.  If you only care about content hosted on your domain, you can deny * (a wildcard) and allow only your domain content with an allow http://www.yourdomain.com/* command.  Otherwise, if there are simply a few elements or third-party hosts that you don’t care about you can use deny command on each element or deny an entire domain with deny http://www.example.com*.

Another critical part of a monitoring script can be measuring the time between actions.  Using Network Time-Watchers you can set up timeout filters to measure the time it takes between an action like a button press or navigation and the subsequent result.  With a time-watcher activated you can setup alerts when the monitor detects something is taking too long.

Website Monitoring Decisions

It is important to determine how many pages to monitor and what type of monitoring to use on each page.  While it would be nice to monitor every single page on a website, it is likely not very cost effective.  Many Dotcom-Monitor customers utilize a combination of monitors to fill their monitoring needs.  ServerView is great for detecting uptime.  BrowserView is good for validating content on a single page and UserView moves through and verifies that complex processes are working.

Cached Verses Non-Cached Website Monitoring

Next you need to decide how your website should appear in each monitoring session.  For example, is the monitored session representing a brand new user in a pristine web browser?  If the user has never visited your domain there will be DNS queries involved with their first visit as well as DNS lookups for many of the third party elements on your site.  New users will also have to download every single file, script and image because they will not have anything cached, while a recurring visitor might have many of the static content on your site already cached.  Monitoring your website as if it were a new user each time provides the most insight into the health of your website because it confirms that all DNS records are healthy and all files are accessible on every monitoring session.

Additionally, if the user has recently visited other websites with common elements such as JQuery, JavaScript libraries, and social media icons then the user might have content used on your website already cached with a Time To Live (TTL) value on their local machine.  If you are more interested in simulating the average user experience on your site it is likely they will have a lot of DNS records and site content already cached.  In this case you may want to simulate a returning user with cached content.  To do so, you can select the return visit flag on BrowserView or UserView tasks.

DNS Resolution for Website Monitoring

Next you can determine how to handle DNS resolution- Dotcom-Monitor provides several options to mimic different DNS setups.

  • Device Cached

Device cached checks to see if the DNS record has been resolved within the current monitoring session, and if it has, it uses that record.

  • Non-Cached

Non cached forces the task to look up DNS resolution from the root DNS servers for every element.  This is not realistic for a BrowserView or UserView task so it is only an option on ServerView tasks.

  • TTL Cached

TTL cached is the best option to mimic a real user where DNS is not looked up until the time to live has expired since the last lookup.

  • External DNS Server

External DNS Server allows you to specify the server that will be queried with DNS resolution lookups rather than going to the root servers.


For a full explanation of the different DNS options check out the Dotcom-Monitor Knowledge Base.

Selecting Monitoring Locations

Monitoring results can be affected significantly by changing or limiting the number and location of monitors.  Monitoring from a remote location that you do not normally receive traffic from may skew your results due to higher load times.  Also, monitoring from locations behind the Great Firewall of China can significantly alter average response times because the Chinese government maintains strict control over all traffic in and out of China, and may slow down or break monitoring results due to content filters. Run a China Firewall Test to see how your website and elements load from behind the Great Firewall of China.  Read more about the Great Firewall of China.

Round-Robin Monitoring

The number of locations you monitor from also impacts the frequency of monitoring results received from each location.  Dotcom-Monitor uses a round robin algorithm to gather monitoring data.  This means that we monitor from one location at a time for the frequency you select.  For example, if you have 3 locations selected and 1-minute monitoring, you will see the following results.  At 12:00 PM – California, 12:01 PM Colorado, 12:02 PM New York, 12:03 PM California, 12:04 PM Colorado and so on.  As you can see, the more locations you select, the longer it will be before the queue of monitoring locations comes back to the original location.

An extreme case of this would be if you have 24 locations selected and a frequency of 3 hour monitoring.  One location would monitor once every 3 hours in a round robin fashion, so it could be 72 hours before the first location was checked for a second time.  This is why we may recommend that you remove some locations from remote locations.  Alternatively, you could set up several monitoring devices to monitor the same web page but monitor from different locations.  This could theoretically allow you to monitor at a 1-minute frequency from multiple locations at once, however this does cost more.

Help Setting Up Website Monitoring

At the end of the day, you can see there are a lot of different options to help monitor webpages in a very specific and targeted fashion depending on your needs.  For additional help determining the best monitoring solution to meet your needs, contact Dotcom-Monitor Support.

Latest Web Performance Articles​

Top 15 Infrastructure Monitoring Tools

Infrastructure monitoring tools ensure systems’ optimal performance and availability, enabling the identification and resolution of potential issues before they become complex. This article delves into

Top 20 Server Monitoring Tools of 2023

A server monitoring tool is software that monitors the operation and general health of servers and other components of IT infrastructure. These tools continuously track

Top 25 Server Monitoring Tools

In this article we give our expert picks of the top 25 server monitoring tools to help monitor your website’s uptime and give your users the best experience, starting with our own solution at Dotcom-Monitor. Learn why server monitoring is an essential part of any monitoring strategy.

Top 20 Synthetic Monitoring Tools

Synthetic monitoring allows teams to monitor and measure website and web application performance around the clock from every conceivable vantage point, and to receive alerts before issues begin to impact real users. Here are our top picks for synthetic monitoring tools, leading with our own at Dotcom-Monitor.

Start Dotcom-Monitor for free today​

No Credit Card Required