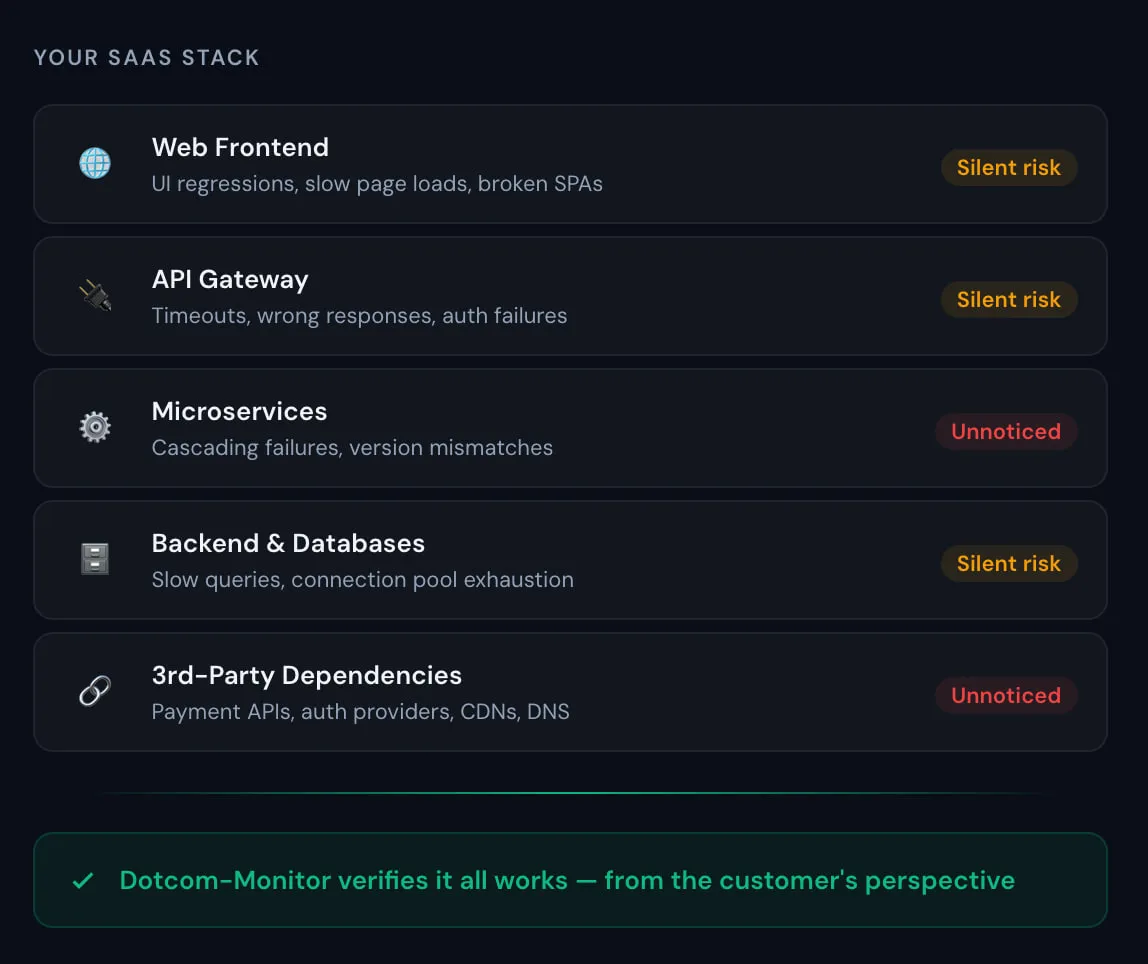
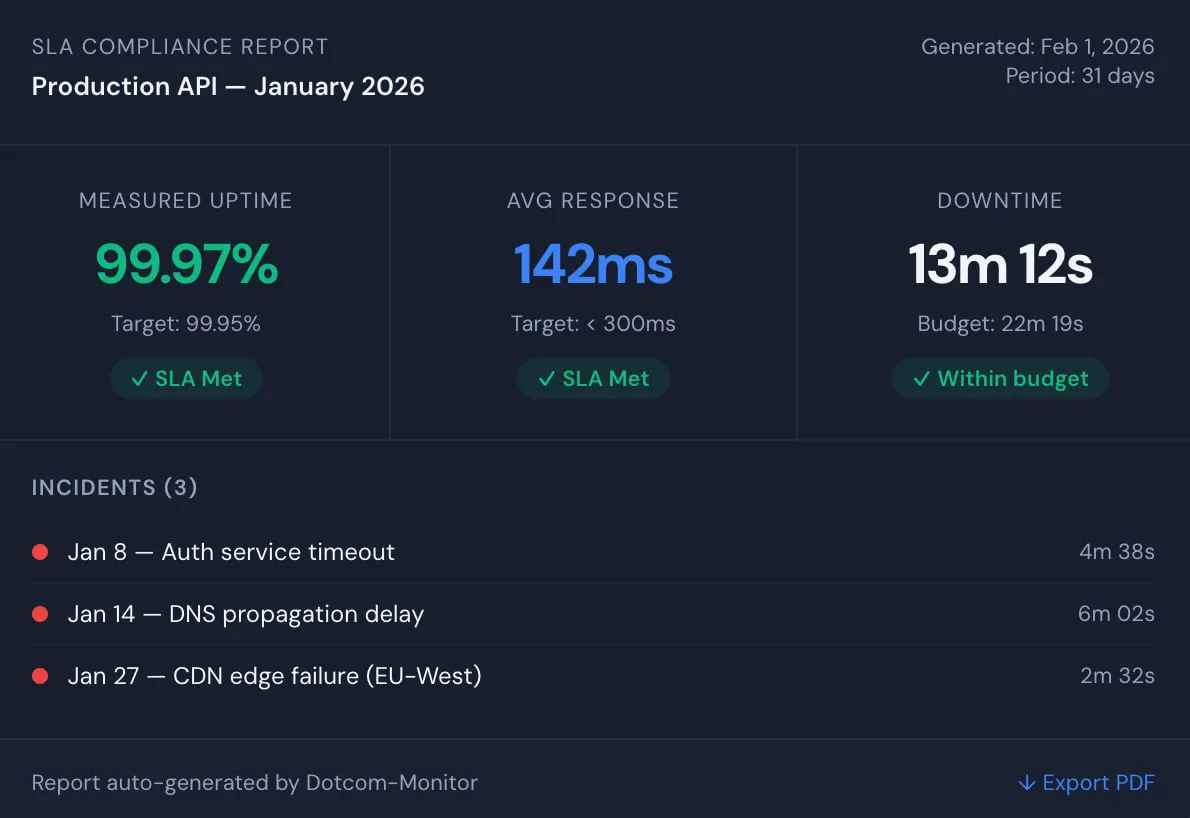
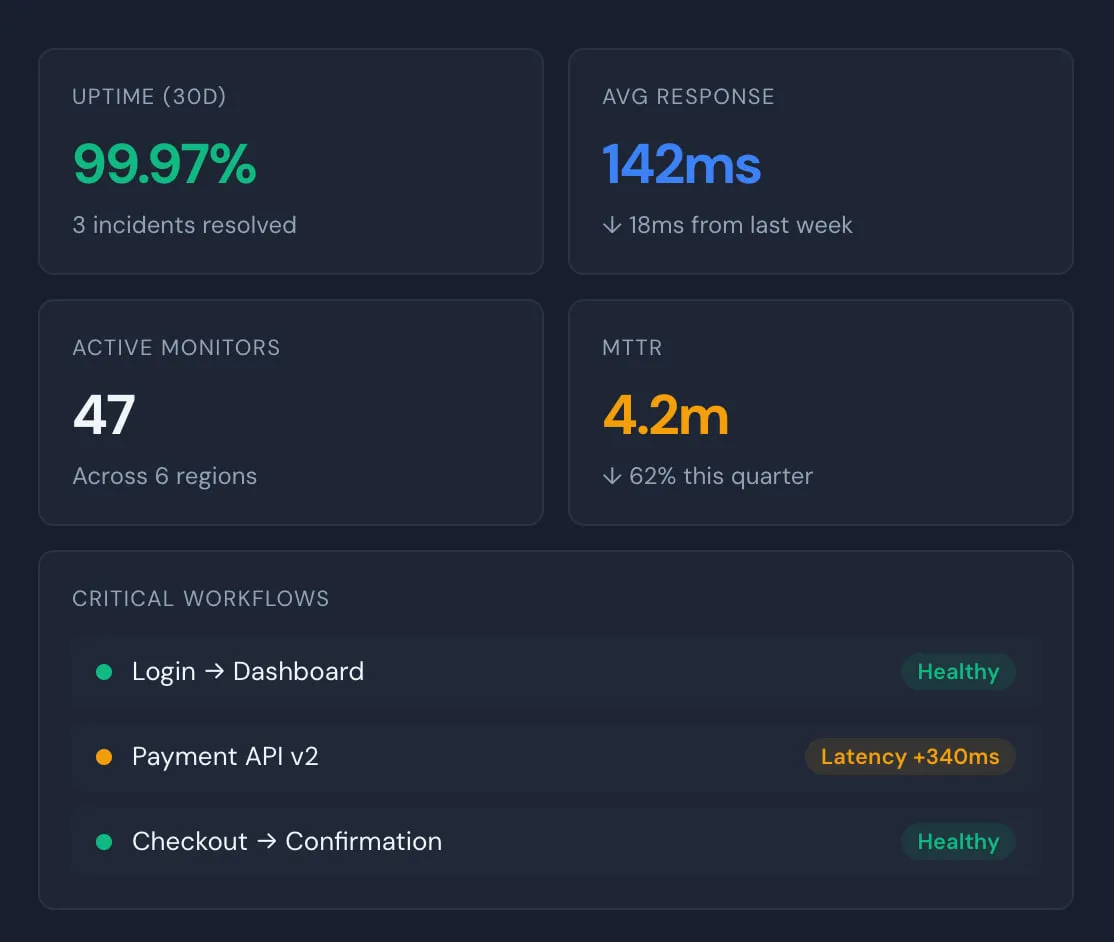
SaaS Monitoring Tool - Detect SaaS Outages and Slowdowns

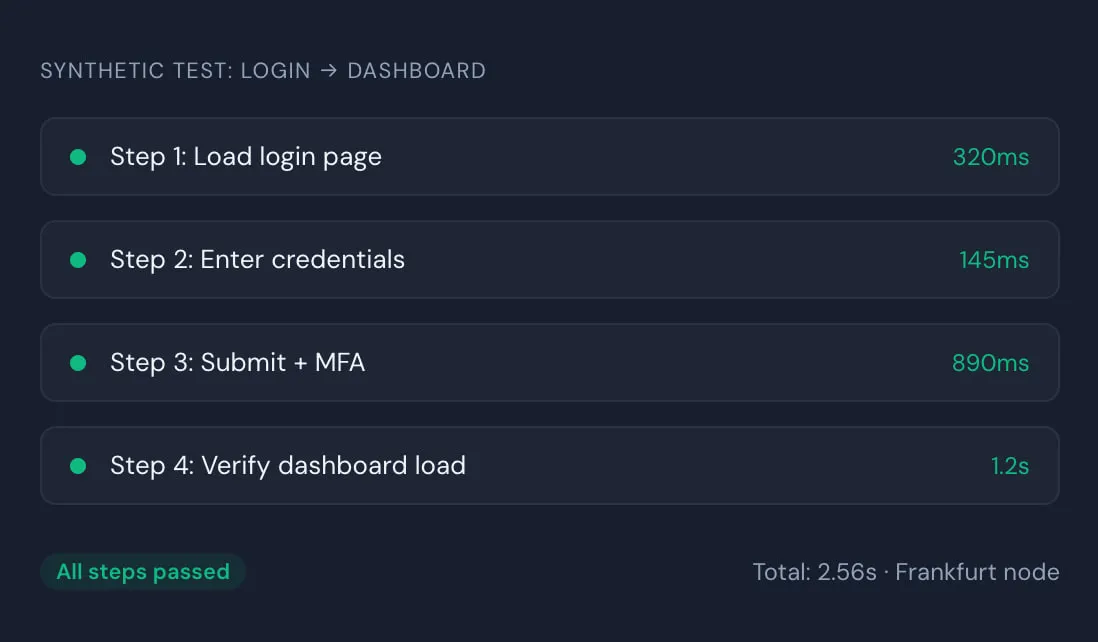
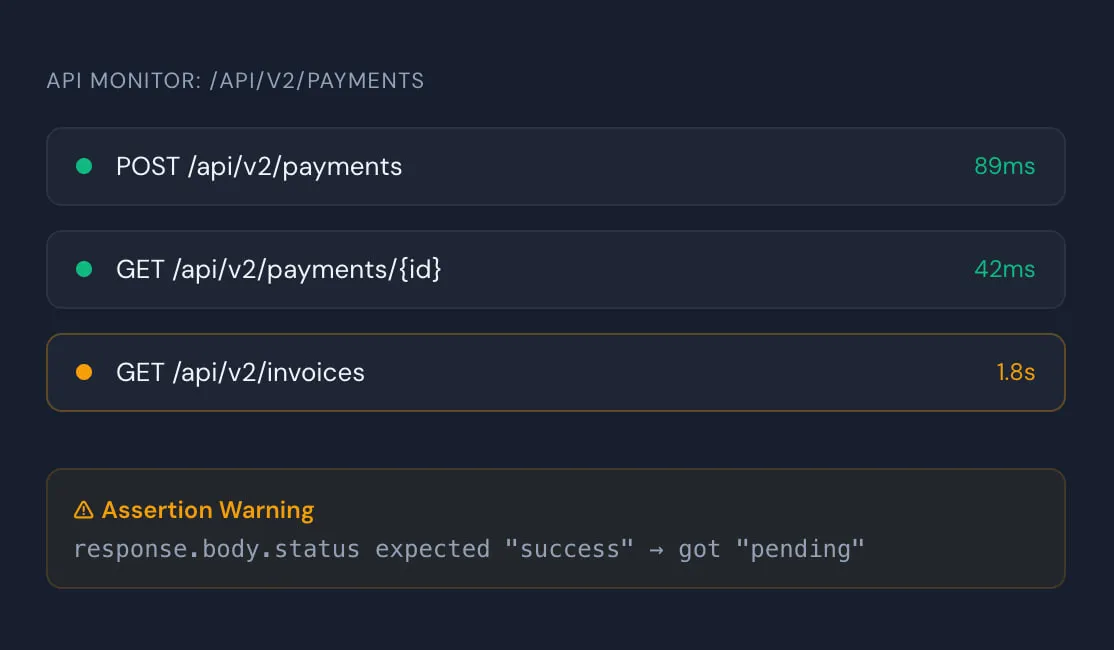
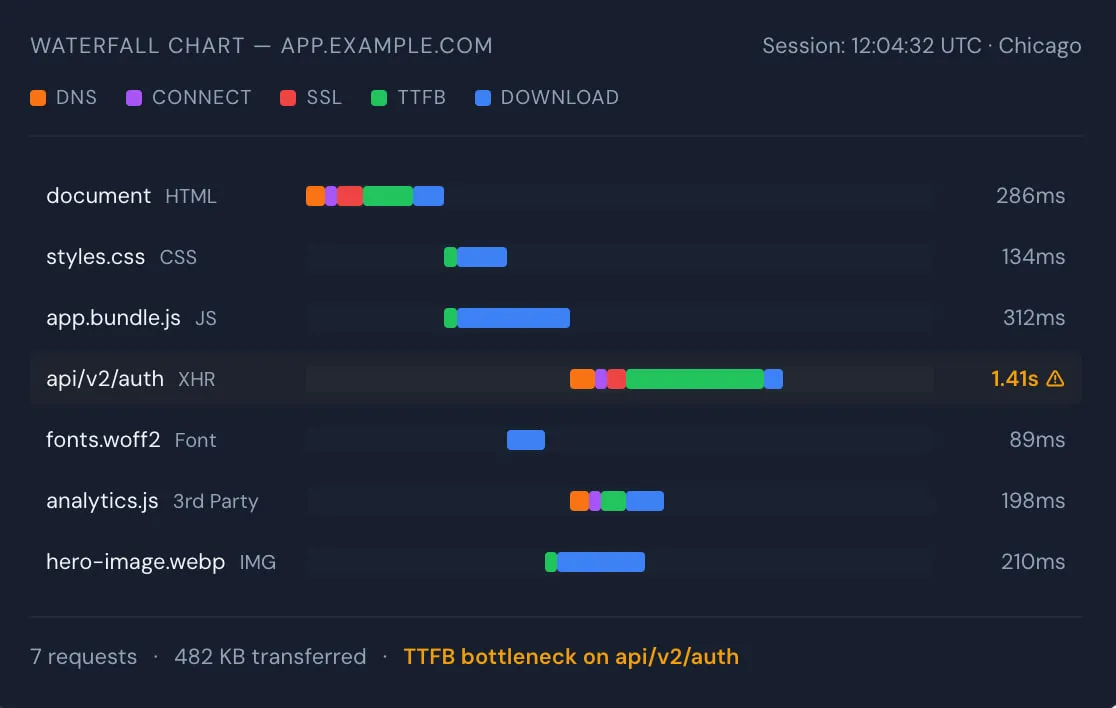
Detect broken logins, slow APIs, and infrastructure failures across your SaaS stack before customers file ticket. One SaaS monitoring platform. Real browsers. Alerts in seconds, not minutes.
SaaS Monitoring Dashboard
62%
reduction in MTTR

“We caught a payment API regression within 90 seconds of deployment. Before Dotcom-Monitor, that would have been a P1 ticket from a customer three hours later.”

Michael Reeves
Sr. SRE, Enterprise SaaS Platform
$140K
in prevented downtime losses

“Synthetic monitoring on our checkout flow alone paid for the platform in the first month. We now detect auth failures before a single user is affected.”

Sarah Kim
VP Engineering, B2B Fintech
Trusted by 10,000+ Organizations Worldwide​
Website monitoring leader since 1998
Aflac logo — Dotcom-Monitor customer
Dell logo — Dotcom-Monitor customer
Comcast logo — Dotcom-Monitor customer
Dish Network logo — Dotcom-Monitor customer
Citrix logo — Dotcom-Monitor customer

4.5/5

Capterra

80 reviews

4.5/5

G2 | Easiest to Use
Users Love Us · 2025

4.5/5

Software Advice
Recommended
The hidden risk

Your SaaS Stack Is More Fragile Than It Looks

SaaS products aren’t a single application — they’re a web of moving parts. Web frontends, API gateways, microservices, databases, third-party integrations, CDNs, DNS providers, payment processors. Any one of them can degrade or fail silently without triggering a single server alert.

The result? Customers experience broken logins, failed checkouts, or empty dashboards — and your team doesn’t find out until the support tickets start rolling in.

Dotcom-Monitor flips the equation. Instead of monitoring individual servers and hoping everything works together, it verifies your product works from the customer’s perspective — testing real workflows, APIs, and dependencies from 30+ global locations, around the clock.

Your SaaS stack is more fragile than it looks

SaaS Monitoring Software to Keep Your Application Always Available

Get started in minutes

Three Steps to SaaS Monitoring That Catches Issues First

No agents to install. No code changes. Set up your first SaaS monitor and get alerted before your users notice anything is wrong.

Point to your endpoints

Enter your URLs, API endpoints, or record browser workflows with our EveryStep scripting tool. No code required.

Under 5 minutes

Choose monitoring locations

Select from 30+ monitoring nodes across North America, Europe, Asia-Pacific, and South America — or deploy private agents behind your firewall.

30 seconds

Get instant alerts

Receive notifications via email, SMS, Slack, PagerDuty, or webhooks the moment performance degrades or an outage hits.

Alerts in seconds
Step 01
Step 02
Step 03
Full-stack SaaS monitoring

Every Layer of Your Stack. One Platform.

Stop juggling five monitoring tools. Cover synthetic workflows, APIs, protocols, and infrastructure from a single dashboard.

SaaS Synthetic Monitoring

Catch Broken Logins and Checkout Failures Before Your Users Do

Simulate multi-step user workflows — login, onboarding, form submissions, checkout — using real Chromium browsers from 30+ locations. Detect failures at the step level, not just “site is up.”

Validate API Responses, Not Just Status Codes

Monitor REST and SOAP APIs by validating response bodies, schemas, and business logic — not just status codes. Catch silent failures where your API returns 200 OK but the data is wrong, before downstream systems break.

SaaS API Monitoring
SaaS Network & DNS Monitoring

Pinpoint Whether It’s Your App, Your Network, or Your DNS

When latency spikes, you need to know if it’s application code, DNS resolution, or a routing change. Protocol monitoring isolates the root cause across your dependencies.

Actionable Alerts — Not Noise That Gets Ignored

Configure threshold-based alerts with escalation policies, suppression rules, and multi-channel delivery — so your on-call team sees only alerts that require action, not noise.
SaaS Monitoring Alerts & Reports
SaaS SLA Compliance Report
SLA reporting

Prove SaaS Uptime to Customers – Hold Vendors Accountable

For SaaS companies, SLAs aren’t just internal targets — they’re contractual commitments. Your customers expect proof that you delivered on your uptime promise. And when a third-party dependency causes an outage, you need data to hold that vendor accountable.

Dotcom-Monitor’s SLA reports automatically calculate availability percentages, response time compliance, and downtime budgets for any monitoring period. No spreadsheets. No manual math. Just share the report.

Auto-calculated uptime % and downtime minutes for any date range
Prove SLA compliance to customers with exportable PDF reports
Hold third-party vendors and cloud providers to their uptime commitments
Track response time against SLA thresholds with breach alerts
Why SaaS teams switch to Dotcom-Monitor

Maximize Uptime With Proactive SaaS Monitoring Visibility

Every minute of undetected downtime costs revenue, trust, and engineering hours. Here’s how proactive monitoring changes the equation.

Prevent Login and Auth Failures

Synthetic browser tests validate your authentication flow — SSO, MFA, session management — every few minutes from real Chromium browsers, catching regressions before any user is locked out.

Protect Revenue-Critical Workflows

Monitor onboarding, checkout, and subscription renewal flows end-to-end. Detect step-level failures that would otherwise silently block signups and payments.

Ensure API Integration Reliability

Go beyond status code checks. Validate response bodies, schemas, and business logic to catch silent data corruption before it cascades through partner integrations.

Isolate App vs. Infrastructure Issues

Correlate synthetic tests, API checks, DNS timing, traceroute data, and server metrics to pinpoint whether the problem is your code, your CDN, or your cloud provider.

Platform architecture

Enterprise SaaS Monitoring Tool: Full-Stack Architecture

Security, compliance, and scale — without a six-month procurement process.

30+ Global Monitoring Nodes

Monitoring nodes across North America, Europe, Asia-Pacific, and South America simulate users from where your customers are. Detect geography-specific issues within seconds.

Private Monitoring Agents

Deploy agents behind your firewall to monitor internal systems, staging environments, and private APIs without exposing them to the public internet.

Role-Based Access Control

Per-team and per-role permissions for departments and multi-tenant accounts. SOC 2-aligned access policies.

API Access & Integrations

REST API for automation. Native integrations with Slack, PagerDuty, Teams, Jira, and 20+ tools.

SLA Dashboards & Reports

Automated SLA tracking, shareable dashboards, and exportable PDF reports to prove uptime to customers and stakeholders.

Multi-Tenant Enterprise

Manage multiple brands or business units from a single account with isolated configurations and reporting.

FAQ

Common Questions

Can’t find what you need? Talk to our team →

SaaS monitoring is the practice of continuously testing your software-as-a-service application’s availability, performance, and functionality from the end-user’s perspective. It uses synthetic checks from global locations to validate that login flows, APIs, and critical transactions work correctly—detecting issues before customers report them.

You can set up your first SaaS monitor in under 5 minutes. For simple uptime checks, configuration takes under 60 seconds. Multi-step browser workflows can be recorded using the EveryStep point-and-click tool without writing code. API monitors can be imported directly from Postman or Insomnia collections.

Use synthetic browser monitoring to test your complete authentication flow. Record the login sequence with Dotcom-Monitor’s EveryStep tool, including SSO redirects, MFA prompts, and session validation. The monitor runs these tests every few minutes from real Chromium browsers across 30+ global locations, alerting you immediately if authentication fails.

Yes. Deploy Dotcom-Monitor’s Private Agents within your network to monitor internal systems, staging environments, and private APIs without exposing them to the public internet. Private Agents initiate outbound connections only—no inbound firewall rules required. Available for Windows and Linux environments.

Dotcom-Monitor specializes in synthetic monitoring with real browser testing and flat-rate pricing (not per-host). Key differences: native Postman/Insomnia import, setup in under 5 minutes, 30+ global locations, and multi-step transaction testing included in base pricing. Unlike APM-focused tools, Dotcom-Monitor tests from the outside-in—the way your customers experience your application.

Essential SaaS monitoring metrics include: Availability (uptime percentage, target 99.9%+), Response Time (page load, API latency, TTFB), Error Rate (failed transactions, HTTP errors), Transaction Success Rate (login, checkout, form submissions), and Geographic Performance (latency by region). Dotcom-Monitor tracks all these with P95/P99 percentiles and SLA compliance reporting.

Dotcom-Monitor offers three tiers: Free Forever ($0/month for up to 25 targets), Subscription (starting at $19.99/month for up to 100 targets with 1-minute checks), and Enterprise (custom pricing for unlimited targets). All plans include synthetic monitoring, API checks, and multi-step transactions. No per-host pricing.

Yes. You can monitor any third-party SaaS application or API that your business depends on. Set up synthetic checks against Salesforce, Slack, payment gateways (Stripe, PayPal), identity providers (Okta, Auth0), and other external services. This helps you isolate whether outages originate from your infrastructure or third-party dependencies.

SaaS monitoring (synthetic monitoring) tests your application from the outside-in, simulating user interactions from global locations. APM (Application Performance Monitoring) observes from the inside-out, tracking code execution, database queries, and server metrics. SaaS monitoring catches DNS, CDN, and network issues that APM misses. Most teams use both: APM for debugging code issues, synthetic monitoring for validating customer experience.

Dotcom-Monitor automatically calculates availability percentages, response time compliance, and downtime minutes for any monitoring period. Generate exportable PDF reports showing your actual uptime against SLA thresholds. Use these reports for customer reviews, contract renewals, and holding third-party vendors accountable for their uptime commitments.

Start Monitoring Your SaaS App Today

Reduce downtime, detect issues before your customers do, and prove your SLA compliance. All features included in the trial. No credit card. Cancel anytime.