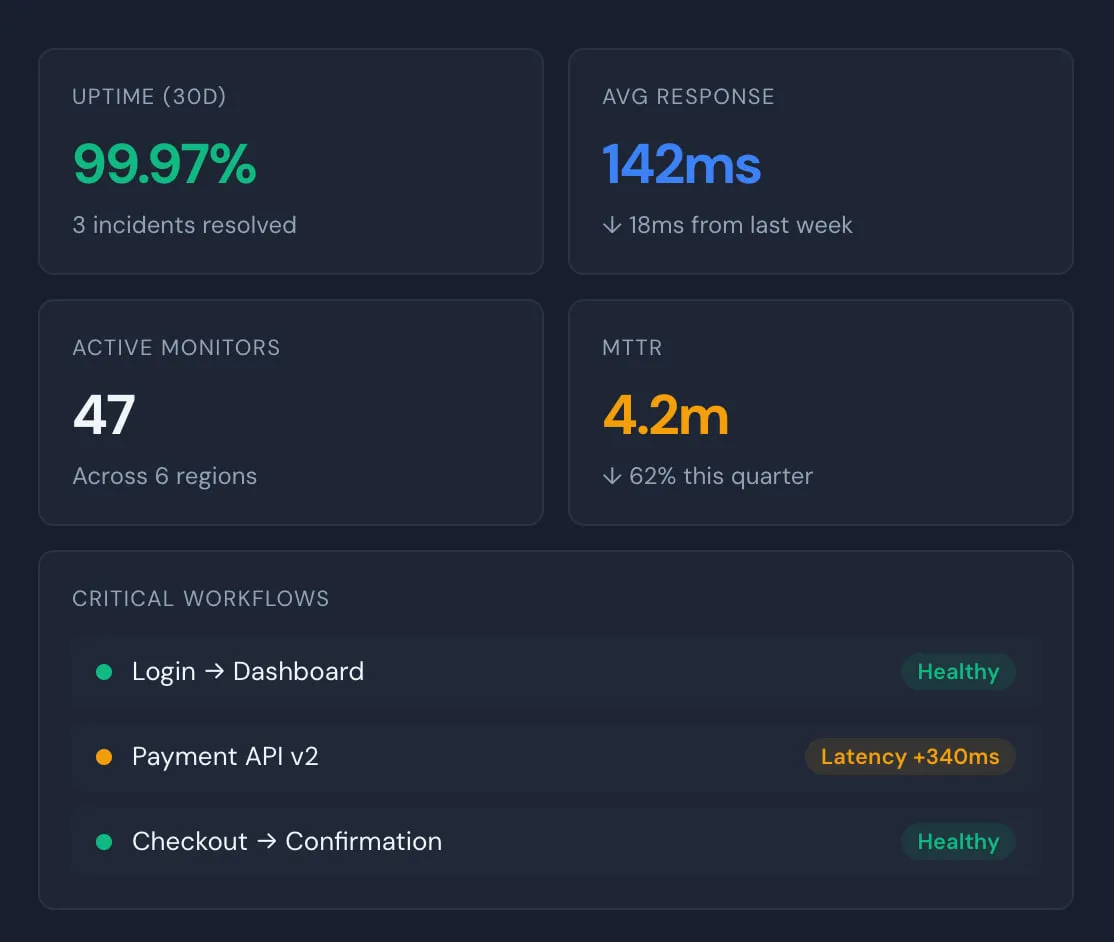
“我们在部署后90秒内发现了支付API的回归。在使用Dotcom-Monitor之前,客户通常要在三小时后提交P1工单。”
“仅我们结账流程的合成监控,就在第一个月内支付了平台费用。我们现在能在单个用户受影响前检测到认证失败。”
4.5
82 条评论
4.5
4.5
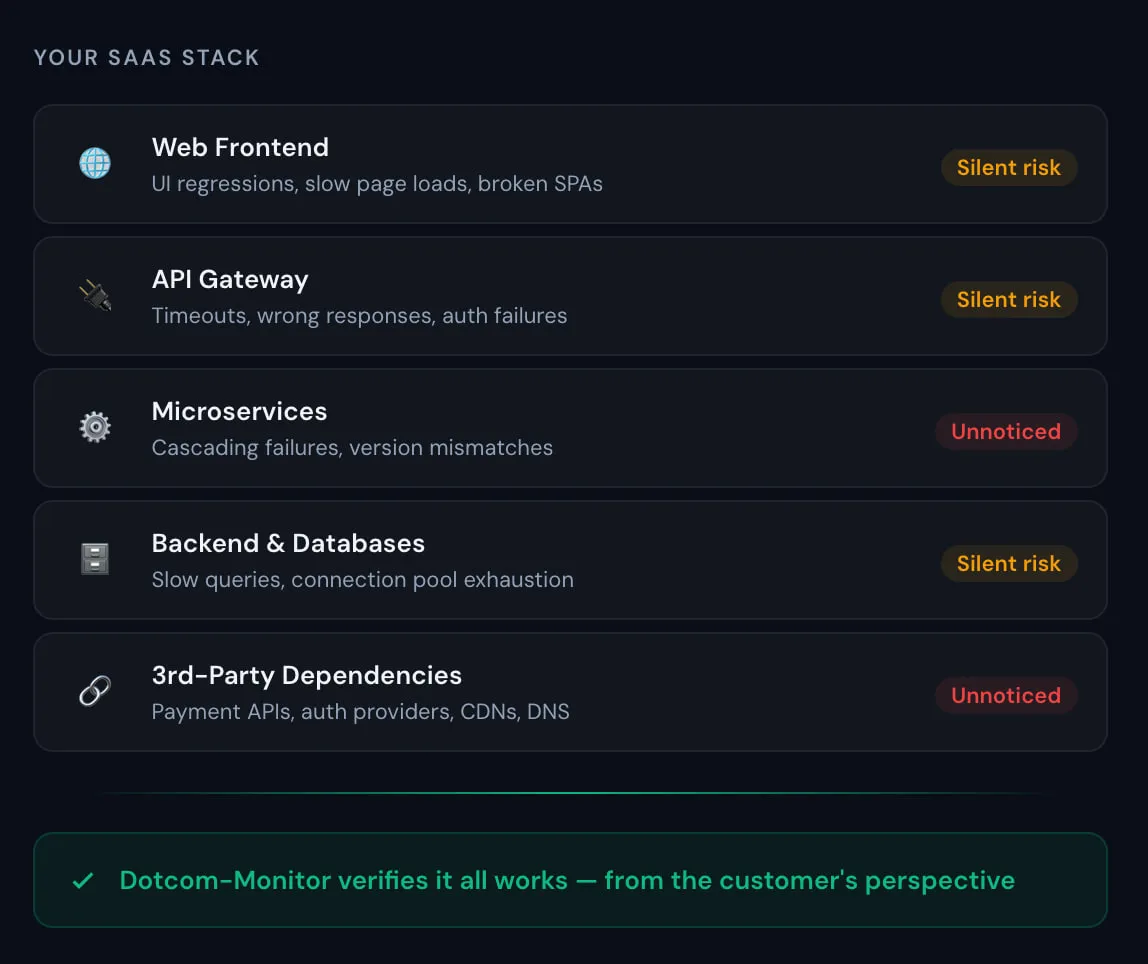
您的SaaS堆栈比看起来更脆弱
SaaS产品不是单一应用程序——它们是一个动态组件的网络。网络前端、API网关、微服务、数据库、第三方集成、CDN、DNS提供商、支付处理器。任何一个部分都可能降级或无声失败,而不会触发任何服务器警报。
结果?客户会遇到登录失败、支付失败或仪表盘空白——而您的团队直到支持工单开始涌入才会发现问题。
Dotcom-Monitor改变了这一公式。它不是监控单个服务器并希望一切顺利,而是从客户视角验证您的产品是否正常工作——全天候从30多个全球地点测试真实工作流、API和依赖项。
三步骤实现领先发现问题的SaaS监控
无需安装代理。无需更改代码。设置您的第一个SaaS监控器,并在用户发现异常之前收到警报。
指向您的端点
输入您的URL、API端点,或使用EveryStep脚本工具录制浏览器工作流。无需编码。
选择监控位置
从北美、欧洲、亚太和南美的 30 多个监控节点中选择,或在防火墙后部署私有代理。
获取即时警报
在性能下降或发生故障时,通过电子邮件、短信、Slack、PagerDuty 或 webhook 立即收到通知。
您的堆栈的每一层,一个平台。
停止同时使用五个监控工具。从单一仪表板覆盖合成工作流、API、协议和基础设施。
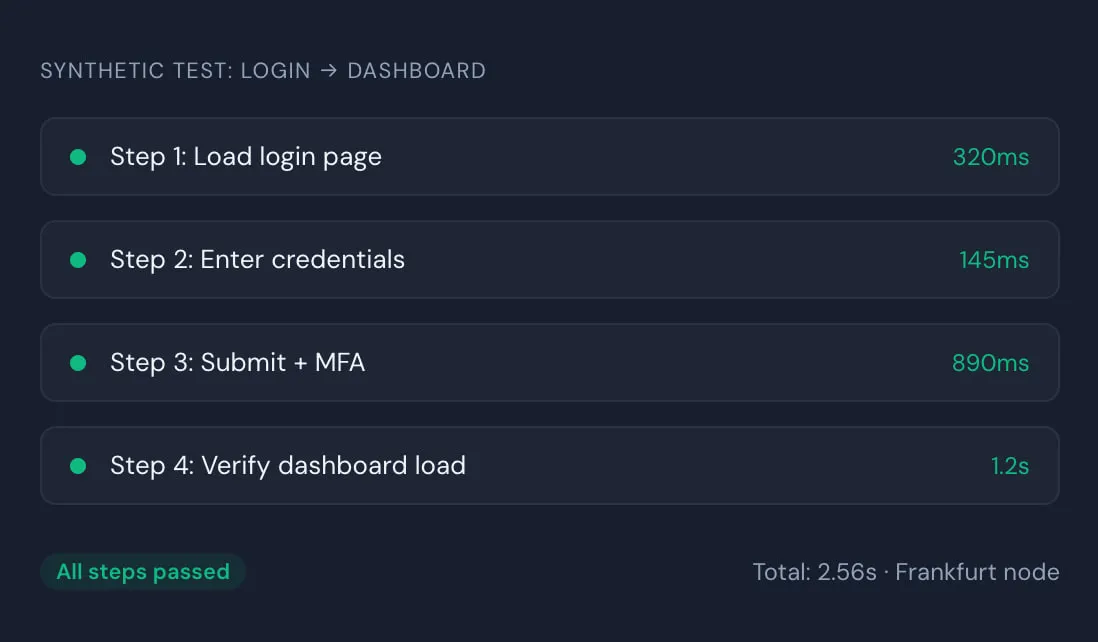
捕捉登录失败和结账失败,先于用户发现
使用来自 30 多个地点的真实 Chromium 浏览器模拟多步骤用户工作流——登录、入职、表单提交、结账。检测步骤级别的失败,而不仅仅是“网站是否可用”。
- 使用 EveryStep 录制器进行多步骤事务脚本
- 登录、SSO 和认证流程验证
- SPA 行为、AJAX 和 WebSocket 交互测试
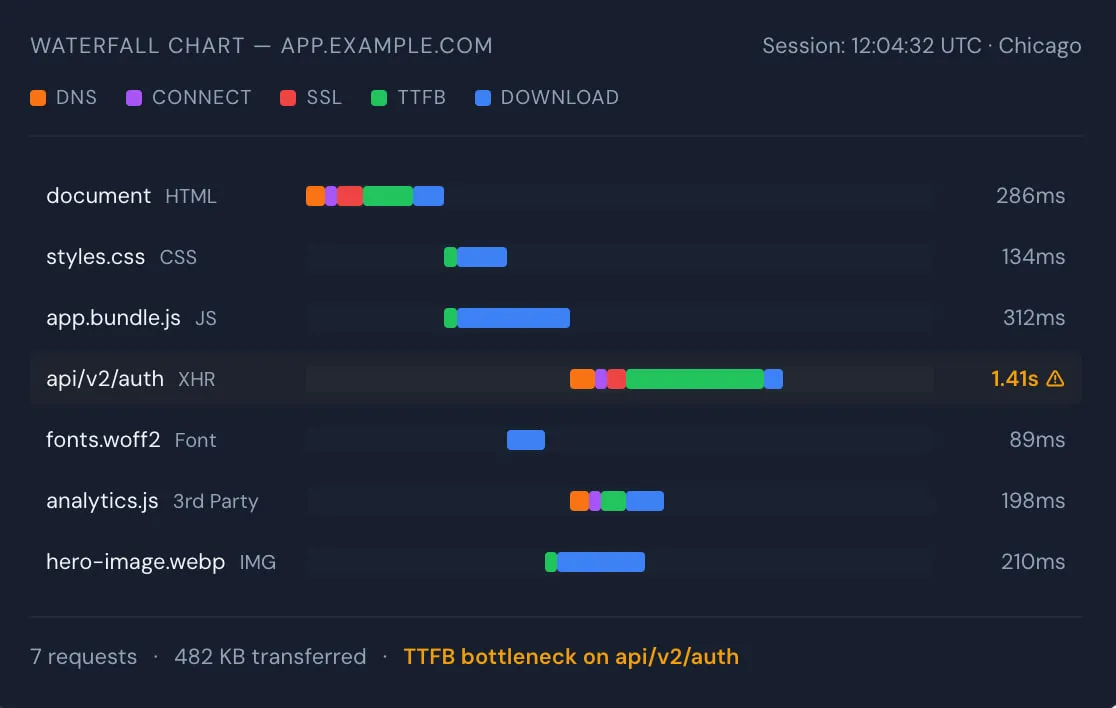
- 步骤级计时、截图和瀑布诊断
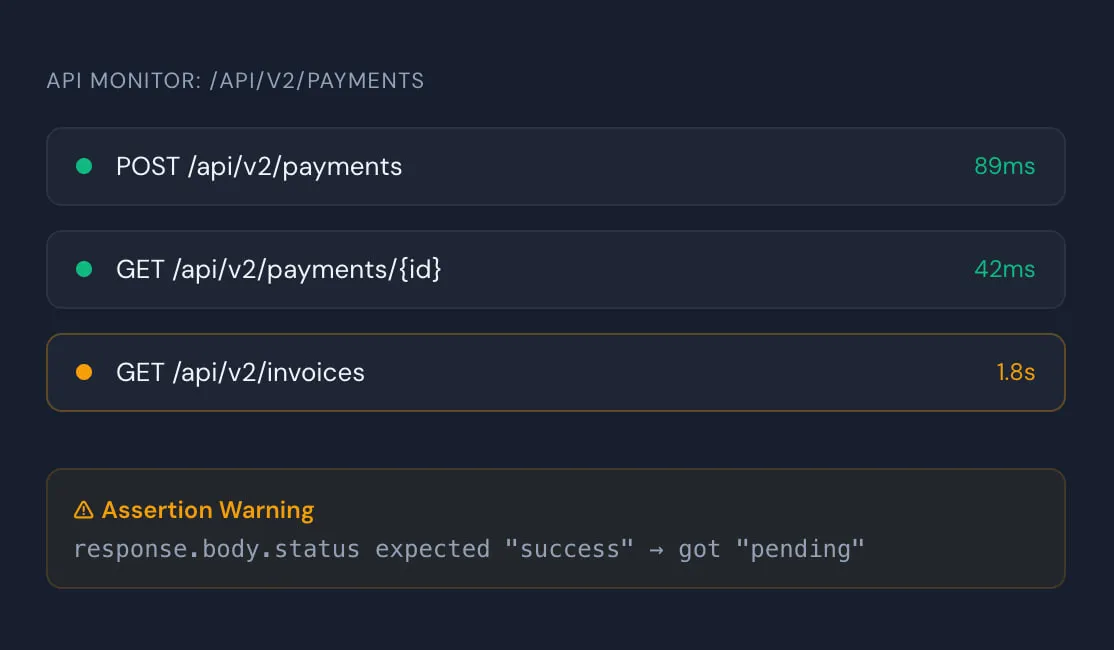
验证 API 响应,而不仅是状态码
通过验证响应体、模式和业务逻辑监控 REST 和 SOAP API —— 不仅是状态码。捕捉 API 返回 200 OK 但数据错误的隐性失败,防止下游系统故障。
- JSON/XML 响应体断言和模式验证
- 支持参数传递的多步骤 API 链
- 从 Postman 和 Insomnia 集合导入
- OAuth、Bearer 令牌和自定义认证工作流

准确定位问题是在您的应用、网络,还是DNS
- DNS解析时间和传播监控
- TCP/UDP端口可用性和响应时间
- Traceroute路径分析和跳点级延迟
- SMTP、FTP/SFTP、SIP和SSL证书监控
可操作的警报——而非被忽视的噪音
- 电子邮件、短信、Slack、PagerDuty、Teams和Webhook传递
- 支持升级链和值班轮换
- 警报抑制以消除重复噪音
- SLA跟踪仪表板和历史性能报告
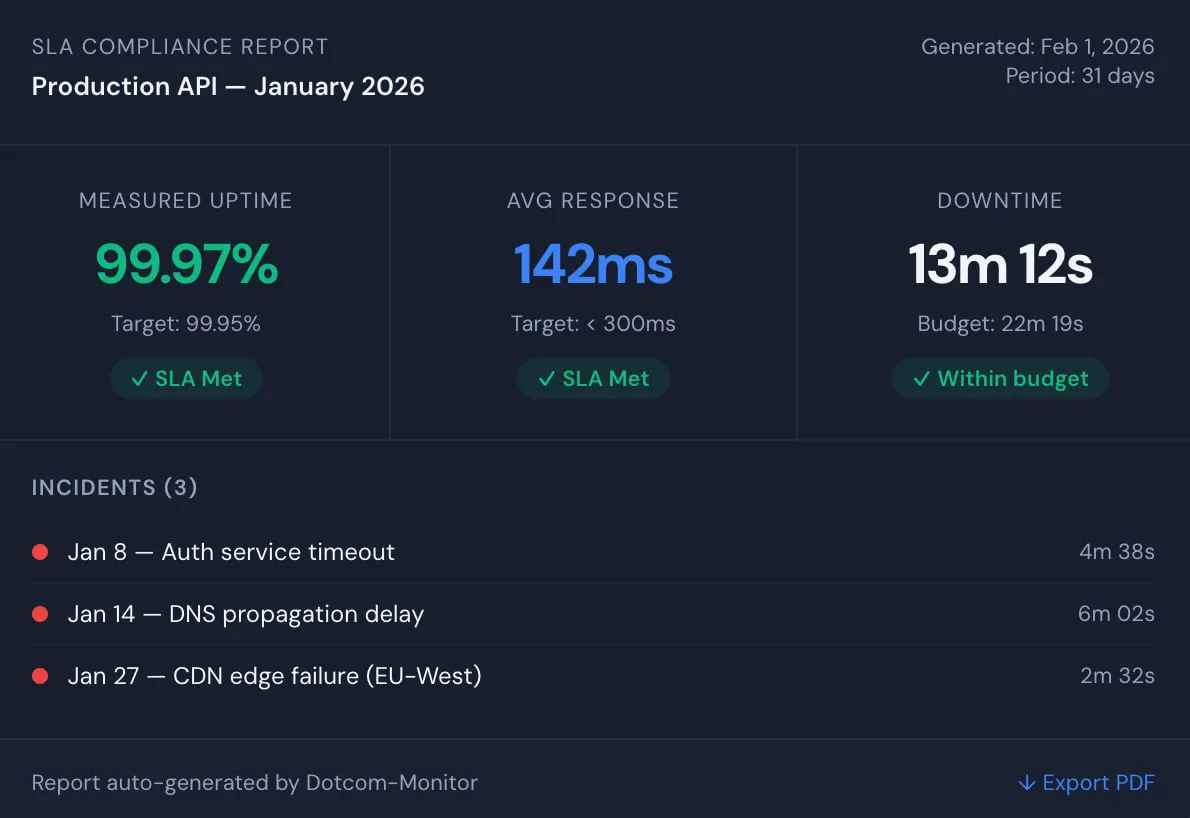
向客户证明SaaS正常运行时间——让供应商承担责任
对SaaS公司来说,SLA不仅仅是内部指标——它们是合同承诺。您的客户期望您提供正常运行时间承诺的证明。当第三方依赖项导致服务中断时,您需要数据追究该供应商的责任。
Dotcom-Monitor的SLA报告自动计算任何监控期间的可用百分比、响应时间合规性和停机预算。无需电子表格,无需手动计算。只需分享报告。
通过主动的SaaS监控可见性最大化正常运行时间
每分钟未检测的停机时间都会导致收入、信任和工程小时的损失。这就是主动监控如何改变局面的方式。
防止登录和身份验证失败
合成浏览器测试每隔几分钟从真实的Chromium浏览器验证您的身份验证流程——SSO、多因素认证、会话管理——捕捉回归问题,防止任何用户被锁定。
保护关键收入工作流程
端到端监控注册、结账和订阅续订流程。检测可能静默阻止注册和付款的步骤级失败。
确保API集成的可靠性
超越状态码检查。验证响应体、模式和业务逻辑,及时捕获静默数据损坏,防止其在合作伙伴集成中蔓延。
区分应用与基础设施问题
关联合成测试、API检查、DNS时延、路由追踪数据和服务器指标,准确定位问题是出在您的代码、CDN还是云提供商。
企业级SaaS监控工具:全栈架构
安全、合规与规模——无需六个月的采购流程。
30+全球监控节点
监控节点遍布北美、欧洲、亚太和南美,模拟来自客户所在地的用户。秒级检测地域特定问题。
私有监控代理
在您的防火墙后部署代理,监控内部系统、预发布环境和私有API,无需将其暴露于公共互联网。
基于角色的访问控制
API访问与集成
SLA仪表盘与报告
多租户企业
什么是SaaS监控?
SaaS监控是从终端用户视角持续测试您的软件即服务应用的可用性、性能和功能的过程。它使用来自全球位置的合成检查来验证登录流程、API和关键事务的正常工作—在客户报告问题之前发现问题。
我多快可以设置好SaaS监控?
您可以在不到5分钟内设置第一个SaaS监控。对于简单的正常运行时间检查,配置时间不到60秒。可以使用EveryStep点按式工具录制多步骤浏览器工作流,无需编写代码。API监控可以直接从Postman或Insomnia集合导入。
如何监控登录和身份验证流程?
使用合成浏览器监控测试完整的身份验证流程。使用Dotcom-Monitor的EveryStep工具录制登录序列,包括单点登录重定向、多因素认证提示和会话验证。监控程序每隔几分钟从30多个全球真实Chromium浏览器位置运行这些测试,如果身份验证失败会立即报警。
我可以监控内部或防火墙后的系统吗?
可以。在您的网络内部署Dotcom-Monitor的私有代理,监控内部系统、暂存环境和私有API,而无需将它们暴露给公共互联网。私有代理仅发起出站连接,无需入站防火墙规则。支持Windows和Linux环境。
Dotcom-Monitor与Datadog或Pingdom有何不同?
Dotcom-Monitor专注于具有真实浏览器测试和统一收费(非按主机计费)的合成监控。主要区别包括原生支持Postman/Insomnia导入,5分钟内完成设置,30多个全球测试点,基础价格包含多步骤事务测试。与以APM为中心的工具不同,Dotcom-Monitor从外向内测试—以客户体验的方式测试您的应用。
我应该跟踪哪些SaaS监控指标?
关键的SaaS监控指标包括:可用性(正常运行时间百分比,目标99.9%+)、响应时间(页面加载、API延迟、TTFB)、错误率(失败交易、HTTP错误)、事务成功率(登录、结账、表单提交)和地理性能(按区域延迟)。Dotcom-Monitor跟踪所有这些指标,并提供P95/P99分位数和SLA合规报告。
SaaS监控的费用是多少?
Dotcom-Monitor提供三种方案:永久免费(每月$0,最多25个目标)、订阅版(起价每月$19.99,最多100个目标,1分钟检查间隔)和企业版(自定义价格,无限制目标)。所有计划均包含合成监控、API检查和多步骤事务。无按主机计费。
我可以监控第三方SaaS应用如Salesforce或Slack吗?
可以。您可以监控任何业务依赖的第三方SaaS应用或API。设置针对Salesforce、Slack、支付网关(Stripe、PayPal)、身份提供者(Okta、Auth0)及其他外部服务的合成检查。这有助于您区分故障是来源于您自身基础设施还是第三方依赖。
SaaS监控与APM有什么区别?
SaaS监控(合成监控)从外部视角测试您的应用,模拟来自全球位置的用户交互。APM(应用性能监控)则从内部观察,跟踪代码执行、数据库查询和服务器指标。SaaS监控能捕获APM遗漏的DNS、CDN和网络问题。大多数团队两者兼用:APM用于调试代码问题,合成监控用于验证客户体验。
我如何向客户证明SLA合规?
Dotcom-Monitor自动计算任何监控周期的可用性百分比、响应时间合规率和停机分钟数。生成可导出的PDF报告,显示您的实际正常运行时间与SLA阈值的对比。可用于客户审查、合同续约和要求第三方供应商承担其正常运行时间承诺的责任。