REST API Monitoring: Validate, Benchmark & Protect Your Endpoints
Monitor REST APIs from Logic to Latency, in One Unified Dashboard.
Detect errors before users do. Dotcom-Monitor’s REST API Monitoring runs global synthetic checks on your endpoints, validates payloads, benchmarks latency, and alerts your team the moment something breaks.
⭐ G2 Top Performer | SOC 2 Type II | 99.99 % Uptime SLA | ISO 27001 Certified
Trusted by 10,000+ Organizations Worldwide
Website monitoring leader since 1998
Watch How It Works
Watch how REST API Monitoring detects failing calls, validates JSON/XML payloads, and blocks faulty deployments before release.
Why REST API Monitoring Is Mission-Critical
REST APIs power modern digital ecosystems
APIs are the connective tissue of modern software. A single broken endpoint can disrupt payments, dashboards, or integrations. Dotcom-Monitor continuously tests every call — from auth to order confirmation, ensuring your backend logic holds up globally.
Downtime is expensive — in dollars and trust
A 500-error at checkout or a 30-second latency spike costs more than user frustration.Our synthetic probes across 30+ regions track p50/p95/p99 latency, timeouts, and failure spikes, before customers notice.
Manual checks don’t scale
One-off curl calls or Postman scripts can’t simulate production traffic. Dotcom-Monitor automates testing and validates response correctness for instant diagnosis.
How Dotcom-Monitor Tests REST Endpoints
Quick Setup — No Scripts Required
Create REST monitors in minutes.
Enter endpoint and method (GET/POST/PUT/DELETE)
Add headers, payload, and authentication (API key, Basic, OAuth2, JWT)
Run tests automatically on schedule
Validate Payloads and Schema Integrity
Check headers, JSON schema, and XML nodes for data consistency:
Detect missing keys, wrong types, null fields, or outdated values
Validate business rules via assertions(status == "success", data.count > 0)
Explore Assertions Monitoring to learn how to validate every data field, not just uptime.
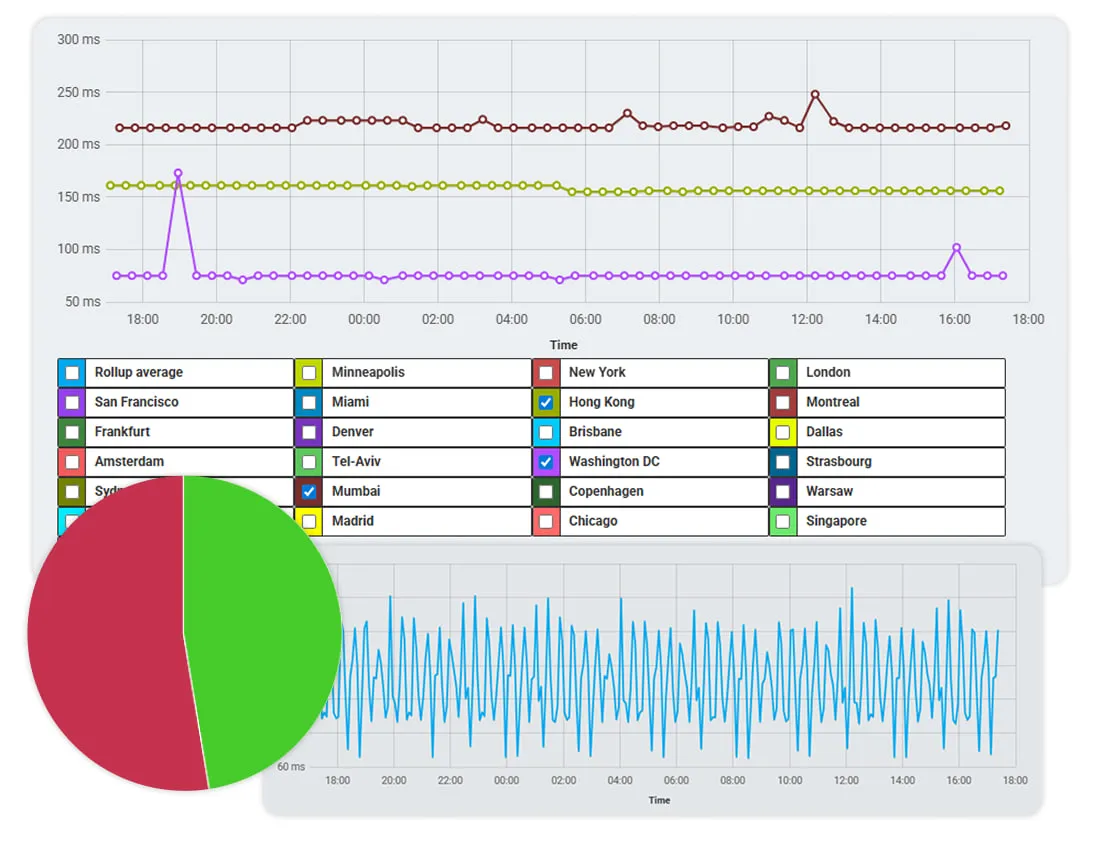
Track Latency & Response Trends
Monitor response times, uptime, and error rates over time.
Use online reports to analyze performance by monitoring location and identify slow or failing endpoints.
Proof Asset: Tri-chart (latency | availability | errors) from live dashboard.
Detect & Diagnose HTTP Errors Instantly
Each monitoring run captures detailed logs, HTTP status codes, and full request/response payloads for fast issue diagnosis.
💡 Note: Both monitoring types complement each other; API-level checks ensure backend reliability, while browser-based recording validates full end-to-end user experiences.
Advanced REST API Validation
Handle Real-World Network Conditions
Monitor API performance from globally distributed locations to identify latency variation, regional bottlenecks, and inconsistent response behavior.
Chained Requests and Dependency Flow
Simulate multi-step backend workflows:
POST /login → token → GET /user/{id} → POST /order → assert $.order.status == "success"