API monitoring is the continuous, automated practice of validating API endpoints for availability, response time, and data correctness — confirming not only that an endpoint responds, but that it returns the right data, in the right format, within acceptable latency, from the perspective of users and dependent systems.

APIs are the connective tissue of modern software. Every time a user logs in, submits a payment, or receives a real-time notification, multiple API calls execute behind the scenes — often across microservices, cloud providers, and third-party vendors. When those calls fail or slow down, the impact is immediate: broken checkout flows, locked-out users, and lost revenue.
Yet most teams only discover API failures when customers report them. Without proactive monitoring, the lag between failure and investigation is typically measured in tens of minutes — long enough to expose real revenue and SLA risk before anyone is paged.
This guide explains what API monitoring is, how it works, which metrics to track, how it differs from API testing and APM, and how to implement it — with the precision DevOps engineers, SREs, and QA teams need to make informed production decisions.
What Is API Monitoring?
API monitoring covers three distinct layers of validation, in order of increasing specificity:
- Availability monitoring — Is the endpoint reachable? Does it return an HTTP response without timeout?
- Performance monitoring — How long does the response take? Is TTFB, DNS resolution, or TLS handshake introducing latency?
- Payload validation — Does the response body contain the expected data structure? Do JSONPath or XPath assertions pass?
What Is an API Endpoint?
An application programming interface (API) is a set of protocols and definitions that allows software systems to communicate. An API endpoint is the specific URL at which an API receives requests and returns responses — the unit of observation for API monitoring. For example:
POST /v2/auth/token— token issuance endpointGET /v2/orders/{id}— order retrieval endpointPOST /v2/payments/charge— payment processing endpoint
Modern applications depend on dozens or hundreds of such endpoints simultaneously — internal microservices, third-party payment gateways, identity providers, shipping APIs, and CRM systems. API monitoring maintains visibility across all of them.
Types of API Monitoring
Not all API monitoring is the same. Understanding the categories helps teams build coverage that matches both their architecture and their business requirements. The five core types apply to almost every team; the specialized types matter when their conditions apply.
Core Types
| Type | What It Validates | Best For |
|---|---|---|
| Uptime Monitoring | Endpoint reachability; HTTP response codes; response within timeout window | Basic availability SLAs; immediate outage detection |
| Performance Monitoring | Response time, TTFB, DNS resolution, TCP handshake, TLS time, throughput | Latency SLAs, P95/P99 targets, capacity planning |
| Payload / Validation Monitoring | Response body via JSONPath/XPath assertions; schema correctness; field values | Catching silent failures where HTTP 200 ≠ correct data |
| Synthetic Monitoring | Simulated API calls from global locations at scheduled intervals, independent of real traffic | Proactive detection; geographic coverage; zero-traffic periods |
| Multi-Step Transaction Monitoring | Chained API call sequences (e.g., auth → query → submit → confirm); inter-step data passing | E-commerce flows, login journeys, order workflows |
Specialized Types
| Type | What It Validates | Best For |
|---|---|---|
| Security Monitoring | Auth failures, anomalous request patterns, certificate expiry, rate-limit abuse, token replay | FinTech, healthcare; APIs handling PII/PHI |
| Compliance-Related Checks | TLS version/cipher validation, certificate expiry, security header presence, auth enforcement testing | Healthcare, financial services, regulated industries |
| Real User Monitoring (RUM) | Actual user API interactions; full-session visibility; real geographic and device variance | Understanding true user impact; validating synthetic findings |
| Versioning & Deprecation Monitoring | API version adoption rates; error spikes after version changes; backward compatibility | Teams managing multiple API versions concurrently |
| Third-Party / Integration Monitoring | External API dependencies (Stripe, Okta, Salesforce, Twilio); isolating external vs. internal failures | Any app depending on third-party APIs for critical workflows |
A note on compliance-related checks: these provide supporting evidence for specific technical controls. Framework compliance (HIPAA, PCI DSS, SOC 2) requires broader organizational governance beyond what monitoring alone can deliver.
Synthetic Monitoring vs. Real User Monitoring (RUM)
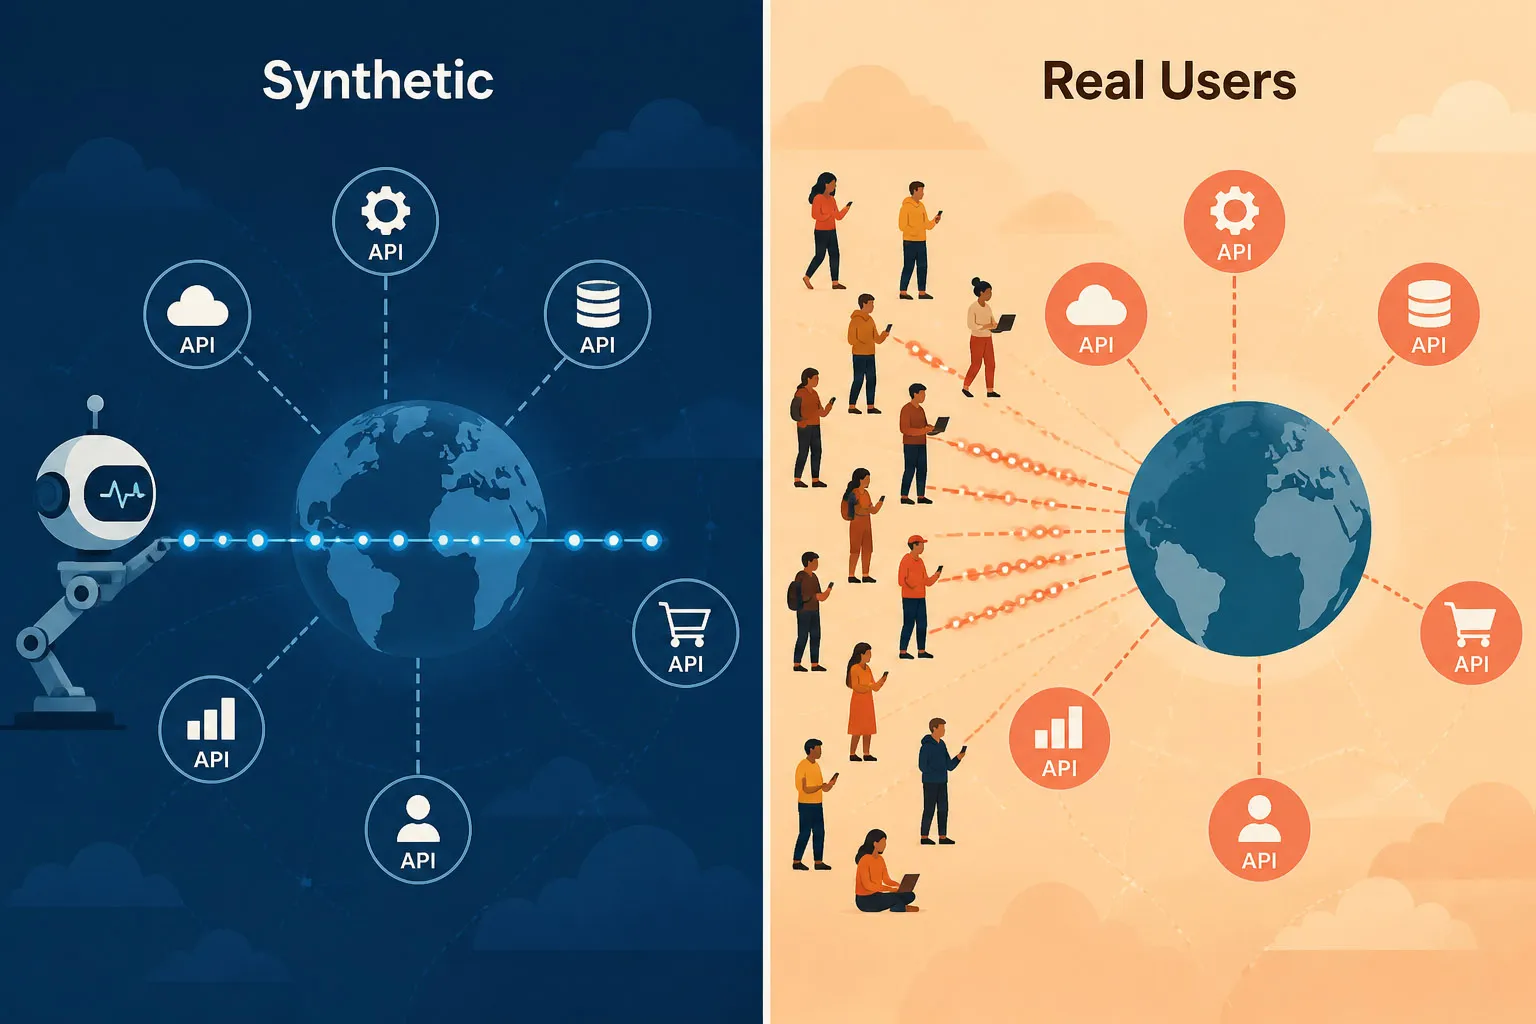
Both approaches provide API performance data, but from fundamentally different vantage points:
| Synthetic Monitoring | Real User Monitoring (RUM) | |
|---|---|---|
| Trigger | Scripted checks on a schedule (e.g., every 1 minute) | Actual user requests in production |
| Coverage | Runs 24/7 — including when zero real users are active | Only generates data when users are actively making requests |
| Detection | Proactive — catches failures before any user is impacted | Reactive — surfaces issues after users are already affected |
| Scope | Public and private/internal APIs (via Private Agent) | APIs reached by real users/clients — primarily public-facing, though enterprise RUM can also capture internal API calls from instrumented apps |
| Use case | Continuous availability and performance validation | Understanding true blast radius and real user experience |
Key API Monitoring Metrics
Tracking the right metrics is the difference between informed incident response and alert fatigue. Below are the metrics that matter most — with accurate benchmarks and what each one tells you.
| Metric | Target / Benchmark | What It Catches |
|---|---|---|
| Availability (Uptime %) | ≥ 99.9% (three nines); 99.99% for revenue-critical APIs | Total outage, partial outage, timeout |
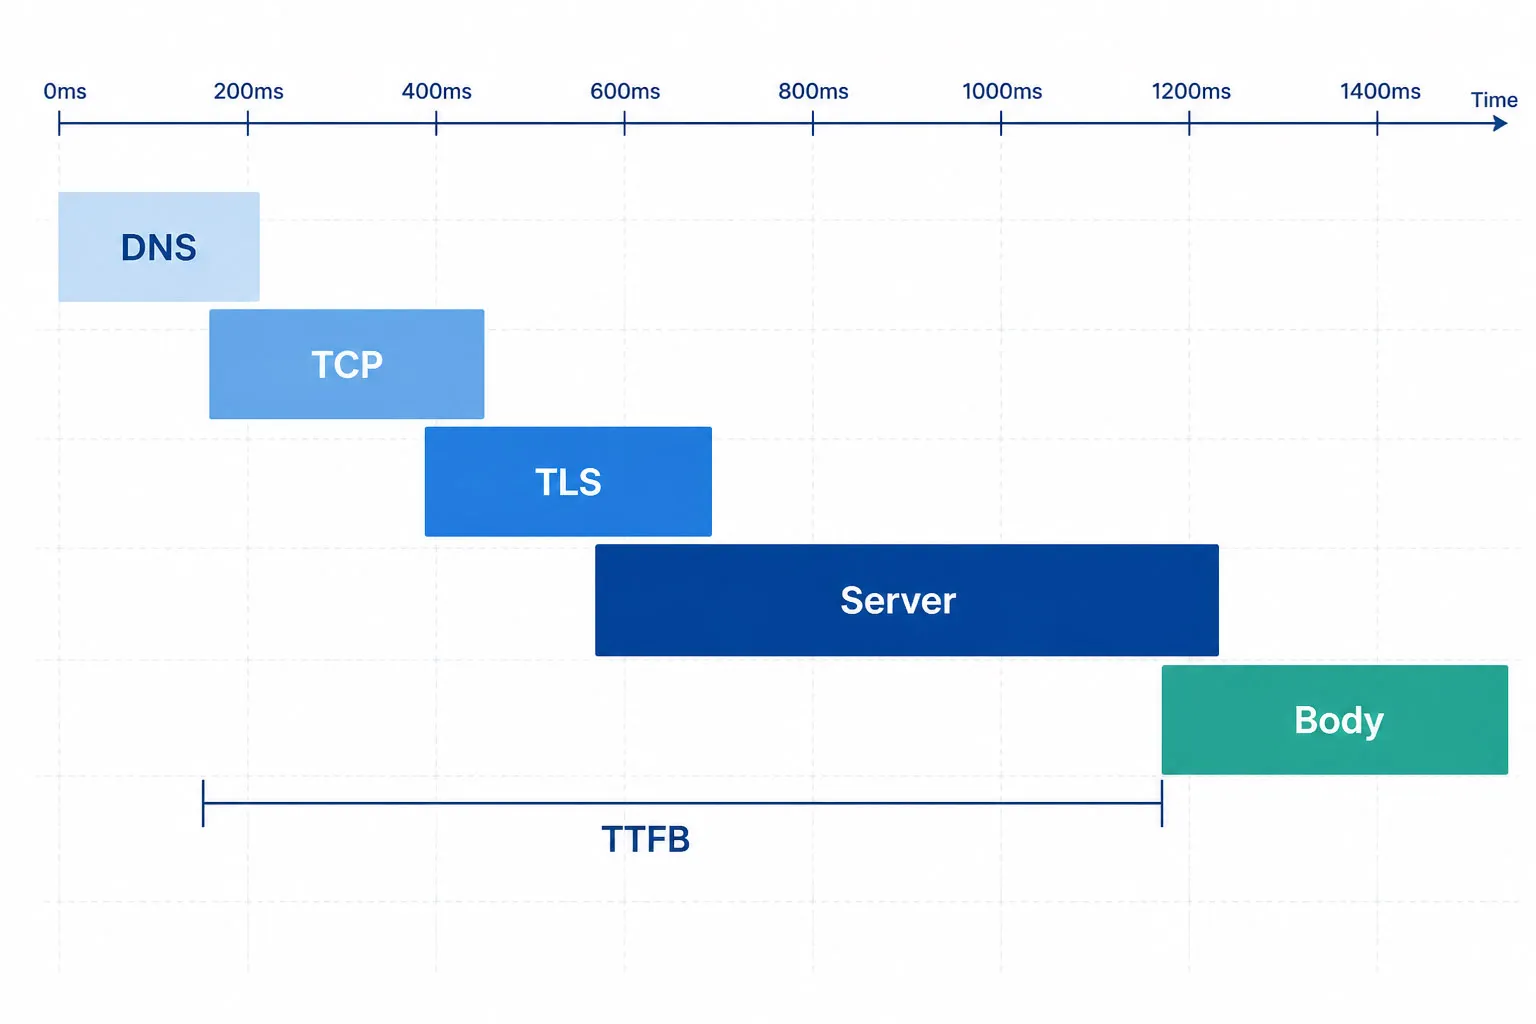
| Total Response Time | < 200ms for simple endpoints; < 1s for complex operations | Server slowdowns, overload, deployment regressions |
| Time to First Byte (TTFB) | < 100ms ideal; < 300ms acceptable | Server processing delay before response begins |
| P95 / P99 Response Time | Alert at 2× your baseline P95 per endpoint; tune to endpoint behavior | Tail latency affecting the slowest 1–5% of requests |
| Error Rate (4xx / 5xx) | < 0.1% for production APIs | Auth failures, bad input handling, server errors |
| DNS Resolution Time | < 50ms for same-region cached lookups; cross-region can exceed 100ms | DNS propagation issues, resolver failures |
| TLS Handshake Time | < 100ms | Certificate misconfiguration, TLS version negotiation issues |
| Payload Assertion Pass Rate | 100% (alert on any failure) | Silent failures: HTTP 200 responses with wrong or missing data |
| Throughput (req/sec) | Compare against historical baseline | Unexpected traffic drops or abnormal spikes |
| Certificate Expiry (days remaining) | Alert at 30 days; critical at 7 days | Impending TLS certificate expiry |
Response Time Benchmarks
How Does API Monitoring Work?
Understanding the technical mechanics helps teams configure monitoring correctly and interpret results accurately.
The Core Monitoring Loop
- Schedule. A synthetic check runs at a configured interval (e.g., every 1 minute) from a selected global monitoring location.
- Send request. The monitoring agent sends an HTTP request to the target endpoint — including the HTTP method (GET, POST, PUT, PATCH, DELETE), request headers, authentication credentials, and request body.
- Measure timing. The agent records DNS resolution time, TCP connection time, TLS handshake time, Time to First Byte (TTFB), and total response time as distinct components.
- Assert. The response is evaluated against configured assertions — HTTP status code, response time threshold, response headers, and payload content via JSONPath (REST) or XPath (SOAP).
- Alert or pass. If any assertion fails, or if the request times out, an incident is created and alerts are dispatched per configured notification rules.
- Record. All results — pass and fail — are stored with timestamps, response data, and assertion outcomes for historical trending and SLA reporting.
Multi-Step API Transaction Monitoring
Single-endpoint monitoring confirms that individual endpoints respond. But real user journeys are not single API calls — they are chained sequences where each step depends on the previous step’s output.
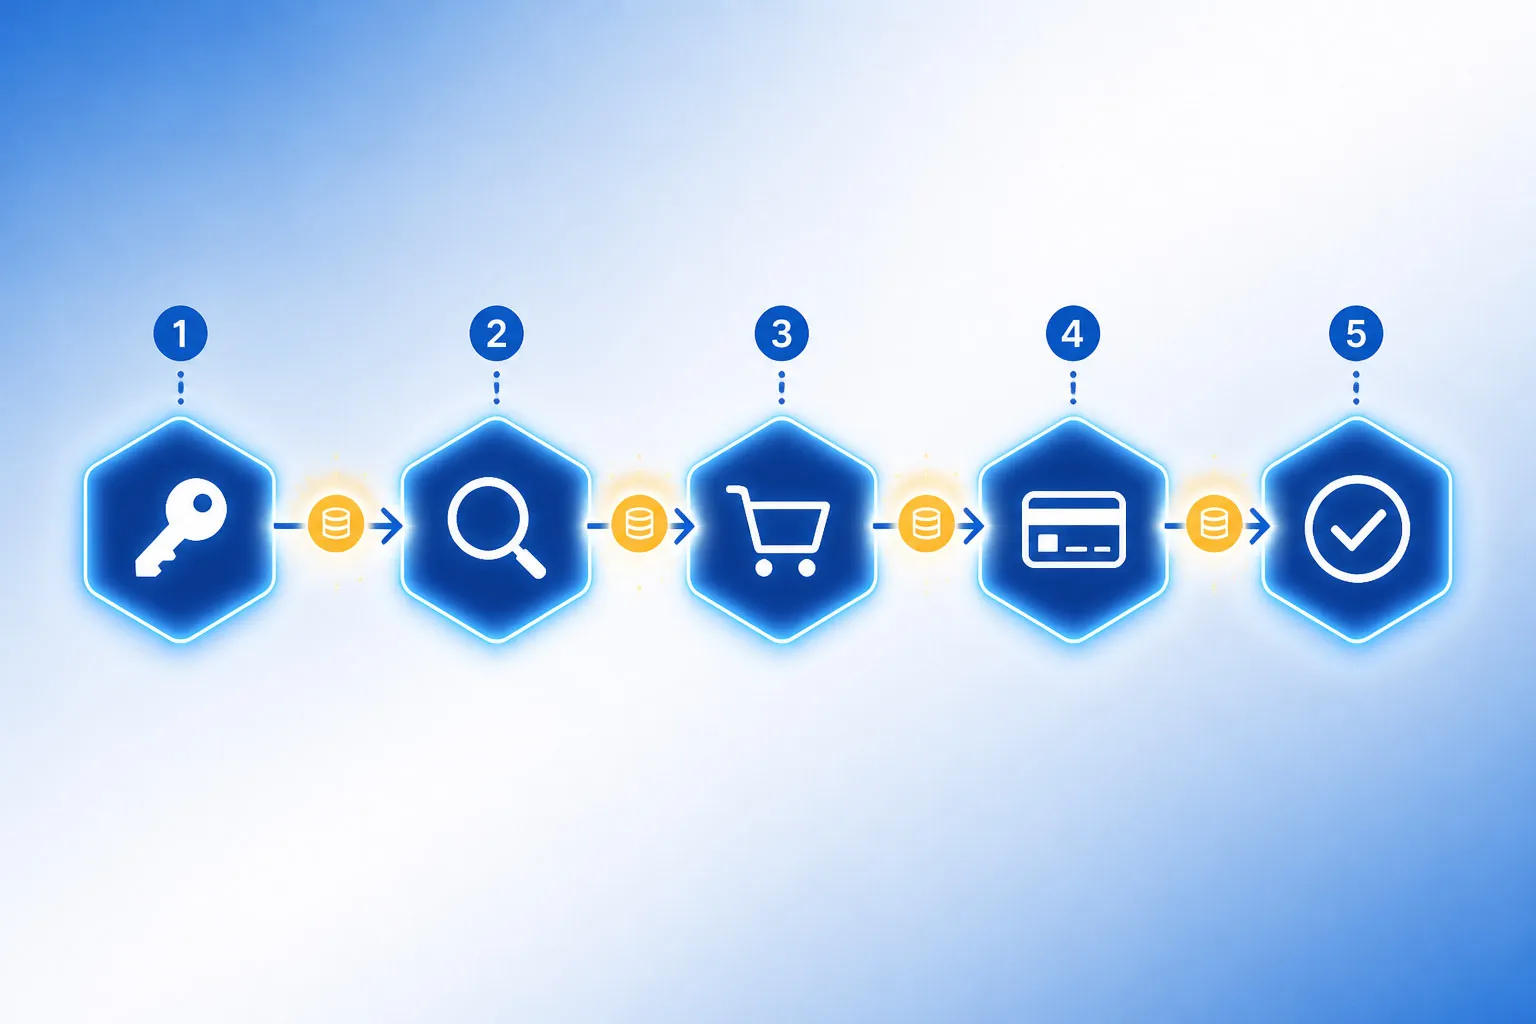
Consider an e-commerce checkout flow:
- Step 1 —
POST /auth/token: Authenticate user; extractaccess_tokenfrom response body - Step 2 —
GET /products/{id}: Fetch product details; inject token intoAuthorizationheader - Step 3 —
POST /cart/add: Add item; extractcart_idfrom response - Step 4 —
POST /checkout/initiate: Start checkout withcart_id; extractcheckout_session_id - Step 5 —
POST /payments/charge: Process payment; assert response fieldorder_statusequals'confirmed'
In single-endpoint monitoring, all five steps might pass individually while the full transaction fails — because session data isn’t passed correctly between steps, a token expires mid-flow, or the payment API returns HTTP 200 with an error field in the payload. Multi-step monitoring executes the entire chain as one monitor, validates each step independently, and passes dynamic values (tokens, session IDs, order IDs) between steps automatically.
Dotcom-Monitor enables multi-step transaction monitoring by chaining sequential API calls in a single monitoring task. Variable extraction and injection between steps is automatic. Each step is independently asserted, so failures are pinpointed to the exact step where the transaction broke.
Payload Validation: JSONPath and XPath Assertions
Payload validation is what separates monitoring from a simple availability ping. How assertions are expressed depends on the tool, but the logic is consistent:
- JSONPath field access (REST): Access
$.data.status— then assert the returned value equals'active' - JSONPath array check: Access
$.items— assert the array length is greater than 0 - XPath assertion (SOAP):
//order/status/text()— assert the node value equals'confirmed' - Header assertion: Assert
Content-Typeheader value equals'application/json' - Response time assertion: Assert total response time is below 500ms
Authentication Monitoring
Production APIs require authentication. A monitoring tool must handle the same auth methods as your real API clients. The schemes a production-ready monitoring platform should support:
| Auth Method | Description | Notes |
|---|---|---|
| OAuth 2.0 — Client Credentials | Machine-to-machine; client exchanges credentials for a token directly | Most common for server-to-server API monitoring |
| OAuth 2.0 — Authorization Code | User-delegated authorization; typically used with PKCE for SPAs/mobile apps | Requires monitoring tool to handle token refresh automatically |
| OAuth 2.0 — Resource Owner Password (ROPC) | Direct username + password exchange — legacy flow | Use only where Authorization Code is not feasible |
| Bearer Token (JWT) | Static or dynamically refreshed token in Authorization header |
Short-lived JWTs require automatic token refresh |
| API Key | Static key in header, query parameter, or cookie | Simplest to monitor; watch for rotation events |
| Basic Authentication | Base64-encoded username:password in Authorization header |
Legacy — still common in enterprise and internal APIs |
| AWS Signature v4 | HMAC-signed request using AWS credentials | Required for AWS API Gateway endpoints |
| mTLS / Client Certificate | Mutual TLS — both sides present certificates | Zero-trust environments; certificate expiry monitoring critical |
| NTLM / Kerberos | Windows/Active Directory integrated authentication | Enterprise internal APIs; less common in cloud-native stacks |
| Custom Headers | Proprietary auth schemes via custom request headers | Catch-all for non-standard auth implementations |
Token expiry is a leading cause of monitoring false positives. OAuth 2.0 access token lifetimes vary widely by implementation and grant type. User-delegated tokens (Authorization Code flow) typically range from 15 minutes to 1 hour. Machine-to-machine tokens (Client Credentials flow) are often configured for longer windows — 1 hour to 24 hours — to reduce refresh overhead. High-security environments may enforce lifetimes as short as 5 minutes. Regardless of the window, a monitoring tool that does not handle automatic token refresh will generate false positives or require manual credential rotation, creating both operational overhead and outage risk.
A note on the OAuth 2.0 Implicit grant: it is deprecated in current OAuth 2.0 security best practices (RFC 9700) and should not be used in new systems. If your existing APIs use the Implicit flow, migration to Authorization Code + PKCE is strongly recommended.
Why API Monitoring Matters: Business Impact
APIs are not infrastructure abstractions — they are revenue paths. When they fail, the consequences are financial, operational, and contractual.
The Cost of Undetected API Failures
Without proactive monitoring, teams rely on customer reports to detect failures. Industry surveys consistently place customer-reported MTTD well above 30 minutes — by the time a complaint is filed, investigated, triaged, and escalated, that window has already elapsed. Continuous synthetic monitoring at 1-minute check intervals shortens detection to under 60 seconds, enabling root cause isolation before the issue compounds.
The revenue formula is straightforward: orders/min × average order value × outage duration in minutes. A platform processing 100 orders/min at $50 average order value loses $25,000 in potential revenue during a 5-minute payment API outage. Plug in your own throughput and order value to size your exposure.
Industry-Specific Scenarios
- E-commerce. A checkout API failure during peak traffic halts all conversions. A payment authorization API returning HTTP 200 with a declined status — but no alert — silently blocks transactions for minutes before anyone notices.
- FinTech. Transaction processing APIs must meet sub-second latency requirements. Persistent degradation above SLA thresholds can trigger contractual penalties and audit findings under PCI DSS.
- Healthcare. EHR integration APIs and telemedicine endpoints must maintain HIPAA-compliant data exchange. An API returning HTTP 200 with incomplete patient data is a compliance event — not just a performance issue.
- SaaS / API-as-a-Product. When your API is a billable product, downtime triggers contractual SLA penalties and customer churn. Monitoring provides the documented uptime evidence needed for SLA adherence reporting.
- Enterprise IT. CRM, ERP, and HR API integrations across departments. A Salesforce API degradation can silently break sales workflows organization-wide without a single 500 error appearing in your logs.
Third-Party API Risk
Modern applications depend on external APIs they do not control: payment gateways (Stripe, PayPal, Braintree), identity providers (Okta, Auth0, AWS Cognito), shipping APIs, and CRM systems. When these degrade, your application appears broken to users even though your infrastructure is healthy.
Monitoring third-party endpoints lets teams immediately isolate whether a failure is internal or external — a distinction that can take significant investigation time to establish without prior monitoring data. It also provides documented evidence for holding vendors accountable to their published SLAs.
Stop finding out about API failures from your customers.
Dotcom-Monitor’s synthetic API monitoring detects failures in under 60 seconds and routes alerts directly to PagerDuty, Slack, or Microsoft Teams. Monitor payment gateways, identity providers, and internal APIs from one platform.
API Monitoring vs. API Testing
Both practices validate API behavior, but they serve different purposes in the software delivery lifecycle. Conflating them creates coverage gaps.
| Dimension | API Testing | API Monitoring |
|---|---|---|
| When | Pre-deployment — development, QA, CI/CD pipeline | Post-deployment — continuously in production |
| Environment | Development, staging, controlled test environment | Live production, real infrastructure, real traffic |
| Trigger | Code commit, build, manual run, PR gate | Scheduled (e.g., every 1 minute), 24/7 continuous |
| Goal | Prevent bugs from reaching production | Detect failures and degradation in production |
| Coverage | All behaviors, edge cases, error paths | Critical paths, SLA endpoints, user-journey chains |
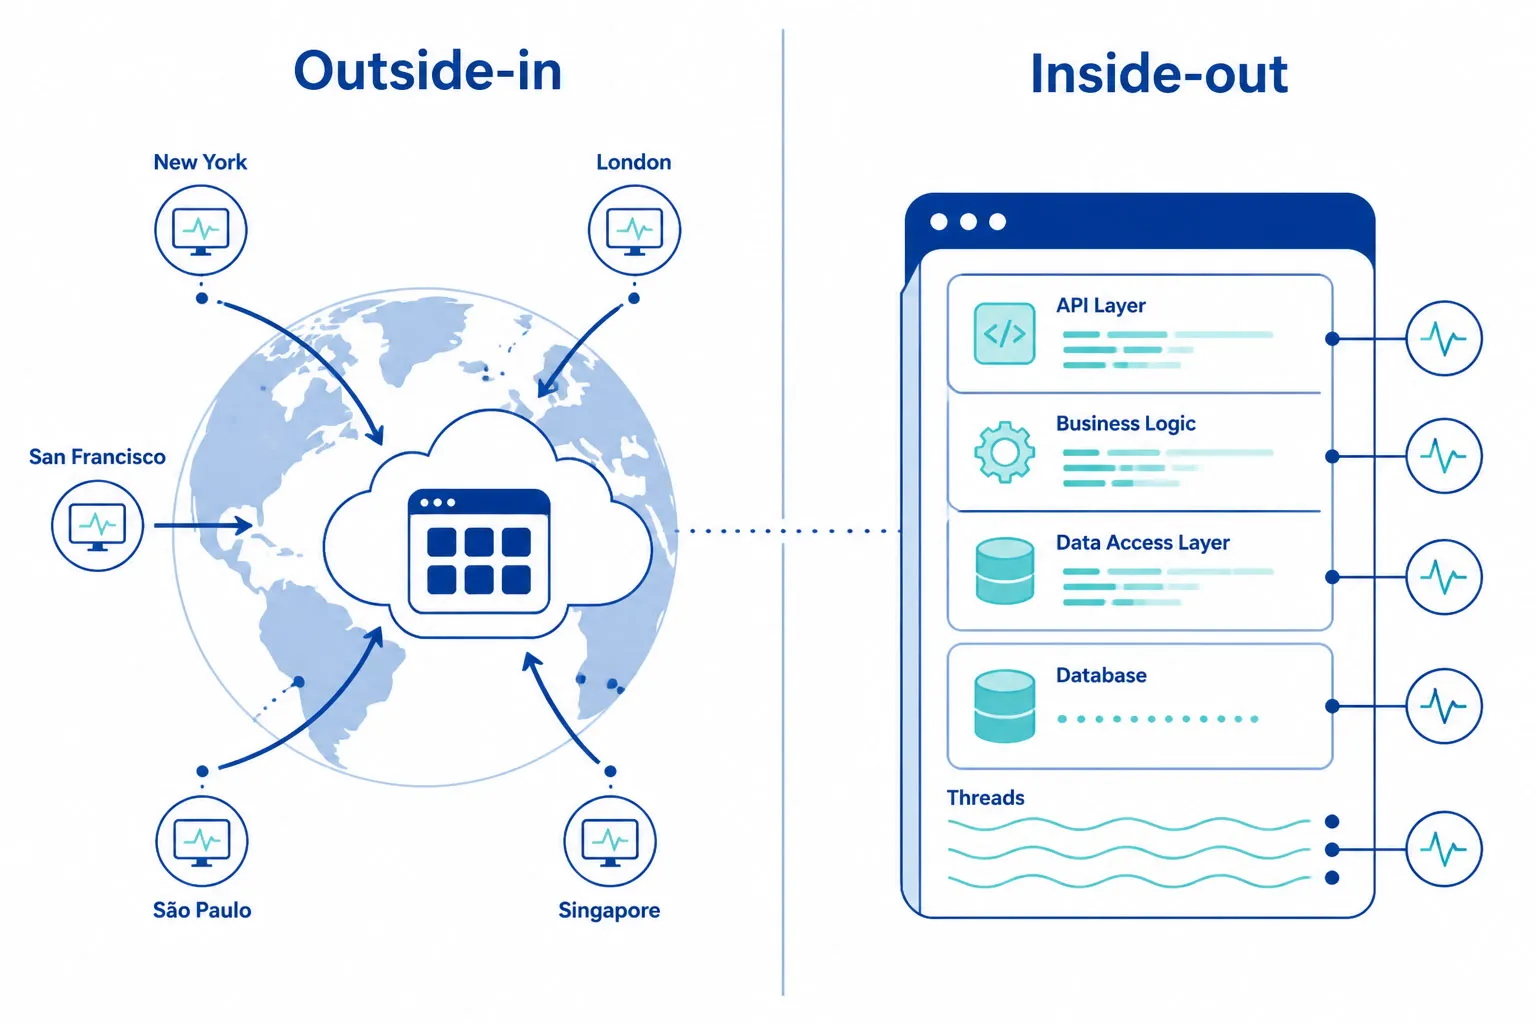
| Perspective | Inside-out: tests the code’s behavior | Outside-in: validates from the user’s vantage point |
| Output | Pass/fail report; blocks deployment on failure | Real-time alerts, uptime SLA records, incident history |
The practical relationship: API testing is a development-phase activity. API monitoring is an operational activity. Testing catches bugs before deployment; monitoring catches failures, regressions, performance degradation, and dependency issues after deployment — under real infrastructure conditions that differ from controlled test environments.
A mature engineering team runs both — and uses Postman Collection imports to bridge the two, converting development tests into production monitors without duplicating request definitions.
API Monitoring vs. APM
These two categories are frequently confused. They are complementary, not interchangeable.
| Synthetic API Monitoring | APM (Application Performance Monitoring) | |
|---|---|---|
| Perspective | Outside-in — validates from the same vantage point as users and partners | Inside-out — observes internal application behavior |
| What it sees | DNS failures, network routing issues, TLS errors, CDN misroutes, geographic gaps | Slow DB queries, memory leaks, code exceptions, slow function calls |
| When it runs | 24/7 — even during zero-traffic periods | Only when real requests are being processed |
| Question it answers | “Can our customers actually call this API right now?” | “What is happening inside our application when a request comes in?” |
Teams with the lowest MTTR use both: APM for internal root-cause analysis, synthetic API monitoring for external validation. Logs and traces answer “what went wrong in our code?” Synthetic monitoring answers “can our customers use this API right now?”
API Protocols: REST, SOAP, GraphQL, gRPC, and WebSocket
Each API protocol has distinct monitoring requirements and failure modes. A monitoring tool that treats all APIs as simple HTTP GET requests will miss protocol-specific issues.
REST API Monitoring
REST is the dominant API protocol. Monitoring validates HTTP methods (GET, POST, PUT, PATCH, DELETE), status codes, response headers, and JSON response bodies via JSONPath assertions. Key requirements: assert on response payload field values — not just status codes; monitor all HTTP methods, not just GET (POST, PUT, and DELETE trigger different server-side logic and failure modes); track response time per endpoint individually, not as aggregate averages across endpoints.
SOAP API Monitoring
SOAP APIs exchange XML over HTTP. Monitoring requirements: WSDL import for endpoint and schema definition; XPath assertions on XML response elements; SOAP 1.1 and SOAP 1.2 protocol support; WS-Security configuration for enterprise SOAP services using message-level security.
GraphQL API Monitoring
GraphQL’s key monitoring challenge: most GraphQL server implementations return HTTP 200 even for partial errors or malformed queries. The HTTP status code is not a reliable failure signal. You must:
- Send specific query payloads and assert on the response
dataobject - Check the
errorsarray in the response body — in standard GraphQL, every response has an optional top-levelerrorsfield that is empty or absent on success and populated on failure. A 200 response with a populatederrors[]means the request failed at the GraphQL layer even though HTTP succeeded - Validate query-specific data invariants: assert that expected fields are present, non-null, and correctly typed in the data object — some systems encode domain failures within the data object rather than populating the top-level errors array
- Monitor query complexity and depth limits to detect performance degradation before it causes timeouts
gRPC API Monitoring
gRPC uses Protocol Buffers over HTTP/2 by default, though gRPC-Web supports HTTP/1.1 via a proxy for browser clients. Monitoring requirements: proto file import for service and method definitions; binary encoding/decoding support for Protocol Buffer messages; status code validation using gRPC status codes (OK, UNAVAILABLE, DEADLINE_EXCEEDED, etc.) — not HTTP status codes; support for Unary, Server-Streaming, Client-Streaming, and Bidirectional-Streaming RPC types.
WebSocket API Monitoring
WebSocket APIs maintain persistent bidirectional connections for real-time data. Monitoring validates connection establishment time and WebSocket handshake success, message delivery latency and payload correctness, and connection stability over time including reconnection behavior after drops.
Public API Monitoring vs. Internal API Monitoring
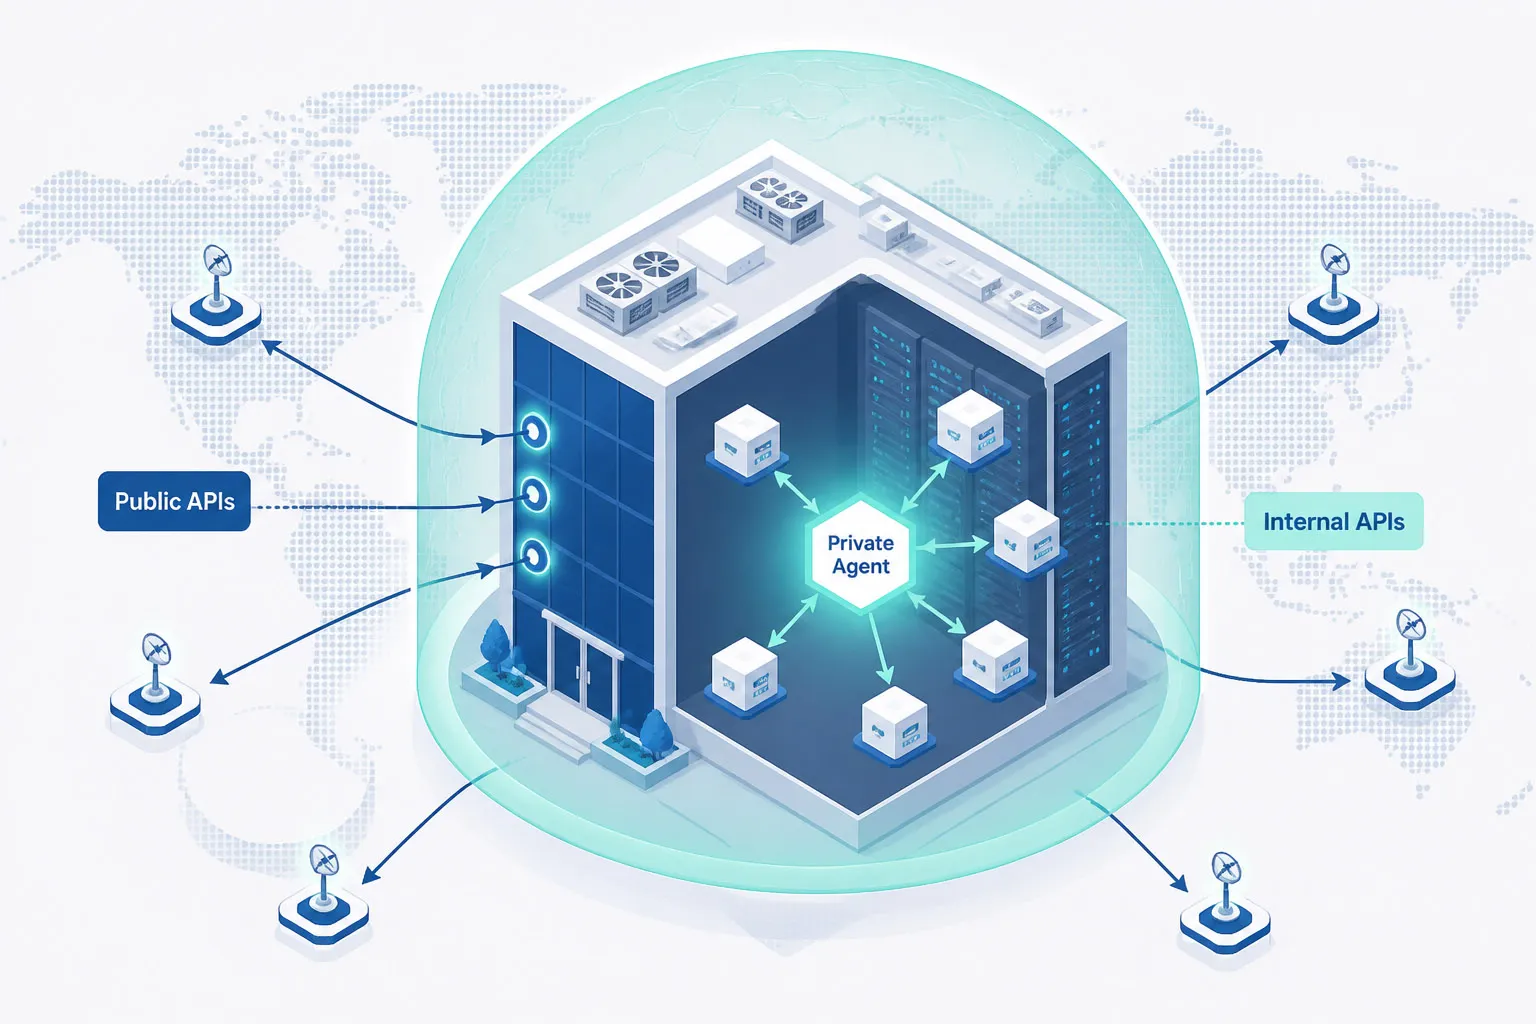
Most API monitoring guides focus exclusively on public-facing endpoints. But in microservices architectures, the majority of critical API calls are internal — service-to-service calls that never reach the public internet.
| Public API Monitoring | Internal API Monitoring | |
|---|---|---|
| What it covers | Customer-facing endpoints, partner APIs, third-party integrations | Internal microservices, private VPCs, staging environments, behind-firewall APIs |
| How it works | External monitoring agents run checks from global locations over the public internet | A Private Agent deployed inside your network initiates outbound connections to the monitoring platform |
| Firewall requirements | None — checks originate externally | No inbound rules required — agent initiates outbound connections only |
| What it catches | DNS resolution failures, CDN routing issues, TLS errors, geographic availability gaps | Inter-service failures, authentication microservice latency, database-query API degradation |
| Deployment | No installation — works immediately | Agent installed on-premises or in private cloud (Windows and Linux supported) |
Internal microservice APIs are the most common source of cascading failures. A degraded authentication service or a slow data-access API causes downstream issues that surface as frontend failures — making the root cause difficult to locate without internal visibility. Monitoring internal APIs lets teams isolate whether the failure is in the API layer, the downstream microservice, or the database. Learn more about Private Agent monitoring behind your firewall.
API Monitoring Best Practices
These practices reduce mean time to detection (MTTD), improve alert precision, and ensure monitoring coverage matches production risk.
- Monitor at 1-minute intervals for revenue-critical endpoints. For payment, authentication, and core data APIs, every undetected minute has direct business impact. 5- or 15-minute intervals are acceptable for lower-criticality endpoints.
- Run checks from at least 5 geographically distributed locations. A single monitoring location cannot detect regional DNS failures, CDN misconfigurations, or geo-specific routing issues. At minimum, cover North America, Europe, and Asia-Pacific.
- Validate payload content, not just status codes. Configure JSONPath assertions for every critical endpoint. The most expensive silent failures are APIs returning HTTP 200 with incomplete, stale, or malformed data.
- Use baseline-derived alert thresholds, not static millisecond values. Establish a response time baseline per endpoint and configure alerts at 2× the P95 value. Static thresholds generate false positives during normal traffic peaks.
- Include authentication in your monitoring chains. Token expiration, OAuth refresh failures, and certificate rotation are leading causes of API outages. Monitoring auth steps catches credential-related failures before they cascade.
- Build multi-step transaction monitors for every critical user journey. Login flows, checkout sequences, and data submission workflows are chained API calls. Single-endpoint monitors cannot catch inter-step failures caused by incorrect data passing or session handling.
- Monitor third-party API dependencies as separate monitors. Create dedicated monitors for Stripe, Okta, Salesforce, and other external dependencies. This immediately answers whether a failure is internal or external.
- Import Postman or Insomnia collections to bootstrap monitoring. Convert existing API definitions into 24/7 production monitors without re-creating request structures. This eliminates the gap between development-time testing and production monitoring.
- Integrate post-deployment API checks into CI/CD pipelines. Run synthetic API checks as automated smoke tests after every deployment. If post-deploy checks fail, consider triggering an automated rollback or traffic hold in progressive delivery setups (blue/green or canary) — using confirmation runs from a second location to reduce false positives before taking any automated action.
- Route alerts to PagerDuty, Slack, or Microsoft Teams with escalation policies. Email-only alerting creates detection lag. Native integrations with incident management tools ensure alerts reach the right person immediately, with defined escalation paths for non-response.
Challenges of API Monitoring
Even well-designed monitoring setups face operational challenges. Anticipating these helps teams design around them.
Third-Party API Visibility
Monitoring external dependencies gives you availability and latency data but cannot expose the internal cause of a degradation. When Stripe or Okta slows down, you can confirm it and isolate the blast radius — but root cause analysis depends on vendor status pages and support escalation paths.
Rate Limiting
Monitoring agents count toward your API’s rate limits. The total synthetic request volume scales as: locations × checks per hour × API calls per monitor run × confirmation retries. For a single-endpoint monitor: 30 locations × 60 checks/hour = 1,800 requests/hour. For a 5-step transaction monitor at the same settings: 30 × 60 × 5 = 9,000 requests/hour per monitor. Factor this into rate limit budgeting, especially for internal APIs with tighter thresholds. Ensure your monitoring provider’s IP ranges are whitelisted where required.
Authentication Complexity
APIs using short-lived tokens require monitoring tools that handle token refresh automatically. User-delegated OAuth 2.0 tokens (Authorization Code flow) typically expire in 15 minutes to 1 hour; machine-to-machine Client Credentials tokens often last 1–24 hours; high-security environments may enforce 5-minute windows. Certificate-based auth and rotating API keys also require careful credential management.
Dynamic and Non-Deterministic Responses
APIs returning timestamped data, paginated results, or randomly-ordered arrays are difficult to assert against with exact-value matching. Use JSONPath expressions that validate structure, field presence, and field types — rather than exact field values that change on every request.
Alert Fatigue
Over-monitoring — too many endpoints at 1-minute intervals, or thresholds set too tightly — generates noise that desensitizes teams to real alerts. Use tiered monitoring: 1-minute for critical paths, 5–15 minutes for non-critical endpoints. Confirm alerts from a secondary location before paging to eliminate transient false positives.
Protocol Diversity
REST, SOAP, GraphQL, gRPC, and WebSocket each require different assertion strategies. A tool that only handles REST will miss SOAP service failures and will incorrectly report GraphQL errors as successful because they return HTTP 200.
How to Set Up API Monitoring with Dotcom-Monitor
Dotcom-Monitor provides synthetic API monitoring for REST, SOAP, and GraphQL from 30+ global locations, with 1-minute check intervals, multi-step transaction support, and native integrations with PagerDuty, Slack, and Microsoft Teams.
Step 1 — Define Your Endpoint and Assertions
- Endpoint URL: The API endpoint to monitor
- HTTP Method: GET, POST, PUT, PATCH, or DELETE
- Request headers:
Content-Type,Authorization, and any required custom headers - Request body: JSON payload for POST/PUT requests
- Authentication: OAuth 2.0, Bearer Token, API Key, Basic Auth, mTLS, AWS Signature v4, NTLM, Kerberos, or custom headers
- Assertions: HTTP status code, response time threshold, header values, JSONPath/XPath payload assertions
Step 2 — Import from Postman or Insomnia
If your team uses Postman or Insomnia, skip manual endpoint configuration entirely:
- Postman: Export your Collection as v2.0 or v2.1 JSON and import into Dotcom-Monitor. Request definitions, headers, body, environment variables, and test assertions are preserved.
- Insomnia: Export your workspace as an Insomnia v4 JSON file and import into Dotcom-Monitor. Request groups, auth configs, and environment variables are retained.
Both import formats convert one-time development tests into continuously scheduled 24/7 production monitors with no re-configuration.
Already using Postman? You’re 5 minutes away from 24/7 production monitoring.
Import your existing Postman Collection directly into Dotcom-Monitor. Your request definitions, headers, environment variables, and assertions are preserved — no re-configuration needed.
Step 3 — Configure Monitoring Locations and Frequency
- Check frequency: 1-, 3-, 5-, or 15-minute intervals — set per endpoint based on criticality
- Monitoring locations: Select from 30+ locations across North America, Europe, Asia-Pacific, and South America
- Private Agent: For internal or behind-firewall APIs — deploy the agent on-premises or in your private cloud (Windows and Linux supported). Agent initiates outbound connections only — no inbound firewall rules needed.
- Confirmation retries: Configure a secondary-location confirmation check before triggering alerts, to eliminate transient network false positives
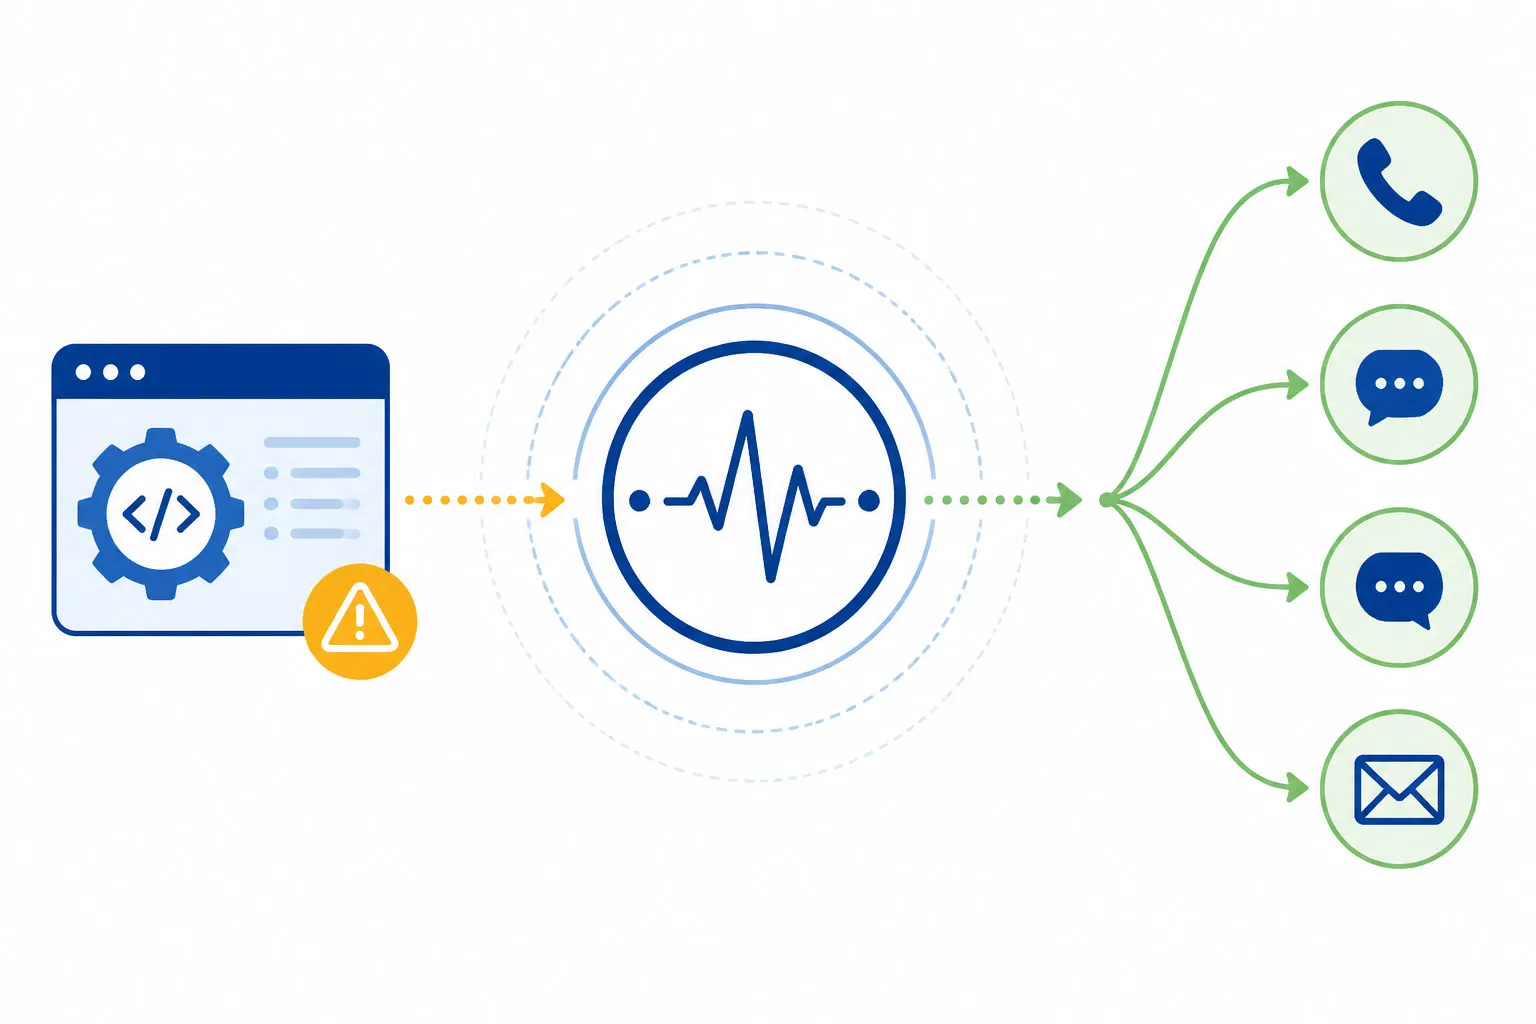
Step 4 — Configure Alert Routing
- PagerDuty: Route critical alerts directly to on-call schedules with automatic incident creation and escalation
- Slack / Microsoft Teams: Post alert messages with endpoint details, error type, and response data to ops channels
- Email, SMS, Phone call: Configure per-contact or per-team notification preferences
- Webhook: Integrate with OpsGenie, ServiceNow, or any HTTP-compatible service
- Threshold configuration: Set alert conditions per metric — response time, error rate, assertion failure rate — with severity levels
Step 5 — CI/CD Pipeline Integration
- Dotcom-Monitor REST API: Programmatically create, update, and trigger monitoring tasks via HTTP API calls from any CI/CD system
- GitHub Actions / Azure DevOps / Jenkins: Add a post-deploy step that triggers a Dotcom-Monitor check run, waits for results, and fails the pipeline if any assertions fail
- Pre-production validation: Run the same synthetic checks against your staging environment before promoting builds to production — catch regressions before any user is affected
API Monitoring Use Cases by Industry
| Industry | Critical APIs to Monitor | Key Monitoring Requirements |
|---|---|---|
| E-commerce | Checkout, payment authorization, inventory, shipping, cart management | Multi-step transaction chains; 1-minute intervals; payload assertion on payment confirmation status |
| FinTech / Banking | Transaction processing, KYC/AML verification, account balance, FX rates, wire transfer APIs | Sub-200ms latency SLAs; compliance-related checks supporting PCI DSS evidence; full auth flow validation |
| Healthcare | EHR integrations (HL7 FHIR), insurance portals, telemedicine endpoints, patient scheduling | Compliance-related checks supporting HIPAA evidence; payload validation for data completeness; 99.99% uptime SLA |
| SaaS | Core product APIs, webhook delivery endpoints, partner integration APIs, authentication APIs | API-as-a-Product SLA adherence; Postman import for dev-to-monitor consistency; third-party dependency monitoring |
| Enterprise IT | CRM, ERP, HRIS, identity provider, internal workflow automation APIs | Private Agent for behind-firewall APIs; NTLM/Kerberos auth support; cross-department API visibility |
| Media / Gaming | CDN content delivery APIs, authentication, real-time scoring, social feature APIs | Geographic distribution monitoring; WebSocket connection monitoring; traffic spike detection |
Start monitoring your APIs today.
Dotcom-Monitor provides synthetic API monitoring from 30+ global locations, with 1-minute check intervals, multi-step transaction support, and native PagerDuty, Slack, and Microsoft Teams integrations. Setup takes under 5 minutes. No credit card required for the 30-day trial.
