
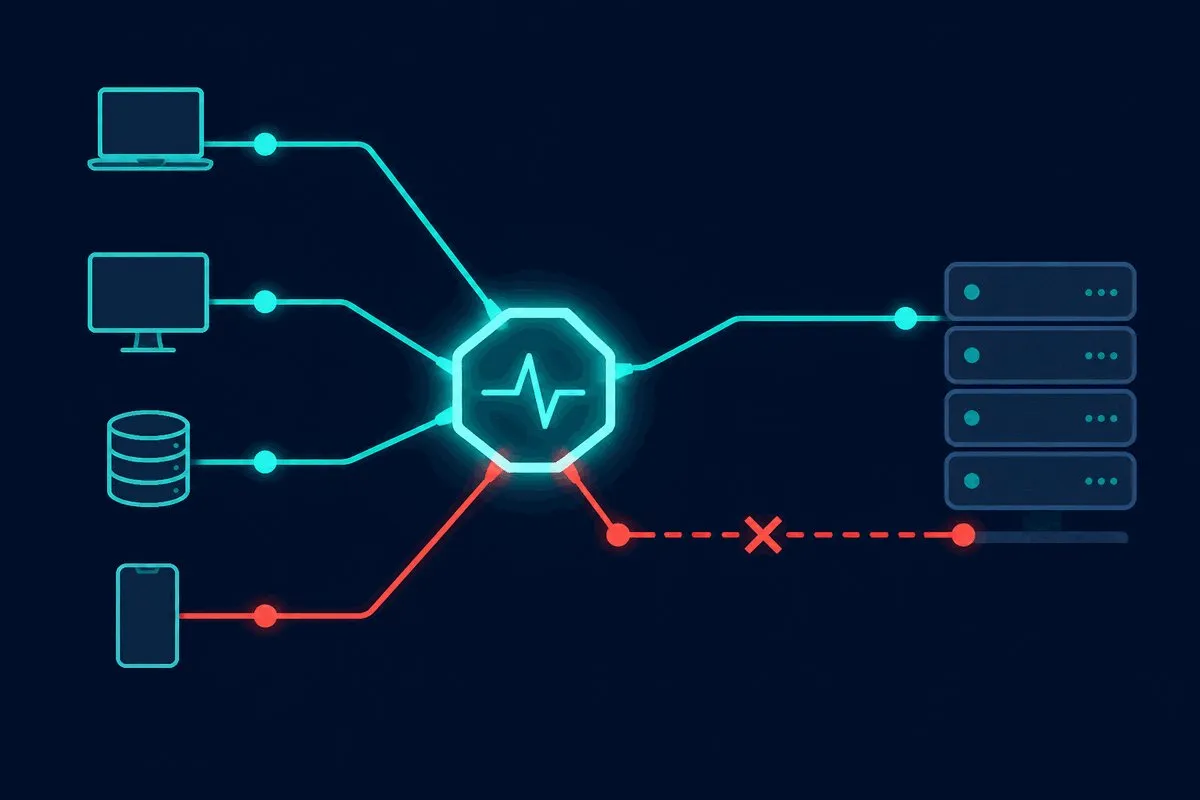
Most sites now run dual-stack. The same server, API, or checkout page answers over both IPv4 and IPv6 at the same time. That setup keeps you reachable as IPv4 addresses get scarce, but it also splits your traffic across two networks that fail independently.
Here is the problem that creates. If your monitoring only tests over IPv4, it reports green while native IPv6 users hit a dead gateway, a missing DNS record, or a firewall rule that was never updated. The dashboard says 100% uptime. A growing slice of your audience says the site is broken.
This article walks through how Dotcom-Monitor tests the IPv6 path on its own terms: native IPv6-only nodes with no tunneling, browser scripts that load every third-party asset over IPv6, and protocol checks that isolate an IPv6 fault while the IPv4 path stays clean.
What Is IPv6 Monitoring?
IPv6 monitoring is the practice of testing whether your website, API, and services respond correctly over IPv6, from the point of view of a real IPv6 user. It runs the same availability and performance checks you already use over IPv4—DNS resolution, page loads, transactions, and protocol responses—but over the IPv6 path, which has its own DNS records, routes, and firewall rules.
On a dual-stack site that serves both protocols, IPv6 monitoring is the only way to confirm the IPv6 half works. An IPv4 check passes whether or not IPv6 is healthy, so without a dedicated IPv6 network monitoring test, an outage that hits only IPv6 users stays invisible. The sections below show how Dotcom-Monitor runs that test from native IPv6-only nodes, covering uptime, transactions, DNS, and protocol checks on both planes.
Why Dual-Stack Networks Create a Monitoring Blind Spot
A dual-stack service answers on two protocols, but IPv4 and IPv6 do not share a path. They are two routing planes. Traffic resolves through different DNS records, crosses different firewall rules, and travels through different transit providers before it reaches the same origin.
So a request can succeed over one plane and fail over the other. The IPv4 client resolves your A record, clears an IPv4 firewall that your team has tuned for years, and loads the page. The IPv6 client resolves your AAAA record, hits a gateway that was never fully configured, and times out. Both users typed the same URL. One of them thinks your site is down.
The two planes differ under the hood as well. IPv6 uses a fixed 40-byte base header, an 8-bit Traffic Class field, and a 20-bit Flow Label, so transit routers handle IPv6 packets differently than the best-effort IPv4 model they have carried for decades. And a single IPv6 subnet holds far more addresses than the entire legacy IPv4 internet, which changes how routes propagate and how filters get applied. The point for monitoring is simple: an IPv4 result tells you nothing reliable about the IPv6 path. You have to test each one where it lives.
How Dotcom-Monitor Runs Native IPv6-Only Monitoring
Dotcom-Monitor runs its checks from a global monitoring network of nodes on real IPv4 and IPv6 backbones. Some of those nodes are dual-stack and can reach a target over either protocol. Others are IPv6-only.
The IPv6-only locations are the part that matters here, because of what they refuse to do. Much of the networking equipment that speaks IPv6 can also translate traffic back to IPv4 through transition mechanisms like 6to4 tunneling or NAT64. That translation is convenient in production and misleading in a test. A dual-stack agent can report a clean result while quietly falling back to IPv4, which hides the exact failure you are trying to find.
An IPv6-only node uses no translation. It sends and receives nothing but IPv6. When a check passes from that node, the target genuinely answered over native IPv6. When it fails, you have caught a real IPv6 fault instead of a fallback covering for one.
Running the same check from a native IPv4 node and a native IPv6-only node gives you a clean before-and-after for each plane. Any gap between the two results is an IPv6-specific problem, not measurement noise.
That split baseline runs across the platform’s device types. Web Applications monitoring drives a real browser through a scripted transaction. Web Pages monitoring loads a single page the same way. Internet Infrastructure monitoring runs protocol checks against your servers. And Web Services monitoring validates your APIs. Every one can be pinned to IPv6-only locations, and the two browser devices record with the EveryStep scripting tool, so you capture a path once and replay it from any node.
Catching Third-Party AAAA Ghosts With Real-Browser Monitoring
Your origin can support IPv6 perfectly and your pages can still break for IPv6 users. The reason is everything you do not host. A modern page pulls in a CDN, web fonts, an analytics tag, a chat widget, and a payment processor. When an IPv6-only user loads that page, the browser tries to fetch every one of those assets over IPv6 too.
If a third party never published an AAAA record or drops IPv6 packets, the browser hangs on that asset. It waits for the connection to time out, and it can stall the rest of the render while it waits. The visible result is a half-drawn page: missing navigation, blank asset frames, a checkout button that never wires up. Your internal health dashboard stays green the entire time, because your origin is fine. The break lives in someone else’s network.

Web Applications monitoring catches this by loading the full page in a real browser from an IPv6-only node and recording every request in the waterfall. For a single page rather than a full transaction, Web Pages monitoring works the same way. Instead of one pass/fail, you see which specific asset resolved, which one timed out, and where the render stalled. The table below shows the pattern it surfaces.
| Testing profile | Core HTML | CDN and media assets | Third-party scripts | What the user sees |
|---|---|---|---|---|
| IPv4 monitoring | Resolves (A record) | Resolves | Resolves | Full page renders normally. |
| IPv6-only monitoring | Resolves (AAAA record) | Fails to resolve | Times out | Partial load: broken layout, empty frames, stalled checkout. |
Take a checkout flow as an example. A Web Applications script logs in, adds an item, and reaches the payment step. Over IPv4 the whole path passes. From the IPv6-only node, the payment processor’s script has no AAAA record, so the browser stalls before the form is usable. The script fails at that step and tells you which asset caused it. An uptime ping on your own domain would never have flagged the checkout at all. Scripting the transaction with synthetic monitoring is what turns “the site is up” into “customers can actually pay.”
How Internet Infrastructure Monitoring Isolates IPv6 Protocol Failures
Browser checks catch what users see. You also need the layer underneath. Internet Infrastructure monitoring runs protocol-level checks against your servers, as often as once per minute, and it runs them from IPv6-only locations the same way the browser devices do.
That frequency and that isolation are the useful part. If your HTTP/S or DNS endpoint answers over IPv4 but fails over IPv6, Internet Infrastructure monitoring reports the IPv6 protocol error on its own rather than averaging it away against the healthy IPv4 result. Web Services monitoring does the same for your API endpoints. You get an alert that names the protocol and the path, not a vague “response time is up.”
DNS is worth a dedicated check. A dual-stack site needs both an A record and an AAAA record resolving globally at matching speed, and a stale or missing AAAA record is one of the most common IPv6 faults. DNS monitoring confirms both records answer everywhere, and keeps an eye on TTL values so a routing change during a migration does not leave IPv6 users pinned to a dead entry. When an alert fires, an automatic IPv6 traceroute shows whether the drop is on your origin or inside an upstream transit provider’s routing table.
How Dotcom-Monitor Exposes Happy Eyeballs Latency
Some IPv6 problems never show up as an outage. They show up as a site that feels slow for reasons nobody can pin down. The cause is often Happy Eyeballs.
Happy Eyeballs (RFC 8305) is a browser fallback. The browser starts its IPv6 connection first, then waits a short interval (the connection attempt delay, roughly 250 milliseconds by default) before it also races IPv4. If the IPv6 path is broken or slow, the IPv4 attempt wins and carries the request. The connection still succeeds, so the user rarely sees an error.
That is good for the user and bad for your visibility. The wait before the browser gives up on IPv6 and leans on IPv4 gets added to real Time to First Byte and Largest Contentful Paint. Every IPv6 user pays a latency tax on a connection that eventually works over IPv4. Passive tools and real-user analytics record a successful load and move on, so the structural fault stays invisible while the experience quietly degrades.
Native IPv6-only monitoring measures the tax directly, because the fallback is not available to hide behind. The IPv6 path either performs or it does not, and the number lands in the report. Side-by-side waterfall reports put the IPv4 and IPv6 timings next to each other, so a 250-millisecond gap that users feel but cannot describe becomes a line you can point at. If you want a refresher on reading those charts, see our guide to waterfall charts.
How to Set Up Dual-Stack Monitoring in Dotcom-Monitor
Here is the setup that gives you both planes without doubling your maintenance work.
- Step 1: Build the check once in EveryStep. Record your critical path or protocol check a single time. The same EveryStep script runs across every location, so you are not maintaining separate IPv4 and IPv6 versions.
- Step 2: Assign native IPv4 and IPv6-only locations. Add the check to both a native IPv4 node and an IPv6-only node. Skip 6to4 and NAT64 locations for the IPv6 baseline so no translation sits between the node and your target.
- Step 3: Set the check frequency. Run Internet Infrastructure protocol checks as often as once per minute. Schedule Web Applications browser checks on the interval your SLA calls for.
- Step 4: Add DNS checks for A and AAAA records. Confirm both records resolve globally at matching speed, and watch TTL values so a migration does not strand IPv6 users on a stale route.
- Step 5: Trigger an IPv6 traceroute on deviation. Set alerts to fire a traceroute the moment availability or response time slips, so you can separate an origin fault from an upstream transit fault right away.
- Step 6: Compare the two waterfalls. Review the IPv4 and IPv6 reports side by side. Any asset, hop, or protocol that differs between them is your IPv6-specific issue.
The Bottom Line
Dual-stack means every request has two ways to reach you and two ways to break. IPv4-only monitoring watches one of them and reports on both, which is how a site earns a perfect uptime record while IPv6 users get timeouts, half-loaded pages, and a latency penalty nobody can trace.
Dotcom-Monitor closes that gap by testing the IPv6 path on its own terms. Native IPv6-only nodes with no tunneling, Web Applications browser scripts that load every third-party asset over IPv6, Internet Infrastructure protocol checks down to once a minute, and side-by-side waterfalls that separate an origin fault from an upstream one. You stop guessing about the half of your traffic that IPv4 checks never touched.
Test Your IPv6 Path Before Your Users Do
Deploy native IPv6-only monitoring nodes and see exactly what your dual-stack users experience, down to the third-party asset. Start a 30-day free trial with Dotcom-Monitor.
