What Is API Monitoring? An Expert Guide
API monitoring is one of the most crucial parts of the software development process. By actively monitoring APIs, developers and business can easily detect and troubleshoot issues as soon as they arise.
Introduction to API Monitoring
APIs, or Application Programming Interfaces, play a vital role in facilitating seamless communication and data exchanges between software systems. APIs have become much more prevalent in the recent years, which means monitoring how these systems perform has become more important than ever.
This article will provide all of the details necessary to ensure the optimal functionality of an API and why proper API monitoring is essential for a healthy software system.
What is API Monitoring?
API monitoring is the practice of continuously observing and analyzing the performance and behavior of an API. The API itself is merely a set of rules and protocols that allow different software applications to communicate with each other effectively.
API monitoring involves analyzing several different aspects of the system, including availability, response time, error rates, and overall performance. This helps to ensure that the API is functioning properly and meeting service level agreements.
Why Is API Monitoring Important?
API monitoring is important for several different reasons. Performance optimization is one of the most important roles that API monitoring plays in the development process. Monitoring APIs allows developers to track performance and identify issues more easily.
Availability and reliability of an API can then be assessed by detecting downtime and minimalizing service outages. General error detection and troubleshooting can also be done using API monitoring tools.
This will help to identify any unexpected behavior so that it can be remedied before it affects the end user. API monitoring is also important for security and compliance reasons, as it makes it easier to detect threats and ensure compliance with relevant standards for data protection.
One of the most commonly overlooked benefits of API monitoring is how it can be used during capacity planning. Monitoring usage patterns and traffic volumes over time can help plan more efficiently for capacity requirements and scalability.
Finally, SLA compliance can be measured using API monitoring to ensure that all contractual obligations of service are being met and any deviations promptly addressed.
Key Components of Effective API Monitoring Systems
The following is a checklist of all of the key factors to lookout for in an effective API monitoring system.
- Monitoring Tools: Software platforms designed for API monitoring, including New Relic, Datadog, and Pingdom.
- Endpoint Monitoring: Checks API endpoints for accessibility, and correct responses, and measures response time.
- Error Detection and Handling: Identifies and manages errors during API interactions, triggering appropriate actions.
- Performance Metrics: Collects data on response time, throughput, error rate, and latency for troubleshooting and optimization.
- Alerts and Notifications: Sends alerts when predefined conditions or thresholds are met or exceeded.
- Logging and Reporting: Provides detailed logs and reports for analyzing historical data and identifying trends.
- Scalability and Load Testing: Capable of handling high loads and simulating heavy traffic scenarios.
- Security and Authentication: Supports secure communication, authentication, and authorization mechanisms.
- Integration with Existing Systems: Connects with other tools and systems in the technology stack for seamless collaboration.
- Customization and Flexibility: Allows customization of monitoring parameters, thresholds, and alerts for specific requirements. Supports monitoring various types of APIs.
Benefits Of API Monitoring
The biggest benefit of API monitoring is how fast issues can be detected. This allows for proactive troubleshooting and the resolution of issues before the begin to affect the end user. This will in turn, increase reliability by ensuring that APIs are consistently working properly.
All of this will lead to an enhanced user experience by reducing bottlenecks and optimizing API response times. An effective API monitoring system will also lead to better decision making when designing web systems.
Valuable data and insight in an API’s usage patterns will allow for more informed decisions regarding scaling, resource allocation, and other improvements. Using this data, API performance can be optimized and improved by referencing the gathered performance metrics and identifying areas of improvement.
As mentioned above, all of this insight will help ensure compliance with SLA and security requirements by quickly alerting developers of any issues that could allow unauthorized access or other vulnerabilities. Overall, API monitoring is essential for faster issues resolution and minimizing downtime.
For businesses, API monitoring has an added benefit of providing valuable insights into customer behavior, usage patterns, and overall business performance. This can help improve strategic decision making and overall customer satisfaction.
API Monitoring Best Practices
- Here are the notable best practices of API monitoring you need to know.
- Define meaningful monitoring metrics and KPIs aligned with business goals and user expectations.
- Implement real-time monitoring and alerts to detect quickly and respond to issues.
- Employ synthetic API monitoring to identify proactively problems from an external perspective.
- Use API analytics and reporting to gain insights for optimization and enhanced user experience.
- Integrate API monitoring with existing DevOps tools for seamless collaboration and efficient issue resolution.
- Embrace proactive load testing to evaluate performance and scalability under high-traffic conditions.
Popular API Monitoring Tools and Platforms
- Pingdom: Real-time monitoring, uptime tracking, response time monitoring, status code tracking. Ensures availability, identifies issues and monitors critical APIs.
- New Relic: Comprehensive monitoring, performance insights, and error tracking. Provides real-time visibility, optimizes response times, and tracks dependencies.
- Datadog: Real-time monitoring, performance metrics, error tracking, latency monitoring. Offers visibility, proactive monitoring, and resolves bottlenecks.
- Postman: API testing, scheduling, monitoring response times, error detection. Unified platform for testing, tracking performance, and issue resolution.
- Runscope: API testing, uptime monitoring, response times, and error detection. Ensures availability, multi-location monitoring, and identifies performance issues.
- LoadView: Comprehensive load testing and API monitoring for performance optimization. Ensures scalability and improves user experience.
NOTE: Choose based on specific requirements, budget, and API ecosystem.
API Monitoring with Dotcom-Monitor and LoadView
Dotcom-Monitor’s LoadView is one of the most popular API monitoring tools currently available. Dotcom-Monitor offers extensive global coverage, boasting a vast network of monitoring points across several geographical locations worldwide.
This expansive network allows for more comprehensive API performance and availability testing from diverse regions. This helps to ensure a more consistent user experience by identifying potential regional variations in API performance.
Dotcom Monitor conducts API requests from different locations and measures the response times. This provides valuable insight into speed and performance of an API. This will also allow for bottlenecks or performance issues to be easily identified and addressed.
The testing process is extremely thorough and involves several multi-step API transactions to verify the functionality of a system. This will ensure that all critical functions of the API are working properly and any issues that affect the user experience identified.
Dotcom-Monitor provides the tools needed to continuously check the availability of an API network at given intervals. This will allow for instant alerts if the API cannot respond for some reason or returns an error. In addition, Dotcom-Monitor can also help ensure SLA compliance as well as general error analysis and troubleshooting.
API Testing Using Postman (Step-By-Step)
The process for using Postman to test an API has been detailed below:
- Launch Postman: Open the Postman application on your computer.
- Create a New Workspace: Click on the workspace tab at the top and Click on Create Workspace.
- Create a new request: Click on the “New” button in the Postman interface to create a new request. The request builder will open.
- Enter the URL: In the request builder, enter the URL of the API endpoint you want to test in the address bar. Include the protocol (e.g., “http://” or “https://”) and the complete URL path.
- Configure request parameters: Specify the request method (GET, POST, PUT, DELETE, etc.) by selecting the option from the dropdown menu in the request builder. If needed, provide any necessary request headers, query parameters, or body content.
- Add tests (optional): If you want to add tests to validate the API response, switch to the “Tests” tab in the Postman interface. Here, you can write JavaScript code to define your tests, similar to the earlier examples.
- Send the request: Click on the “Send” button to send the API request. Postman will execute the request and display the response in the “Response” pane below the request builder.
- Analyze the response: Review the response received from the API. Check the status code, response headers, and response body to ensure they match your expectations.
- Review test results (if tests are added): If you have added tests in the “Tests” tab, Postman will automatically execute them and display the test results in the “Tests Results” section. Review the results to see if the tests passed or failed.
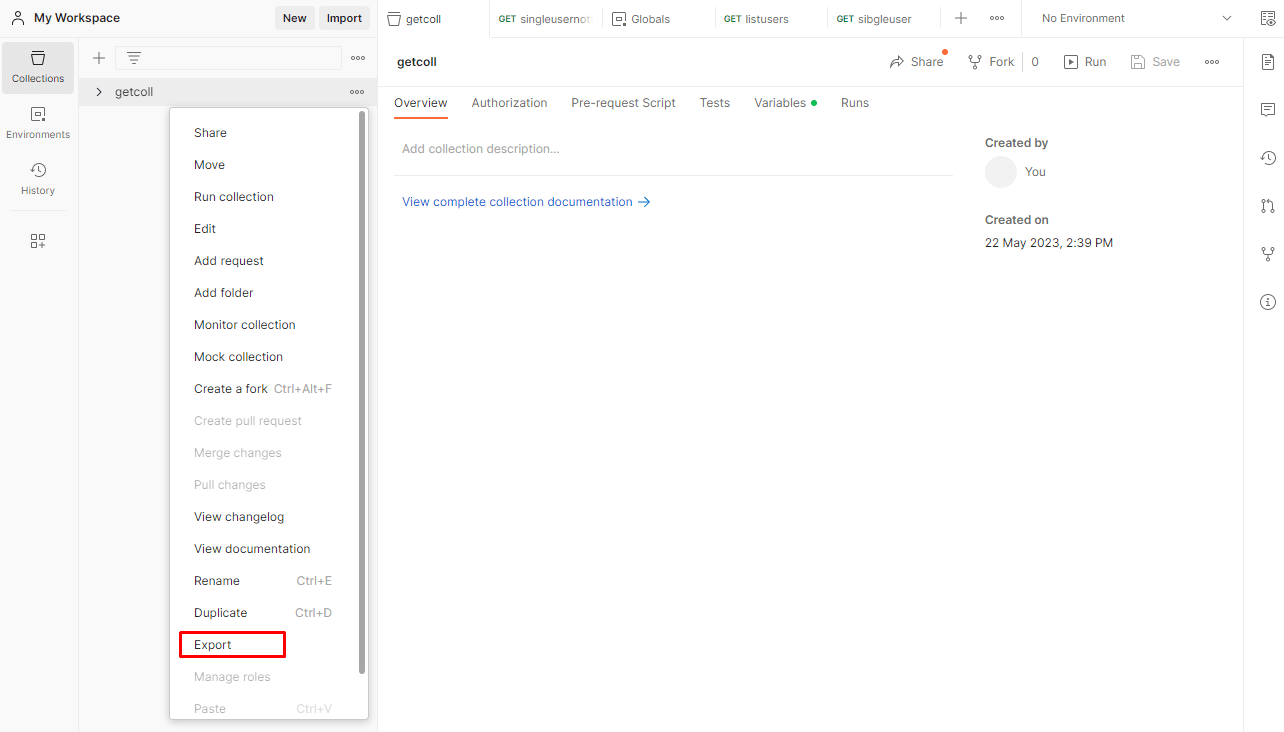
- Export and Save: Click on options for the postman and select Export and Save.
Monitoring In Dotcom-Monitor (Step-By-Step)
Performance testing is essential for evaluating the capability of back-end applications to handle real-world traffic. Besides functional testing, it’s important to conduct performance tests to ensure the application can handle simultaneous user load.
While Postman is ideal for API functional testing, LoadView is a specialized load-testing tool that generates load tests from API call collections. LoadView is a powerful tool that enables real browser-based load testing for APIs, web applications, websites, and servers.
By using LoadView, we can stress test the application under various traffic scenarios, identify performance bottlenecks, and ensure it can effectively handle the expected user load. The process for using LoadView for API testing has been detailed below.
- In Loadview, Select the Monitoring option and you can see the ‘ new Device’ button in the top right corner.
- Create a Device and Select Postman Collection as the Web Services.
- Select the Import > Import file and select the file exported from Postman. Look up the above reference where you export the collections from the postman.
- Enter the description that explains the function of the task.
- Fill up the collection Timeout, Request Time Out, And Script Timeout.
- Click on Monitoring.
- Select the frequency, the locations, the monitoring schedule, and the device you wanted to run.
- Click on Create device and the reports will display.
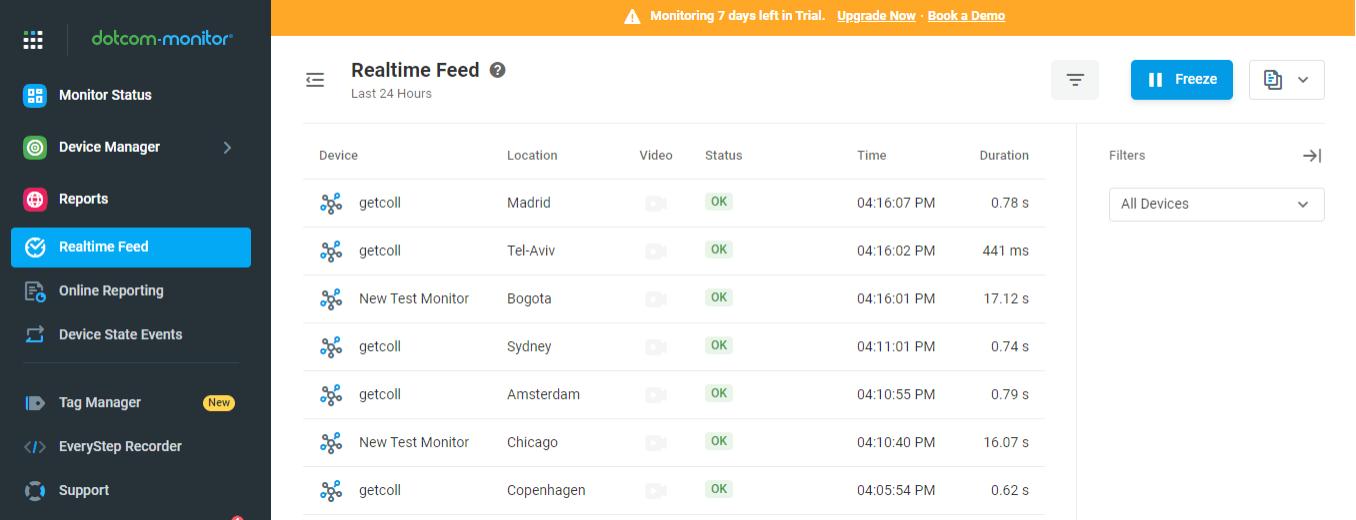
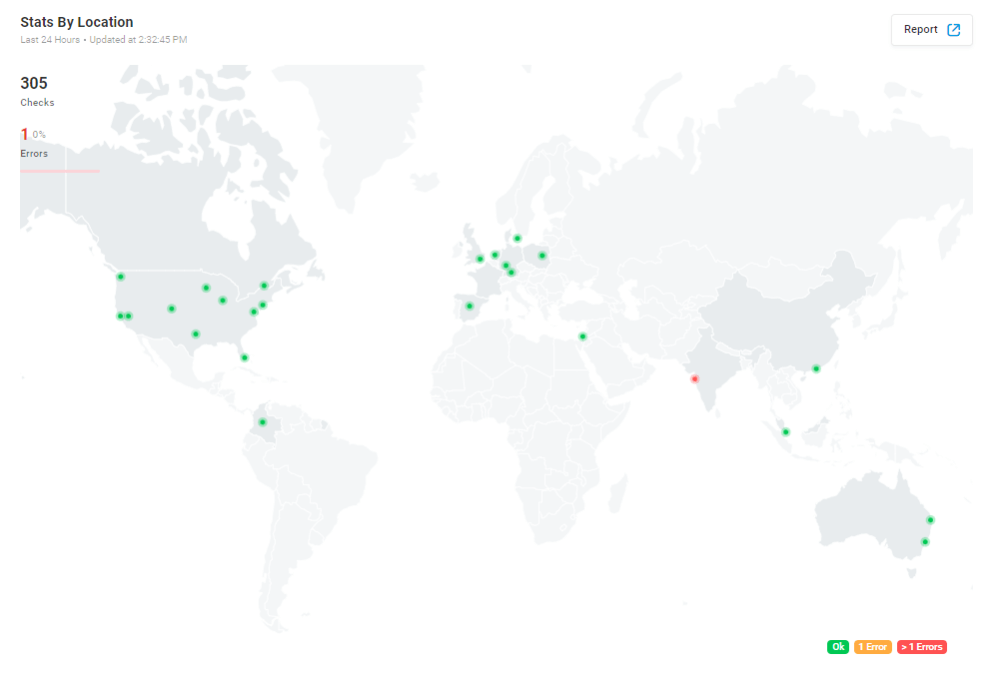
- Click on Monitoring status, We can see the locations and status of the test, Overall test results, and the latest test results.
Monitoring Postman Collection Tests with Dotcom-Monitor
Dotcom-Monitor offers a comprehensive platform with LoadView and other solutions. It allows easy monitoring of Postman collections, making it ideal for internal API testing.
With Dotcom-Monitor, you can upload Postman tests and create automated monitoring tests that generate error alerts. You can customize parameters like monitoring locations, scheduler, filters, and reporting options.
It will repeatedly execute the uploaded HTTP requests, verifying API responses against specified assertions. If any assertions fail, it will mark the test as unsuccessful.
Challenges In API Monitoring
There are several challenges when it comes to efficient API monitoring. As APIs are becoming more complex, with microservices and multi-cloud environments, it becomes more difficult to track dependencies and ensure system reliability.
API monitoring must also be done with extremely robust security measures in place to protect sensitive data. This in conjunction with the fact that monitoring solutions must offer real-time insights, makes the process that much more complex.
API version and compatibility issues continue to pose a challenge for developers as well. With the rise of machine learning and intelligent analytics, API monitoring could be even more complex in the future. By addressing these challenges and following emerging trends, organizations can establish robust API monitoring strategies and deliver exceptional user experiences in an evolving technological landscape.
Final Thoughts on API Monitoring
API monitoring is one of the most crucial parts of the software development process. By actively monitoring APIs, developers and business can easily detect and troubleshoot issues as soon as they arise.
This in turn, leads to faster issue resolution and proactive troubleshooting. This will ensure that an API is reliable and performing within service level compliance. If you are looking for one of the best API monitoring tools currently available, then Dotcom-Monitor has what you are looking for.