Updated June 2026 · 11-minute read

Ask any on-call engineer about their monitoring and they will tell you the same thing: the alerts are not the problem. The noise is. A typical stack fires on every slow sample, every single-location blip, every dependent check that trips when one upstream service breaks. After a few weeks of that, people stop reading the alerts. And the one night a real outage hits, it lands in the same muted channel as 200 false positives.
That is how alert fatigue drives up Mean Time to Resolution. The detection was never the bottleneck. The signal got buried. This guide is about building website monitoring alerts that only fire when user experience is actually compromised, so your team trusts them enough to move when they do. We will cover confirmation logic, escalation tiers, dependency-aware suppression, and threshold math, with the exact settings that separate a calm on-call rotation from a pager that nobody answers.
Why Most Alerts Are Noise, Not Signal
A monitoring alert has one job: tell a human something is wrong that they need to fix. Most alerts fail that job through three common patterns, and each one has a clean fix.
Single-location false positives are the most frequent. One monitoring agent in Frankfurt hits a transient network hiccup, the check fails, the alert fires, and your site was never down for a single real user. Run uptime monitoring from one location and a chunk of your pages will be packet loss between your monitor and your origin, not actual outages.
Flapping thresholds are next. You set a response-time alert at 2,000 ms because that felt slow. But your p95 (the response time your slowest 5% of requests actually see) already lives around 1,800 ms during peak traffic, so the alert trips every afternoon, clears on its own, and trips again. Nobody acts on it because there is nothing to act on. The number was wrong, not the site.
And then there is the alert storm. DNS resolution breaks for your domain. Now your homepage check fails, your login check fails, your checkout check fails, your API checks fail, and your SSL check fails because the monitor cannot even reach the host. One root cause, forty alerts, all firing inside the same minute. The on-call engineer has to read all forty to find the one that matters.
Fix those three patterns and you remove most of the noise. The rest of this guide is how.
Confirm an Outage Before You Page Anyone
The single highest-impact change you can make is to require confirmation before an alert fires, and Dotcom-Monitor is built to enforce exactly that. Rather than paging on the first failed check, you set the conditions a failure has to clear before anyone hears about it: agreement from more than one location, and more than one consecutive failed check. Both are configured per monitor, so you decide how much proof each check needs before it pages.
Multi-location confirmation kills the false positive at the source. If a check fails from Frankfurt but passes from Dallas, London, and Singapore at the same moment, the problem is the path to Frankfurt, not your site. A real outage fails everywhere. This is the job of the Dotcom-Monitor global monitoring network: when a check fails, Dotcom-Monitor automatically re-tests it from additional locations before it ever sends an alert, so a single regional blip never reaches your on-call rotation. You only hear about failures that more than one vantage point agrees on.
Consecutive-failure logic handles the momentary glitch. In the Dotcom-Monitor alerting system you set an alert to fire only after two or three checks in a row fail, not the first. At a one-minute interval, that adds one or two minutes of detection latency in exchange for cutting transient noise to near zero. For most sites that trade is obviously worth it, and because the filter is set per monitor, a marketing page can tolerate a slower confirmation than a payment endpoint.
Confirmation does add a small delay. If you run a system where one second of downtime is genuinely catastrophic, you may accept more false positives in exchange for faster detection. Most teams are not in that position, and the confirmation trade buys them quiet pagers.
Build Escalation Tiers That Match Severity
An alert and an escalation are not the same thing. The alert is the fact that a check failed. The escalation is the rule that decides who hears about it, on which channel, and what happens if nobody responds. Flat alerting, where every failure pages everyone the same way, is the fastest route to a team that ignores its pager.
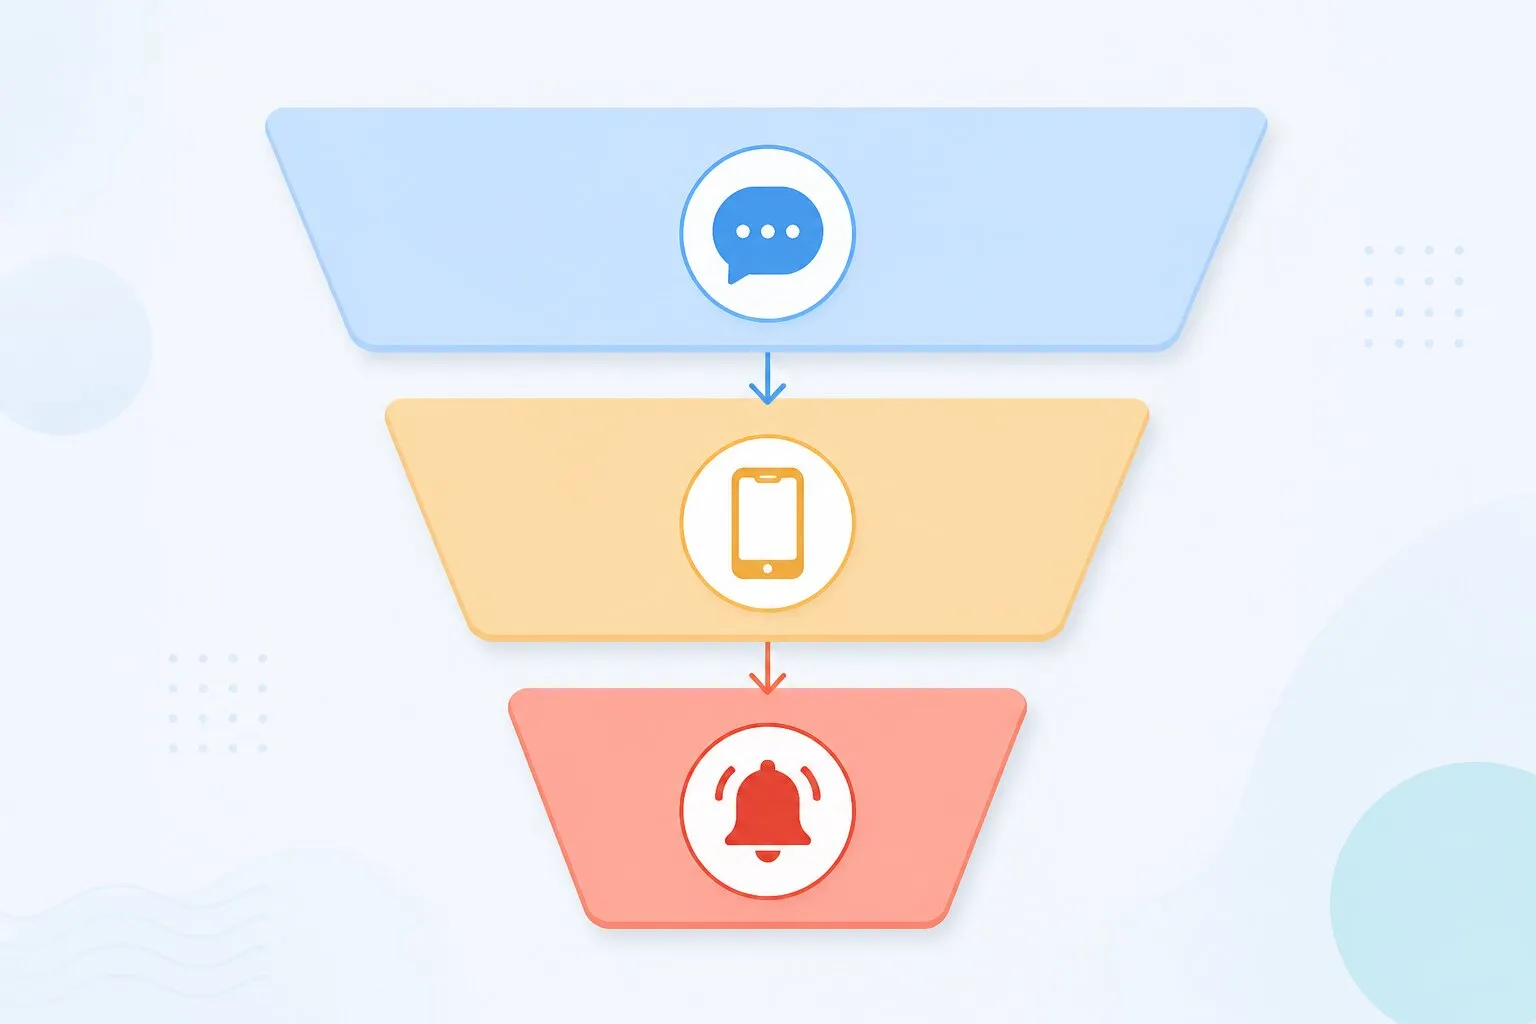
Start by sorting failures into severity tiers and matching each to a channel. The principle is simple: the louder the channel, the higher the bar to use it.
| Severity | Example | Channel | Who responds |
|---|---|---|---|
| Critical | Checkout or login down, confirmed from multiple locations | SMS, phone, PagerDuty | On-call, immediately |
| High | Core page slow past p95 for 10 minutes | Slack or Teams, @on-call | On-call, within the hour |
| Low | Marketing page slow, single asset 404 | Email digest, dashboard | Reviewed next business day |
Then add time-based escalation on top of severity. A critical alert hits Slack and the on-call engineer at the same moment. If it is still open after ten minutes, it pages a second time by SMS. After twenty, it notifies the secondary on-call or the team lead. Nobody has to remember to escalate by hand at 3 AM, and a missed page does not become a missed outage.
Dotcom-Monitor handles this with notification groups and escalation schedules. You define who is on call, which channels each tier uses, and how long an alert waits before it climbs to the next person. It integrates with the channels teams already live in, so a Slack or Microsoft Teams notification reaches the people working and a PagerDuty escalation handles the after-hours path. The point is to route by severity, not to broadcast everything and hope someone notices.
Let Dependency Checks Suppress the Symptoms
The alert storm is a structural problem, and you solve it structurally. Your checks have a dependency order, and most teams ignore it. A request to your checkout page depends on DNS resolving, then TCP connecting, then the TLS handshake completing, then HTTP returning content, then the transaction itself succeeding. When something low in that stack breaks, everything above it fails too.
So order your monitoring the same way the request flows, and let the root cause mute the symptoms. Dotcom-Monitor’s multi-protocol monitoring is what makes this practical: you watch DNS, TCP, TLS, HTTP, and the full transaction as separate checks, so when something fails you can see which layer broke and alert on that one instead of the pile-up behind it.
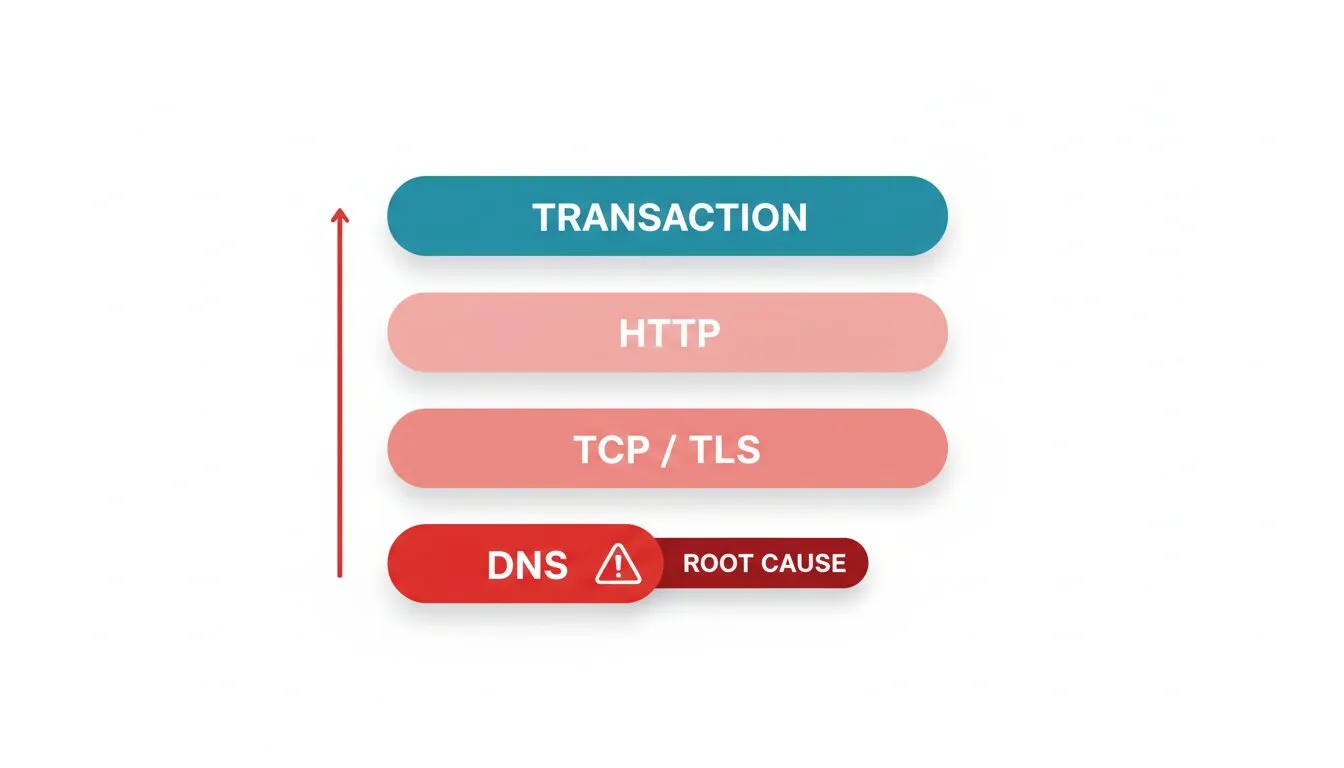
- DNS first. If DNS monitoring shows resolution failing, you already know why every downstream check is red. Alert on the DNS failure and suppress the rest.
- Then connection and certificate. A failed TLS handshake or an expired certificate breaks every HTTPS check behind it. Catch it at the certificate layer with SSL certificate monitoring and you get a single, clear alert instead of a flood of generic page failures.
- Then the application. If DNS, TCP, and TLS are healthy but the page or API monitoring check fails, now you have a genuine application-layer incident worth paging on.
Transaction monitoring sharpens this further. Instead of alerting on every individual asset, script the user flow that actually matters and alert on the flow. Dotcom-Monitor’s EveryStep scripting records a real-browser path, such as search, add to cart, and begin checkout, then alerts when a specific step fails. If step four breaks but the homepage is fine, you get one alert that says checkout is down at the payment step, not twenty that say various assets returned errors. That is the difference between a page that tells you what broke and a page that tells you something broke.
Group monitors by dependency so a parent failure mutes its children. One root-cause alert beats forty symptom alerts every time.
Format Thresholds So Alerts Mean Something
A threshold is a promise that crossing this line means something is wrong. Most thresholds break that promise because they are static numbers picked once and never revisited. Three rules keep them honest.
Use Percentiles, Not Averages
Averages hide the slow requests that actually hurt users. A page can average 900 ms while its p95 sits at 3 seconds, which means one in twenty visitors waits three seconds. Alert on the p95, or the p99 for checkout flows, because that is the experience your slowest real users get. Dotcom-Monitor’s performance reports break out response time by percentile and by location, so you can set a threshold against the number that reflects real experience instead of a flattering average.
Require a Sustained Breach
A single slow sample is not an incident. In Dotcom-Monitor you apply the same consecutive-failure filter to performance that you use for availability, so a response-time alert fires only after the slow result repeats across several checks in a row, not on the first sample that crosses your line. It cuts the afternoon-traffic flapping that trains people to ignore latency alerts.
Alert on Lead Time for Anything That Expires
Certificates and domains do not degrade. They work, and then one day they do not. So the threshold is not a performance number, it is a calendar. Fire an SSL alert 30 days before expiry and again at 7 days, and you turn a midnight outage into a routine ticket. The right certificate alerting means the renewal happens during business hours, not during an incident.
If you want to tie performance thresholds to a business number, an error budget calculator helps you work out how much degradation your SLA can actually absorb before an alert is worth waking someone for.
A 2 AM Checkout Outage, Step by Step
Put the pieces together with a real pattern most ops teams have lived through. It is 2:14 AM. A certificate on your payment gateway’s intermediate domain expires.
Without alert engineering: Every HTTPS check behind that certificate fails at once. The on-call engineer’s phone lights up with 30 SMS messages: homepage down, checkout down, account page down, three API endpoints down, assorted asset failures. They wake up, squint at a wall of identical-looking alerts, and spend fifteen minutes figuring out that it is not thirty separate problems. MTTR is already shot before anyone touches the actual fix.
With alert engineering: The SSL certificate monitoring check identifies the expired certificate as the root cause. Dependency grouping suppresses the downstream page and API alerts, because their parent already failed. The engineer gets one critical SMS: certificate expired on the payment intermediate, confirmed from five locations. They know exactly what broke and where, and they are renewing the certificate while the old setup would still be counting alerts.
The outage and the detection speed are identical in both versions. What changes the night is how the alerts were built. And the certificate alert that should have fired 30 days earlier? That is the version where this incident never happens at all.
Mute the Noise During Deploys and Maintenance
Self-inflicted alerts are a large share of total alert volume, and they are the easiest to remove. When you deploy, run a migration, or take a service down for planned maintenance, your checks will fail. If those failures page the on-call engineer, you are training the team to expect false alarms during exactly the windows when they should be paying attention.
Set maintenance windows so monitoring suppresses alerts during planned work, then resumes automatically. Dotcom-Monitor lets you schedule these per device or device group, so a deploy to the checkout service mutes checkout alerts without silencing the rest of the site. Pair that with your CI/CD pipeline and the suppression window can open and close around the deploy itself.
Setting the window has to be a habit, because a maintenance window that someone forgets to set is the same as no window. Build the suppression into your deploy runbook so it is not a thing to remember at 11 PM on release night. If you run frequent deploys, integrating monitoring into the CI/CD pipeline lets the suppression happen automatically as part of the release.
Audit Your Alerts Every Month
Alert configuration is not set-and-forget. Sites change, traffic patterns shift, and an alert that made sense six months ago is now the one everybody mutes. So run a short monthly audit with three questions.
First, which alerts fired without anyone acting on them? Pull the list of alerts that resolved on their own with no human response. Any rule that fired more than a few times without action is a candidate for retirement or retuning. It is generating noise, not signal, by definition.
Second, which incidents had no alert? The more revealing question. Walk back any outage or slow period that a customer or another team caught before your monitoring did, and add the check that would have caught it. Gaps are more dangerous than noise because they are silent.
Third, do the thresholds still match reality? If your p95 has drifted up with traffic growth, your old threshold is now either too tight or too loose. Re-baseline against the current numbers in your uptime and SLA reports rather than the numbers from when you set it up.
This whole approach sits inside a broader set of website monitoring best practices, but alerting is where most of the day-to-day pain lives. Get the alerts right and the rest of the stack gets quieter on its own.
Build Alerts Your Team Actually Trusts
Dotcom-Monitor confirms failures from a global network before paging, routes by severity through Slack, Teams, SMS, and PagerDuty, and catches DNS, TLS, API, and transaction failures at the layer that broke. See how the Dotcom-Monitor alerting system works, or start with uptime monitoring and tune from there.
