
Most teams have website monitoring. Far fewer have website monitoring that actually catches problems before customers, sales, and support do. The gap is rarely the tool. It is the practices wrapped around it: what gets checked, from where, how often, what triggers a page, and who decides when a check is broken versus when the site is broken.
This playbook collects eight website monitoring best practices that separate setups SRE and DevOps teams trust from setups that quietly turn into noise. Each one is concrete: thresholds, intervals, anti-patterns, and what to keep doing once it works. The same practices apply whether you are running uptime monitoring on a marketing site or full synthetic transaction monitoring across a SaaS checkout.
What “Good” Looks Like (and Why Most Setups Miss It)
A working definition: your monitoring is good if your team learns about every customer-facing problem from a monitor before they learn about it from a customer, and if the pages you receive are almost always actionable. That is the entire bar.
Three numbers track it. Mean time to detect (MTTD) tells you whether monitoring is fast enough. Mean time to resolve (MTTR) tells you whether the data the monitor surfaces is enough to fix the problem. Alert precision—the percentage of pages that were real and required immediate action—tells you whether your team will still trust the alerts in six months. Most SRE teams measure MTTD and MTTR. Most teams do not measure precision. That is why so many on-call rotations decay into silent acknowledgments and learned helplessness.
The rest of this playbook is about pushing both numbers in the right direction at the same time.
Layer Checks Across the Full Request Path
A single HTTPS check is a smoke alarm with one sensor. It tells you something is wrong, not where. When a user types your URL and waits for the page to render, the request passes through at least six layers: DNS resolution, TCP handshake, TLS negotiation, HTTP response, asset loading, and client-side rendering of the final view. Each layer fails differently and each has its own root cause.

The practical setup looks like this:
- DNS: Check A, AAAA, CNAME, and MX records resolve to expected values from multiple resolvers. DNS issues are the easiest to miss and the most painful to debug after the fact. The best DNS monitoring tools watch for unauthorized record changes, propagation delays, and resolver-specific failures.
- TCP and ICMP: Confirm the port is open and the network path is healthy. A firewall change that drops 443 will not show up in an HTTP check from the same network segment.
- TLS: Validate certificate chain, expiration date, hostname match, and cipher support. Most certificate outages are preventable—the cert just expired on a Sunday. Get explicit expiration alerts at 60, 30, 14, and 3 days. See how to monitor SSL certificate expiration for the configuration detail.
- HTTP: Status code, response time, and a content assertion. Status 200 with a blank body is a failed check, not a success.
- Render and transaction: Drive a real browser through the user journey, assert on a known element in the final state, and measure time to interactive. Synthetic monitoring using real browsers catches what protocol checks cannot—broken JavaScript, third-party scripts that hang, a missing CSS file that makes the cart button invisible.
- API: Treat APIs as first-class endpoints. A site that loads but cannot complete a checkout because the payment API is timing out is still broken. API monitoring deserves its own check schedule, separate from the pages that depend on it.
When something breaks, the layer that alerts first is your starting point for root cause. A team that monitors only HTTP gets one bit of information: down. A team that monitors all six layers gets a fault tree.
Run Synthetic and RUM Side by Side, Not Instead of Each Other
The two methods answer different questions and they are not substitutes. The table below summarizes the split most teams settle on after running both for a quarter.
| Capability | Synthetic Monitoring | Real User Monitoring (RUM) |
|---|---|---|
| Data source | Scripted checks from controlled locations | Actual visitor browsers |
| Works with zero traffic | Yes | No |
| Consistent baseline | Yes—same script, same locations | No—shifts with traffic mix |
| Catches regressions before users do | Yes | No |
| Reflects real device and network diversity | Limited | Yes |
| Best for | SLA reporting, proactive alerting, uptime monitoring | Real-world experience analysis, prioritizing fixes |
| Common failure mode | Missing edge cases not scripted | Learning about outages from Twitter |
Synthetic monitoring runs scripted checks on a fixed schedule from a fixed set of locations. The data is consistent across time and immune to traffic dropouts. It also works at 3 a.m. when no real users are around to notice the deploy that broke the login page. That is why synthetic monitoring is the right tool for SLA reporting, regression detection, and proactive alerting.
RUM captures performance and error data from actual browsers. It reflects the real distribution of devices, networks, and geographies your users live in. It is the only source that can tell you a 2% slice of Android users on a specific carrier are seeing a 9-second time to first byte. RUM is the right tool for understanding real-world experience and prioritizing engineering work.
Use synthetic to know the site is up and behaving normally. Use RUM to know how that behavior maps to the people paying you. Teams that pick one and skip the other either get blindsided by edge cases (synthetic only) or learn about outages from Twitter (RUM only).
See Both Sides of Your Site
Dotcom-Monitor runs real-browser synthetic monitoring from a global checkpoint network and integrates with the RUM data your front-end team already collects. One platform, both views.
Monitor From the Geographies That Generate Revenue
A check from your data center next door tells you whether the data center is online. It does not tell you whether a user in São Paulo is having a good day.
The rule is simple: place checkpoints in every region that contributes meaningfully to revenue, plus one or two regions that act as a control. If 35% of your sales come from EMEA, you need at least two EMEA checkpoints—one in a primary market like Frankfurt or London, one in a secondary like Madrid or Stockholm. Single-checkpoint EMEA coverage hides regional ISP outages and CDN edge failures.
Three patterns worth setting up:
- Multi-geo confirmation for paging. Require a failure to repeat from at least two distinct regions within 60 seconds before paging. One region failing in isolation is usually a regional carrier issue or a single checkpoint problem, not a site outage.
- Regional baselines. Tokyo and Iowa do not load your site at the same speed and they should not share a threshold. Track p95 latency per region and alert on regional deviation, not global average.
- Private agents inside corporate networks. If you sell to enterprises that access your app from behind their own firewall, run a checkpoint inside that environment. Private agents catch problems caused by the customer’s network, not yours, which still feels like your problem to the customer.
The Dotcom-Monitor checkpoint network spans 30+ countries; the specific list to enable depends on where your money comes from, not where your data center sits.
Set Thresholds From Baselines, Not From Round Numbers
The most common monitoring sin is “alert if response time > 3 seconds.” Three seconds is a round number. Your site does not care about round numbers. If your real p95 is 4.2 seconds and stable, you get paged 24 times a day for normal behavior. If your real p95 is 0.8 seconds and degrades to 2.5 seconds, you get nothing because 2.5 is still under 3.
The fix is a baseline-relative threshold:
Alert when sustained p95 over a 10-minute window exceeds (baseline p95 × 1.5) or (baseline p95 + 2σ), whichever is larger, and the condition persists for two consecutive evaluation windows.
That formula does three things at once. The 1.5× multiplier scales with the page so a fast page and a slow page can share the same rule. The 2σ term suppresses normal volatility. The “two consecutive windows” gate kills the spike-and-recover false positives that account for most paging noise.
Baseline calculation is the part most teams skip. Recompute baselines weekly from the previous 14 days, excluding deploy windows and known incident periods. Anomaly detection products that auto-baseline are a fine shortcut if you do not want to manage this manually, but verify what they exclude. A baseline contaminated by last week’s incident is worse than no baseline at all.
For uptime checks, the equivalent rule: require two consecutive failures from two distinct geographies before paging. A single failed check from one location is almost always a checkpoint hiccup. Two from two is real.
Engineer the Alert, Not Just the Check
A check tells you something happened. An alert tells a human to do something about it. Those are different problems and most teams design only the first.
The job of alert engineering is to get the right information to the right person in a format that lets them act in under 60 seconds. The blockers are usually:
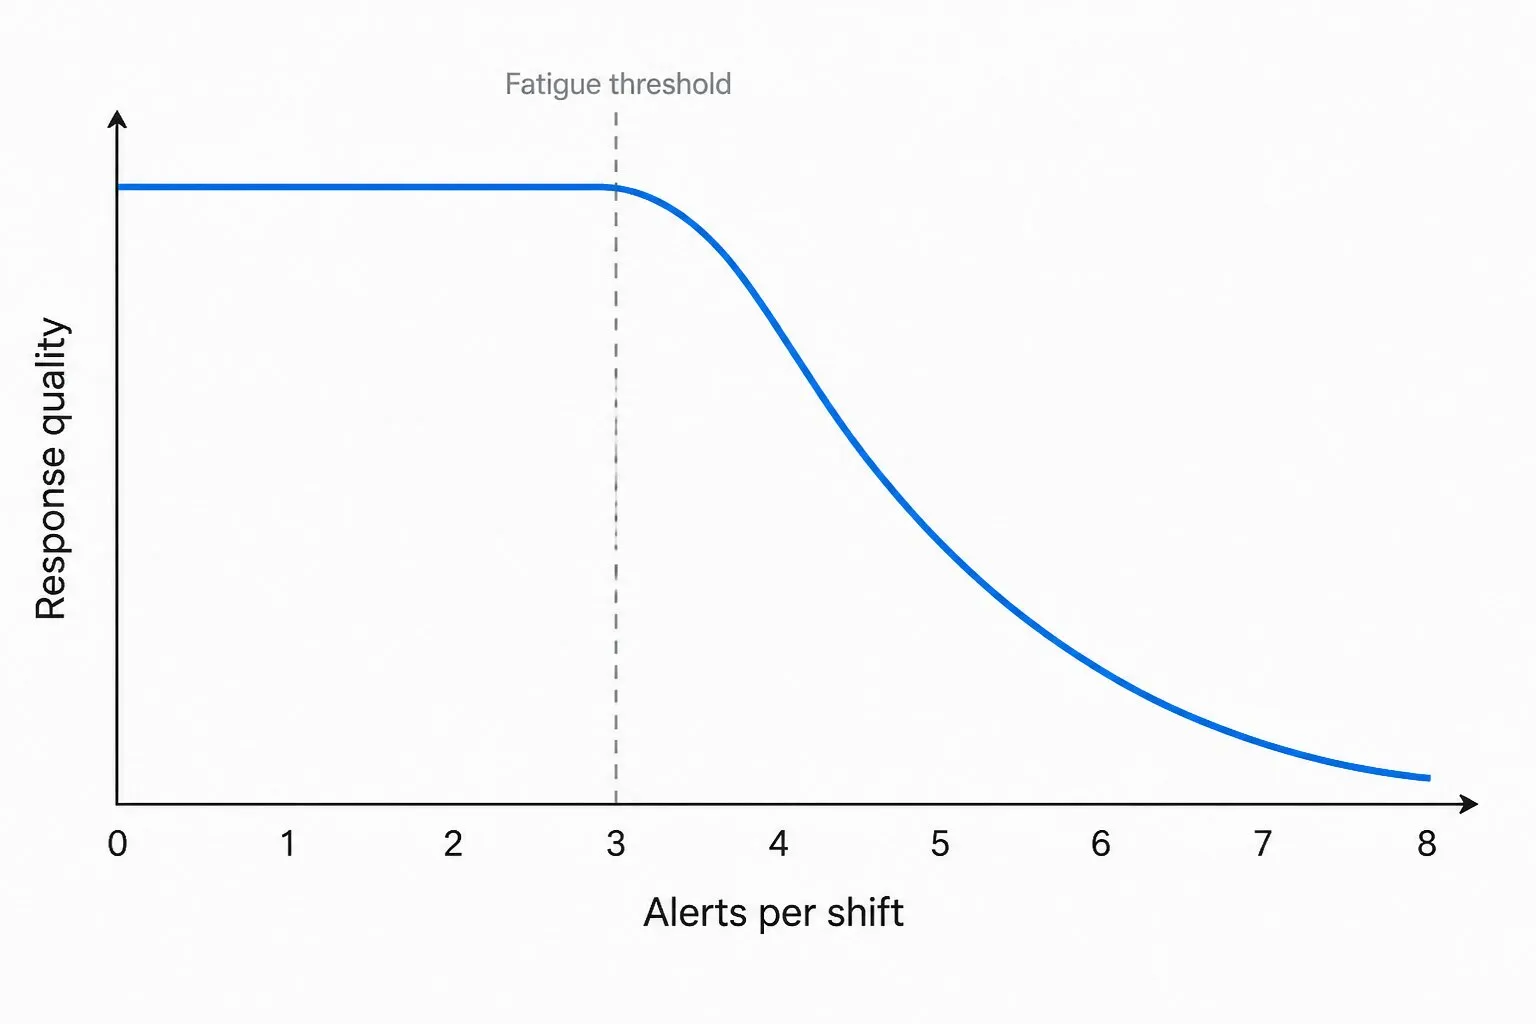
- Too many alerts. If the average on-call engineer gets paged more than three times per shift, the next page they get will be triaged with reduced attention. This is not a moral failing. It is how human attention works.
- Alerts without context. “Checkout slow” is not actionable. “Checkout p95 4.8s (baseline 1.1s) from EU regions, started 14:32 UTC, correlated with deploy abc123 at 14:30” is actionable.
- Wrong channel. Slack is not paging. Email is not paging. SMS, push, or phone call is paging. Mixing them dilutes signal.
The pattern that works:
- Three severity levels, three channels. Critical (site down, payment broken) → SMS or phone. Warning (sustained degradation) → push or chat with on-call mention. Info (single failed check, baseline drift) → dashboard or daily digest. Never page on info.
- Dependency suppression. If DNS fails, do not also page on the 14 downstream HTTP checks that depend on DNS. Alert grouping and dependency suppression are table stakes; if your platform does not support them, you are paying with sleep.
- Escalation lattice, not escalation chain. If the primary on-call does not acknowledge in 5 minutes, page the secondary and notify the channel. Serial escalation costs you 5 minutes per hop while the site is down.
- Quiet hours for non-critical. Performance regressions that happen at 2 a.m. on Sunday usually do not need a 2 a.m. wake-up. Critical does. Be honest about which is which when configuring rules.
And measure precision. Each month, count the pages that fired and tag each one: real incident, false positive, action not required. If precision is below 80%, fix the noisiest alerts before adding new ones.
Cover the Pieces You Do Not Control
Your site is not just your code. A modern checkout page loads scripts from a payment processor, a tag manager, an analytics provider, a chat widget, an A/B testing tool, a CDN, and sometimes a fraud detection service. Any of them can take the page down.
Third-party dependencies need their own monitors:
- CDN edge response time per region. CDNs do fail, especially during regional events.
- Payment gateway round-trip time as a synthetic API check against the gateway’s status endpoint or sandbox.
- Tag manager and analytics script load time measured as part of the synthetic transaction. A blocking analytics tag adds 2 seconds to every page; you want to know that.
- External authentication providers (OAuth, SSO). If your “log in with Google” button stops working, you need to know before your support queue does.
- DNS providers. Run DNS monitoring from multiple resolvers so you catch propagation lag and partial outages at the provider.
Document which third parties block which user journeys. When a third party fails, the runbook should say whether the right action is “fall back,” “wait it out,” or “page the vendor’s on-call.” Without that map, every third-party incident becomes an improv exercise.
Tie Every Monitor to a Runbook
The five most expensive minutes of any incident are the ones where the on-call engineer is figuring out what the alert means.
Fix that once: every monitor links to a runbook entry. The runbook does not need to be elaborate. Three sections are enough:
- What this check covers in one sentence. (“Validates that the EU checkout transaction completes in under 5 seconds from Frankfurt and Amsterdam.”)
- First five things to check when this fires. Status page links, dashboards, recent deploys, related alerts, the vendor’s status page.
- Known false positive patterns, if any. (“Frankfurt checkpoint occasionally times out during the vendor’s maintenance window 02:00-02:30 UTC Saturdays. Suppressed.”)
The first time you write a runbook, it takes 15 minutes. Every subsequent incident on that monitor takes 15 fewer. The math is obvious and most teams still do not do it.
Validate the Monitors and Audit Coverage Quarterly
An untested monitor is a wish, not a guarantee. Two practices catch the gaps.
Chaos drill the alerts. Once a quarter, deliberately break a check—shut down a test endpoint, expire a certificate in a staging environment, drop the response time threshold to 0—and confirm the alert fires, escalates, and reaches the right person. About a third of alerts fail their first drill. Common causes: stale on-call rotations, integration tokens that expired, Slack channels that nobody reads anymore.
Audit the coverage map quarterly. Maintain a single document listing every user journey, every external dependency, and every URL category. For each row, list the monitors that cover it. Empty rows are gaps. New features added in the last quarter usually live in the empty rows.
The audit also produces the opposite finding: monitors covering URLs that no longer exist. Delete them. A monitor on a 410 endpoint generates noise forever and protects nothing.
What to Look For in a Monitoring Platform
Most platforms can ping a URL. The differences show up in the harder cases. When evaluating tools, look past the dashboard demos and ask:
- Can it script a real-browser transaction with conditional logic? Static recordings break the first time the page changes. Scriptable transaction monitoring (Selenium-style or proprietary) survives normal product evolution.
- How many native protocols are supported? HTTP, HTTPS, DNS, FTP, SMTP, IMAP, POP3, TCP, UDP, ICMP. Each one you outsource to a separate tool is one more vendor relationship and one more login.
- What does the global checkpoint footprint actually look like? A vendor with 200 “checkpoints” all hosted in three cloud regions is not global. Ask for the city list.
- Can it run from inside your network? Private agents are required for any monitoring of staging environments, internal apps, and customer-private deployments.
- How does it handle alert dependencies and grouping? A platform that pages 14 times for one DNS failure is paying you back in cortisol.
- What does the data export look like? If you cannot pull raw check results into your own analytics stack, you will not be able to investigate the hard incidents.
- Integrations with your incident tooling. PagerDuty, Opsgenie, Slack, Microsoft Teams, ServiceNow, Jira. Native integrations beat webhook glue every time.
For a deeper buyer’s checklist with scoring rubrics, see how to choose the best website monitoring tool and Datadog competitors and alternatives for context on where each player fits.
Common Failure Modes
The patterns below show up in nearly every monitoring review. None require new tools to fix.
- One global threshold for a multi-region site. The fast region drifts up, the slow region degrades, the global average looks fine, and the alert never fires.
- Status-200 checks with no content assertion. A blank 200 from a CDN error page passes the check and dies in production.
- Synthetic transactions that depend on a real customer account. Password expires, MFA enrolls, account locks. Use a service account with explicit monitoring scope.
- Certificate alerts at 7 days only. Seven days is the deadline, not the warning. By then, somebody is already firefighting. Alert at 60, 30, 14, and 3 days. The SSL certificate monitoring setup should be staged.
- No deploy correlation. If your alerts do not surface “this fired 3 minutes after deploy abc123,” every incident starts with a manual git log review. Wire your CI to your monitoring annotations.
- Alert thresholds that never get tightened. If you set “> 5 seconds” two years ago and the site is now twice as fast, that threshold is functionally disabled.
- Monitoring the homepage but not the money path. Homepage availability is a vanity metric. Checkout, signup, and login availability are the business.
For application-layer specifics—particularly around APIs, scripted journeys, and microservice topologies—pair this with web application monitoring best practices. And for the SEO side of why latency budgets matter, see how website speed affects SEO.
Put the Playbook to Work
Pick three practices from this list that your current setup does not handle. Implement them this sprint. Run the chaos drill against the new monitors before you call them done. Then audit precision in 30 days.
If the platform is the bottleneck, Dotcom-Monitor covers the full stack in one place: real-browser synthetic monitoring, multi-protocol checks, a global checkpoint network with private agents, and alert engineering features built for the patterns above. See web application monitoring, API monitoring, DNS monitoring, and SSL certificate monitoring, or jump straight to the enterprise monitoring overview for larger environments.
Try the Platform That This Playbook Was Written On
Real-browser monitoring from 30+ countries, multi-protocol checks, scriptable transactions, and alert engineering that respects your sleep.
Start your free Dotcom-Monitor trial → No credit card. Or see pricing.
