Okta is a trusted leader in identity and access management, helping enterprises provide secure access to important tools for employees, partners, suppliers, and customers. With its extensive integration network—connecting to over 6,000 applications—the Okta Identity Cloud makes it simple and secure to access resources from any device. While Okta doesn’t include built-in synthetic monitoring for web applications, it does offer a few helpful reporting tools to keep you informed. Here are some examples:
Okta Trust Site: This site gives you an at-a-glance view of Okta’s system status. By logging in with administrator credentials, you can check the availability of the Okta server that hosts your subdomain, ensuring you’re always in the loop.
On-Premises Agent Health Checks: Certain on-premises Okta agents, like the Okta AD Agents, have built-in health monitoring features. Okta keeps a close eye on these agents and sends email alerts to all administrator accounts within minutes if downtime occurs. You can find even more details about AD Agent availability here. These tools ensure you can keep tabs on your Okta setup and stay informed without needing synthetic monitoring.
Monitoring Application Access
Monitoring access to applications through Okta has its limitations. Okta reports don’t provide direct notifications for application downtime, and the System Log always shows a successful authentication for applications integrated through SAML or WS-Federation. This happens because, due to asynchronous authentication, the browser will continue to relay a SAML assertion to the service provider, resulting in an HTTP 200 response even if the service itself is down.
To address these limitations, third-party synthetic monitoring tools can be invaluable. With Dotcom-Monitor, you can:
- Proactively Monitor Performance and Availability: Dotcom-Monitor helps you stay ahead of potential downtime for your Okta tenant, web applications, and on-premises agent services. In high-stakes business environments, any downtime can directly impact revenue, so proactive synthetic monitoring is essential to keep applications running smoothly across multiple geographic regions.
- Access Reliable Benchmarks and Reports: Dotcom-Monitor provides in-depth monitoring data and generates flexible, detailed reports. You can receive alerts by email, analyze interactive charts, and track key performance metrics—all of which offer valuable insights into application health.
- Detect and Resolve Issues Quickly: Dotcom-Monitor alerts your team at the first sign of performance issues, helping them address the root cause before it affects end users. With context-rich alerts, you can limit disruptions by swiftly implementing fixes.
- Support SLA Compliance and Accountability: Dotcom-Monitor also offers custom SLA reports, which enable you to hold third-party vendors accountable by providing concrete availability metrics. These SLA reports support your vendor agreements, ensuring you receive refunds or compensation if service levels fall short.
- Understand and Optimize End User Experience: By simulating actual end-user interactions, Dotcom-Monitor’s web application monitoring solution lets you see and address issues before they impact users, setting you up for a smoother go-live.
Caveats:
When Desktop Single Sign-On (DSSO) is enabled globally, it’s incompatible with monitoring tools. Best practices suggest limiting DSSO to specific gateway IPs. For more details, check out the recommended guidelines article here.
With Dotcom-Monitor, you gain essential visibility and control over application access and performance, helping you deliver a reliable, high-quality user experience.
Dotcom-Monitor’s SaaS monitoring platform for identity-protected applications closes this gap — visit the solutions page to see how real-browser monitoring handles SAML, OAuth, and delegated authentication workflows.
Site Availability
Check your Okta site’s website availability and page performance.
Creating the device
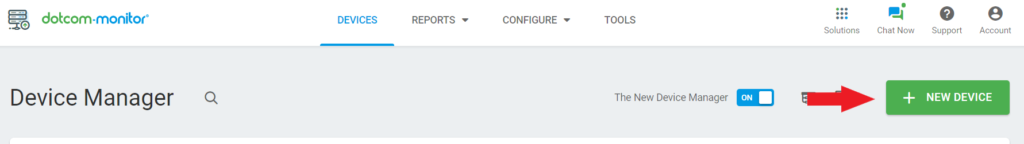
1. From your Dotcom-Monitor dashboard, navigate to Device Manager.
2. Select New Device.
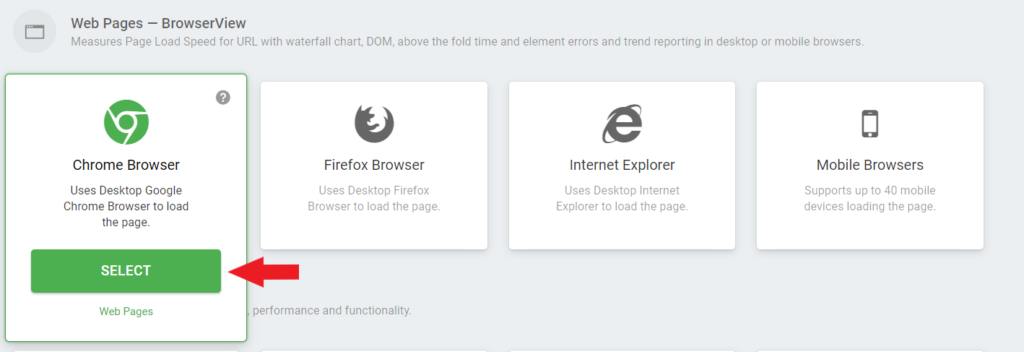
3. From under Web Pages — BrowserView, pick your browser of choice and hit Select.
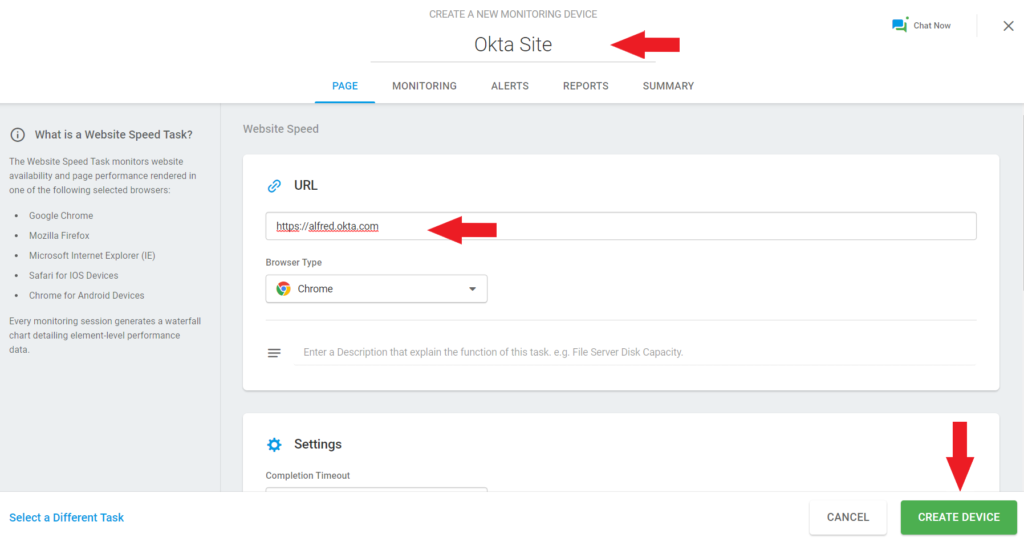
4. Enter a name for your new device (for this example, we’ll call it Okta Site) and insert your Okta URL* in the URL field, completing the task with Create Device.
Note: *Okta URL should be https://<subdomain>.okta.com or https://<subdomain>.okta-emea.com or https://<subdomain>.oktapreview.com
Observations
Please note that if you have DSSO globally enabled on your Okta tenant, you will instead need to use the back-door URL of Okta (appending /login/default at the end of your Okta URL). Your site and services availability may also be monitored by authenticating to the Okta Status page.
Web Application Single Sign-On:
Replicate a user’s browser interactions with a website through SSO in order to monitor the authentication performance metrics. In order to securely conduct testing, it is recommended you create a test account that will be assigned to each individual application in Okta which you’d like to configure for monitor.
Note: For creating test accounts within your Okta environment, please refer to Okta’s Manage Users article.
Creating the device
1. From your Dotcom-Monitor dashboard, navigate to Device Manager.
2. Select New Device.
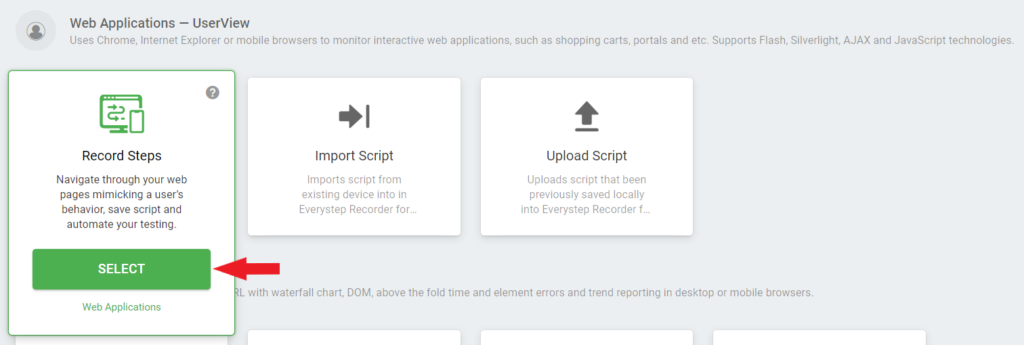
3. From under Web Applications — UserView, choose Record Steps and hit Select.
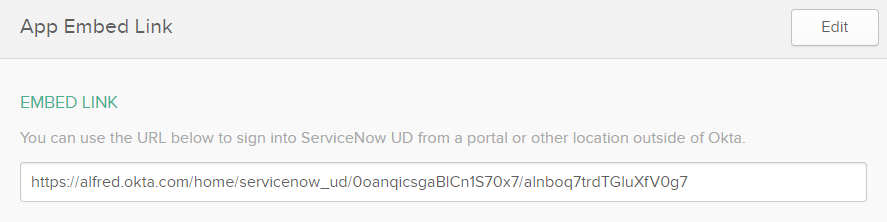
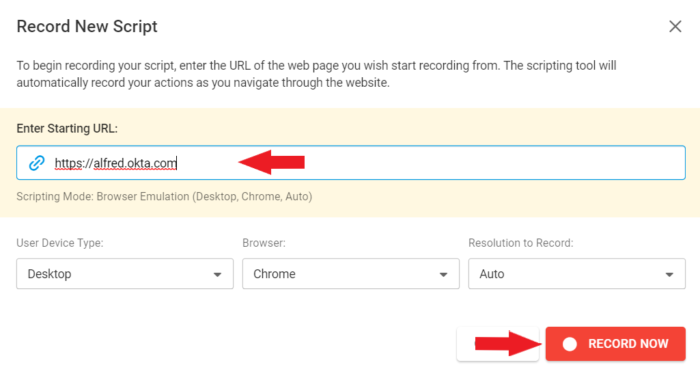
4. For the Enter Starting URL field, you will be required to use the Okta application’s embed link. Input the URL and proceed with Record Now.
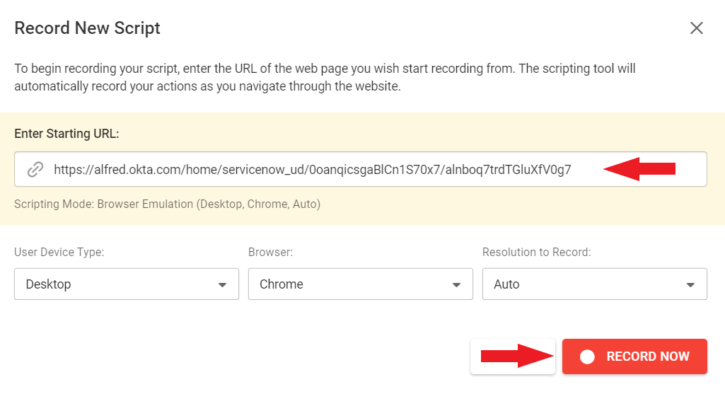
Note: In order to get the Application’s embed link, navigate from your Okta Administrative console to the application’s General tab, under the App Embed link section.
5. Fill in the web form with your test credentials in the web page view and initiate the login to the application.
6. Once successfully authenticated, hit Stop. On the dialog window, you will need to first play the recording once before saving it into a monitoring device.
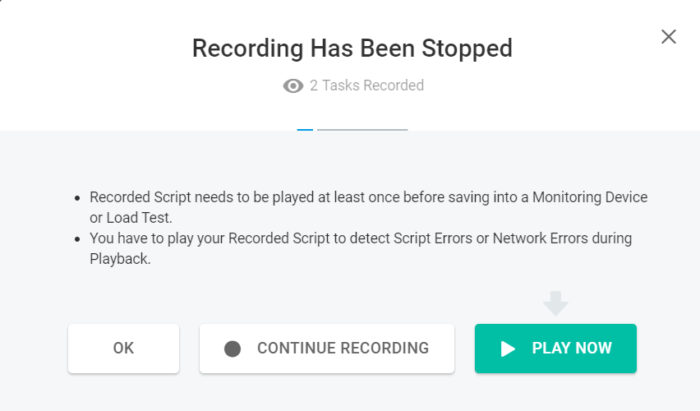
7. Once you’ve confirmed that the script has been successfully played without errors, go ahead and save it. You’ll return to the UserView setup wizard, where you’ll be able to name and create your device.
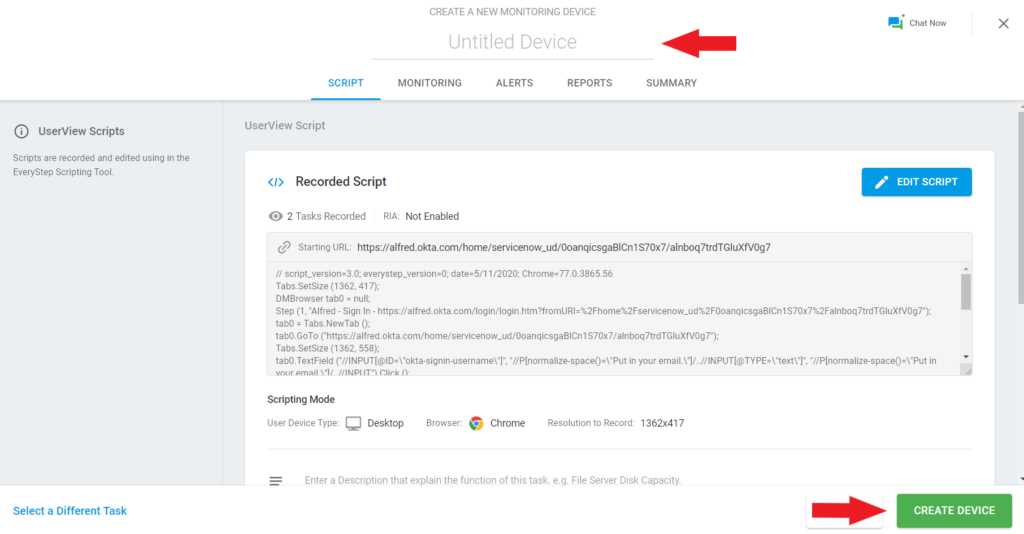
Observations
Please note that if you have DSSO globally enabled on your Okta tenant, the monitoring device cannot be set up. As such, DSSO has to be configured to specific network zones.
If your organization uses Azure AD FS as the identity provider rather than Okta, the same outside-in approach applies — our guide to monitoring applications that use Azure ADFS explains the authentication failure modes unique to federated directory configurations.
Delegated Authentication
Replicate a user’s browser interactions through delegated authentication to Active Directory in order to monitor the authentication performance metrics. In order to securely conduct testing, it is recommended you create a test account that will be assigned to each individual application in Okta which you’d like to configure for monitoring.
Notes:
For creating test accounts within your Okta environment, please refer to Okta’s Manage Users article.
For integrating your Active Directory instance with Okta, please refer to Okta’s article regarding Manage your Active Directory article.
For additional information on Delegated Authentication, please refer to Okta’s Delegated Authentication article.
Creating the device
1. From your Dotcom-Monitor dashboard, navigate to Device Manager.
2. Select New Device.
3. From under Web Applications — UserView, choose Record Steps and hit Select.
4. For the Starting URL field, you will be required to use the Okta application’s embed link. Input the URL and proceed with Record Now.
5. Fill in the web form with your test credentials in the web page view and initiate the login to Okta.
6. Once successfully authenticated into the Okta end user Dashboard, hit Stop. On the dialog window, you will need to first play the recording once before saving into a monitoring device.
7. Once confirmed that the script has been successfully played without errors, go ahead and save it. You’ll return to the UserView setup wizard, where you’ll be able to name and create your device.
Observations
Please note that if you have DSSO globally enabled on your Okta tenant, the monitoring device cannot be set up. As such, DSSO has to be configured to specific network zones.
For teams that also need to monitor the API layer that Okta-protected applications expose, our guide to DevOps API monitoring for SaaS teams covers OAuth 2.0 token monitoring, multi-step API chains, and how to handle token expiry in long-running test sequences.
Okta On-premises Applications
Some companies prefer to host certain applications in-house, for security purposes. As on-premises applications may only be accessed from on-network, the previously mentioned Device configuration will need to be used in conjunction with the Private Monitoring Agent.
The Private Monitoring Agent needs to be deployed into your network, allowing you to extend the reach of the monitoring devices.
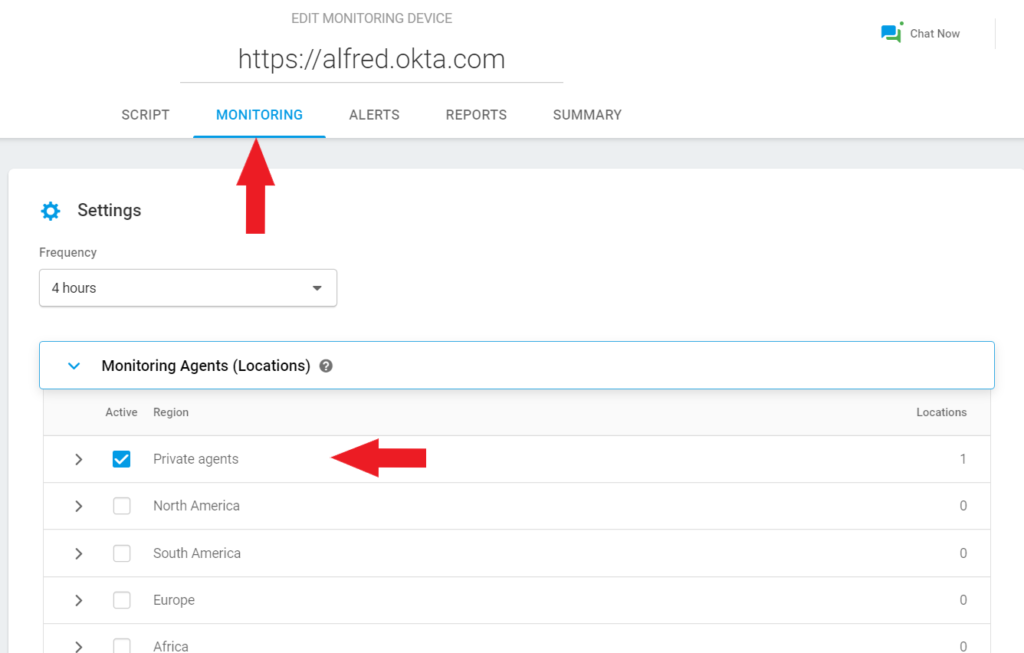
The configuration is similar (steps 1 through 7), however once the device has been created, you will need to edit the device settings and from under the Monitoring tab, select Private Agents from under the Monitoring Agents (Locations).
Observations
Please note that if you have DSSO enabled on your Okta tenant, the monitoring device cannot be set up. As such, Desktop SSO has to be configured to specific network zones. The Private Agent also allows you to monitor applications hosted behind VPNs, so long as the web application is available from the computer you want to install Private Agent on.
This same private-agent approach is essential for enterprise SaaS platforms like ServiceNow — our guide to synthetic monitoring for enterprise SaaS platforms like ServiceNow explains how to apply it to custom portal journeys and business rule validation.
Conclusion
To wrap it all up, implementing Dotcom-Monitor solutions with Okta is a strategy worth considering, both from a security standpoint, as well from a financial one. The platform is straightforward, the reporting is very flexible and configurable, and doing so will bring clear, measurable benefits to your business. Proactively monitor the performance and availability of your Okta tenant, web applications, and on-premises agent services with Dotcom-Monitor. Try the full platform for free.
