Reviewed by Dotcom-Monitor performance engineers · All competitor data verified against vendor pricing pages on the publication date.

At a glance — the short answer
If you need depth in synthetic and API monitoring: Dotcom-Monitor is the closest like-for-like upgrade from Pingdom, with multi-step API workflows, scripted user journeys in real browsers, and predictable subscription pricing.
If you want a free option for personal projects: UptimeRobot (50 monitors, 5-minute intervals — personal use only as of October 2024) or StatusCake (10 monitors with SSL, DNS, and domain checks included).
If you need full-stack observability: Datadog for the broadest integration footprint, or New Relic for its perpetual 100 GB free tier and capable synthetics.
If you want monitoring + incident management + logs in one tool: Better Stack — particularly suited to startups and growing teams.
SolarWinds Pingdom — widely known simply as Pingdom, following its $103M acquisition by SolarWinds in 2014 — has been a fixture in website monitoring for more than a decade. It covers the fundamentals well: uptime tracking, page speed testing, transaction monitoring, and Real User Monitoring (RUM) on higher-tier plans. For teams with straightforward needs, it remains a capable tool.
But it is not the right fit for everyone. Some teams outgrow it as their infrastructure scales. Others find the pricing model difficult to predict, or want more flexibility in how monitoring checks are configured. Many prefer platforms that bundle alerting, incident workflows, logs, and APM alongside monitoring — though it’s worth noting that “full-stack observability” is more than a bundle. It depends on consistent instrumentation across metrics, logs, and traces, with the context propagation that lets engineers debug unknown failure modes, not just detect known ones.
This guide covers the best Pingdom alternatives in 2026, with comprehensive coverage of each tool’s full feature set — not just one dimension of what they do. Whether you need simple uptime checks, advanced synthetic monitoring, full-stack observability, or something in between, there is a tool here that fits.
How we evaluated these Pingdom alternatives
Every tool in this list was assessed against the same nine criteria. Numbers were verified directly against each vendor’s pricing page, documentation, and product announcements as of May 2026.
Uptime monitoring
Check types supported, intervals, global monitoring locations.
Synthetic monitoring
Transaction testing, scripting capabilities, real-browser simulation.
Real User Monitoring
Visibility into actual user sessions and front-end performance.
API monitoring
Endpoint testing, response validation, multi-step workflows.
Alerting
Channels supported, on-call routing, escalation policies.
Integrations
DevOps, incident management, and communication tool coverage.
Reporting
Trends, SLA tracking, historical retention.
Pricing
Plan structure, cost drivers, scalability of cost.
Ease of use
Setup complexity, UI quality, learning curve.
Pingdom alternatives at a glance
| Tool | Uptime | Synthetic | RUM | API depth | Logs | Pricing | Best for |
|---|---|---|---|---|---|---|---|
| Dotcom-MonitorTop pick | Yes | Yes (deep) | No | Yes (deep) | No | Subscription | Synthetic & API depth |
| UptimeRobot | Yes | No | No | Basic | No | Free + tiered | Budget uptime |
| Datadog | Yes | Yes | Yes | Yes | Yes | Usage-based | Full-stack observability |
| New Relic | Yes | Yes | Yes | Yes | Yes | Usage + free tier | APM + telemetry |
| StatusCake | Yes | Limited | No | Basic | No | Free + tiered | SSL/DNS + uptime |
| Uptrends | Yes | Yes | Yes | Yes | No | Tiered | Synthetic + RUM balance |
| Better Stack | Yes | Basic | Yes | Basic | Yes | Subscription + free | Uptime + incidents + logs |
Verified May 2026 against each vendor’s pricing and product pages. “Deep” indicates multi-step, scripted, or assertion-based workflows; “Basic” indicates status-code or single-request checks.
1 Dotcom-Monitor
★ Editor’s choice for synthetic & API monitoring
Dotcom-Monitor is a dedicated monitoring platform built around synthetic testing and performance validation. Where many tools start with infrastructure observability and add monitoring as a feature, Dotcom-Monitor was built from the ground up for external monitoring — running controlled, repeatable synthetic checks from outside your infrastructure to validate availability and performance for specific user journeys in web applications and API workflows.
Uptime & availability monitoring
Dotcom-Monitor supports HTTP/HTTPS, DNS, FTP, SFTP/FTPS, SMTP, POP3/IMAP, TCP/UDP, SIP, Media Stream, DNSBL, Trace Route, and PING checks. Tests run from a global network of monitoring locations, giving teams visibility into availability across regions. You can configure alert thresholds, set maintenance windows, and receive notifications when services go offline or degrade below defined benchmarks.
Synthetic monitoring
This is where Dotcom-Monitor is strongest. Synthetic monitoring goes well beyond simple uptime checks: teams can script multi-step user journeys that simulate real interactions with web applications — form submissions, login flows, checkout processes, navigation paths — using automated Chromium-based browser sessions that execute JavaScript, render pages, capture screenshots, and measure step timings more realistically than HTTP checks alone.
This level of detail catches failures that basic HTTP checks miss — client-side rendering issues, broken interactions, or workflows that fail only in a specific region — by combining explicit steps and assertions (clicks, DOM checks, JS error detection, expected navigation or XHR outcomes) in every test. A page that loads but renders broken, or a workflow that fails only in production, gets caught where a basic HTTP check would show a clean 200.
API monitoring
Dotcom-Monitor supports multi-step API workflows, including dynamic authentication handling (session tokens, OAuth flows), request chaining, response body validation, schema checks, and variable passing between requests. This makes it capable of testing not just whether an endpoint responds, but whether it returns the correct data and behaves correctly as part of a larger workflow. For teams running production APIs, this depth is typically the deciding factor over lighter-weight tools.
Real User Monitoring (RUM)
Dotcom-Monitor does not currently offer RUM. If visibility into real user sessions and front-end performance in production is a requirement, supplement with a dedicated RUM tool. For most teams, dedicated synthetic depth plus a separate, focused RUM tool is a more reliable signal than a single platform that tries to do both adequately.
Alerting, reporting & integrations
Alerts are delivered via email, SMS, phone calls, PagerDuty, Slack, OpsGenie, xMatters, and webhooks. Escalation logic ensures the right people are notified based on severity and response time. SLA reporting and uptime dashboards provide historical visibility, and reports can be shared with stakeholders against defined SLA targets.
Pricing
Dotcom-Monitor uses a subscription model with pricing tied to the products selected (web performance, API monitoring, load testing) and the frequency and volume of checks. Pricing is meaningfully more predictable than usage-based observability platforms but requires planning as check frequency and monitor counts increase. There’s no free plan, but a 30-day trial is available.
Ease of use
Setup is straightforward for basic checks. Scripted synthetic tests and multi-step API workflows have a moderate learning curve — teams without prior experience in synthetic scripting may need a day or two of hands-on time to build complex flows comfortably.
Where Dotcom-Monitor falls short
- No Real User Monitoring
- Fewer integrations than full observability platforms
- No log management or infrastructure monitoring
- Not suited for teams that want a single platform spanning infrastructure, APM, and monitoring
Summary: Dotcom-Monitor is a strong choice for teams that need deep synthetic and API monitoring in a dedicated tool. It is particularly well suited to QA teams, performance-focused engineers, and organizations with complex user workflows or API dependencies. For teams that also need infrastructure visibility, log management, or APM, it works best alongside other tools.
2 UptimeRobot
UptimeRobot has built its reputation on doing one thing simply and well: telling you when your website or service goes down. It’s one of the most widely-used uptime tools in the world because it removes the friction of getting started — the free plan is genuinely useful, not a teaser.
Uptime & availability monitoring
UptimeRobot supports HTTP(S), keyword, ping, port, and heartbeat monitors. The keyword monitor is particularly useful for detecting pages that load but display an error, or content that disappears unexpectedly. The free plan includes 50 monitors at 5-minute intervals; paid plans drop intervals to as low as 30 seconds and expand monitor counts.
Important caveat: Since October 2024, UptimeRobot’s free plan is restricted to personal, non-commercial use under their terms of service. For business or revenue-generating monitoring, a paid plan is required.
Synthetic, RUM, and API monitoring
UptimeRobot does not offer synthetic transaction monitoring or RUM. API monitoring is limited to sending HTTP requests and checking for a successful response code — sufficient for “is the endpoint up” but not for validating that an API returns correct data or completes a multi-step workflow.
Alerting and pricing
The free plan supports email alerts only. Paid plans add SMS, voice calls, push notifications, Slack, PagerDuty, Zapier, and webhooks. Paid tiers (Solo, Team, Enterprise) scale by monitor count and check interval, with transparent pricing.
Where UptimeRobot falls short
- No synthetic monitoring or user journey simulation
- No RUM
- API monitoring covers availability only — not correctness, auth flows, or workflow semantics
- No log management or infrastructure visibility
- Free plan is personal-use only — not permitted for commercial monitoring
- SMS alerting is paid-only
Summary: Excellent within its scope. If you need to know when a personal site or side project goes down at the lowest possible cost, hard to beat. The limitations matter for any team running production applications with real user expectations, API dependencies, or reliability commitments — and the commercial-use restriction on the free tier increasingly pushes serious teams to a paid plan or a different tool.
3 Datadog
Datadog is one of the most comprehensive monitoring and observability platforms available. It is not just a monitoring tool — it is a full observability platform that brings infrastructure metrics, application performance, logs, synthetic tests, and real user data together in a single unified view. For teams managing complex, cloud-native systems, this breadth is its core value.
Synthetic and uptime monitoring
Datadog supports browser tests (script-recorded or manually coded), API tests with status / header / body / latency / SSL validation, and multistep API tests where variables can be extracted from one response and passed to the next. Synthetic tests can be triggered as part of CI/CD pipelines to catch regressions before they reach production.
Real User Monitoring (RUM)
Datadog RUM captures actual user sessions, including page load times, Core Web Vitals, JavaScript errors, user actions, and session replays. It can correlate frontend events with backend traces when both the RUM SDK and backend tracing are instrumented and trace context propagation is correctly configured across gateways and services. Correlation works well in environments with consistent end-to-end instrumentation, but may have gaps when requests pass through load balancers, CDNs, or third-party services that don’t preserve trace context — a common production reality.
Infrastructure, APM, logs, and integrations
Datadog’s infrastructure monitoring covers cloud providers, containers, Kubernetes, serverless, and databases. APM provides distributed tracing, service maps, and code-level profiling. Log management includes ingestion, parsing, search, alerting, and archiving. Logs can be correlated with traces and metrics for end-to-end incident investigation. Datadog surpassed 1,000 integrations in 2025, one of the broadest libraries in the monitoring space.
Pricing
Datadog uses a usage-based pricing model. Costs scale across multiple dimensions simultaneously — infrastructure hosts, log volume, APM spans, RUM sessions, synthetic test runs, and more. This makes it one of the most powerful platforms available, but also one of the most difficult to budget for. Teams that don’t carefully monitor their usage can see costs grow significantly as systems expand. Free tiers and promotional offerings change frequently — confirm the current availability of any free plan or developer tier on Datadog’s pricing page.
Where Datadog falls short
- Pricing can escalate quickly and unpredictably
- Significant setup and configuration effort required for full value
- Can feel like overkill for teams that only need uptime or synthetic monitoring
- Breadth of features can overwhelm new teams
Summary: Datadog is the right choice for teams that want a single platform covering infrastructure, applications, logs, users, and external testing. If your team is managing a complex cloud-native environment and needs deep correlation across every layer of your stack, Datadog delivers — at a cost and complexity that smaller teams may struggle to justify.
4 New Relic
New Relic is a well-established observability platform with a strong focus on application performance. Like Datadog, it covers APM, infrastructure, logs, browser monitoring, and synthetics — but it has historically been stronger in code-level application visibility and offers a more accessible entry point through its free tier.
Synthetic monitoring
New Relic Synthetics supports simple browser monitors, scripted browser monitors (multi-step interactions with custom assertions), API test monitors (status, headers, body content), step monitors (no-code browser transaction builder), certificate check monitors, and broken link scanning. The no-code step builder makes synthetic testing approachable without writing scripts.
Real User Monitoring and APM
New Relic Browser Monitoring captures real user performance data including page load times, Core Web Vitals, JavaScript errors, Ajax performance, and session traces — and connects to backend APM traces, letting teams follow a front-end issue back to a specific backend service or query. New Relic APM is one of its strongest features, instrumenting application code across Java, .NET, Python, Node.js, Ruby, PHP, and Go with distributed tracing, transaction traces, database query analysis, and code-level profiling.
Pricing
New Relic uses a usage-based model driven by data ingest volume and full-platform user count. The free tier offers 100 GB of data ingest per month and one full-platform user, with no time limit — one of the most generous entry points among full-stack observability platforms, and a meaningful differentiator for smaller teams.
Where New Relic falls short
- Full value requires application instrumentation and meaningful setup time
- Pricing can scale quickly at higher data volumes
- Can feel like more than needed for teams with simple monitoring requirements
Summary: A strong choice for engineering teams that want comprehensive observability with a free tier that actually lets you explore capabilities before committing. Particularly well suited to teams building on microservices or distributed architectures who need to trace issues across service boundaries.
5 StatusCake
StatusCake is often overlooked in favor of more prominent names, but it offers a solid range of monitoring types that go beyond simple uptime — making it more versatile than tools like UptimeRobot without the complexity of full observability platforms.
What StatusCake includes
StatusCake supports HTTP, TCP, DNS, and PING checks with customizable intervals and multi-location alerting. Notable additions other tools charge for or omit entirely: built-in SSL certificate monitoring with expiry alerts, domain expiry monitoring that warns before a registration lapses, DNS record change monitoring, and page speed tracking. StatusCake also offers lightweight malware/blacklist scanning — useful as a detection supplement, not a substitute for dedicated security tooling.
Free plan
StatusCake’s free plan includes 10 uptime monitors at 5-minute intervals, 1 page speed monitor, 1 domain monitor, and 1 SSL monitor — a more well-rounded free offering than many competitors. Free accounts deactivate after 90 days of inactivity. Paid plans (Indie, Business, Agency) add monitors, faster check intervals, and more advanced features.
Synthetic, RUM, and API monitoring
Synthetic transaction monitoring is limited compared to dedicated platforms — basic transaction checks are supported but it lacks the scripting depth, real-browser simulation, and multi-step workflow validation found in tools like Dotcom-Monitor or Uptrends. There’s no RUM. API monitoring is status-code-level only — fine for availability checks, not suitable for validating API correctness or workflows.
Where StatusCake falls short
- No RUM
- Limited synthetic transaction monitoring — not suitable for complex user journeys
- No log management or infrastructure monitoring
- API monitoring covers availability only — not suitable for production API workflow validation
Summary: A well-rounded tool for teams that want more than basic uptime without committing to a complex platform. SSL, DNS, domain expiry, and malware detection alongside uptime makes it particularly good value for website owners and small development teams. If your primary concern is keeping websites healthy rather than testing complex application workflows, it deserves serious consideration.
6 Uptrends
Uptrends is a dedicated monitoring platform built around synthetic testing, real browser monitoring, and real user monitoring. It sits in a useful middle ground: more capable than basic uptime tools, but more focused and approachable than full observability platforms like Datadog or New Relic.
Ownership context
Uptrends was acquired by ITRS Group in November 2020, where it continues to operate as a distinct product with its own interface and pricing. ITRS is a PE-backed monitoring software group (backed by TA Associates) focused on capital-markets observability and IT performance. Relevant for buyers weighing long-term vendor strategy, though the day-to-day product experience has remained stable.
Synthetic monitoring
Uptrends’ synthetic monitoring is comprehensive: full-page checks with waterfall charts, multi-step transaction monitoring scripted for login flows / search-and-filter / form submissions / checkout, real browser testing in Chromium and Firefox, and both a no-code recorder and a JavaScript scripting interface for complex interactions.
RUM and API monitoring
Uptrends RUM captures real user performance data — page load, Core Web Vitals, geographic and device breakdowns, user journey tracking — sitting alongside synthetic data in the same platform. API monitoring supports endpoint testing with response validation, multi-step request sequences, and variable handling.
Pricing
Uptrends operates on a tiered subscription model where pricing scales with the number of monitors, check frequency, and features enabled. Costs can rise significantly as monitoring scope grows — particularly when adding RUM data collection or high-frequency synthetic tests from many global locations. Free trial available, no permanent free plan.
Where Uptrends falls short
- No log management or infrastructure monitoring
- Pricing scales quickly with volume
- Not suitable for teams that also need APM or infrastructure observability in the same platform
Summary: One of the stronger dedicated synthetic monitoring platforms in this list. The combination of a large global monitoring network, real browser transaction testing, and RUM in a single product makes it versatile for performance-focused teams that don’t need full observability.
7 Better Stack
Better Stack — the unified platform formed from the merger of Better Uptime (uptime monitoring) and Logtail (log management) — takes a different approach to monitoring than most tools in this list. Rather than focusing on depth in any single monitoring type, it combines uptime monitoring, on-call incident management, real user monitoring, and log management into a clean, unified platform designed to minimize tool sprawl.
Uptime and synthetic monitoring
Better Stack supports HTTP, TCP, ping, DNS, SMTP, and POP3 checks. Setup is one of the fastest in the category — basic monitors can be running in under a minute. Synthetic capabilities have grown: Better Stack now offers Playwright-based browser checks that can run multi-step user journeys with full JavaScript execution. The synthetic product is still less mature than dedicated platforms like Dotcom-Monitor or Uptrends, but is capable enough for many common workflows.
Real User Monitoring
Better Stack offers a full RUM product with session replay (with rage-click detection and 2× playback), Core Web Vitals tracking per URL with alerting, and frontend-to-backend correlation that links RUM sessions to backend logs and traces. This is a relatively recent addition that meaningfully expands what Better Stack covers compared to earlier reviews.
Incident management — the standout
This is where Better Stack genuinely differentiates itself: on-call schedules and rotations with automatic escalation, alert routing by triggering monitor, auto-generated incident timelines, and built-in public status pages that update automatically with incident status. For teams that currently manage monitoring in one tool and incident response in another (such as PagerDuty), Better Stack offers a compelling consolidation.
Log management
Better Stack includes log management (the product previously sold as Logtail) in the same platform. Teams can ingest logs from applications, infrastructure, and services, then search, tail, and alert on them alongside uptime data — a meaningful differentiator most dedicated uptime tools don’t include.
Pricing
Better Stack uses a subscription model with pricing driven by monitors and team members. A genuinely useful free plan covers basic monitoring (10 monitors, 5,000 session replays/month, 100,000 exceptions/month, a status page, and incident management).
Where Better Stack falls short
- Synthetic monitoring is still less mature than dedicated synthetic platforms
- API monitoring is shallower than dedicated tools (status code + basic content validation; not multi-step API workflows)
- APM is limited compared to Datadog / New Relic
- Newer platform than established players — some enterprise features still maturing
Summary: Better Stack earns its place not through depth in any one monitoring type but through smart integration of uptime, on-call, RUM, and log management in a well-designed platform. For startups and growing teams that want to reduce tool sprawl and get incident response right from the start, it is one of the most practical options. Teams with complex synthetic monitoring or APM needs will still need to look elsewhere.
Other notable Pingdom alternatives
Depending on your environment and requirements, these tools are also worth considering:
- Catchpoint — Enterprise-grade monitoring with a focus on internet performance, last-mile visibility, and CDN/DNS monitoring. Strong choice when network-level performance is critical.
- Grafana Cloud — Strong for teams already using Grafana and Prometheus. Combines metrics, logs, and traces with built-in synthetic monitoring via Grafana k6.
- Checkly — Developer-focused, code-first synthetic monitoring in JavaScript/TypeScript with native Playwright support. Excellent for engineering teams that version-control their monitoring alongside application code.
- Prometheus + Blackbox Exporter — Open-source combination for teams that want full control over their monitoring infrastructure. Powerful and flexible, but requires significant setup and ongoing maintenance.
- Site24x7 — All-in-one monitoring covering websites, servers, applications, and networks. Broad toolset at an accessible price point, particularly for managed service providers.
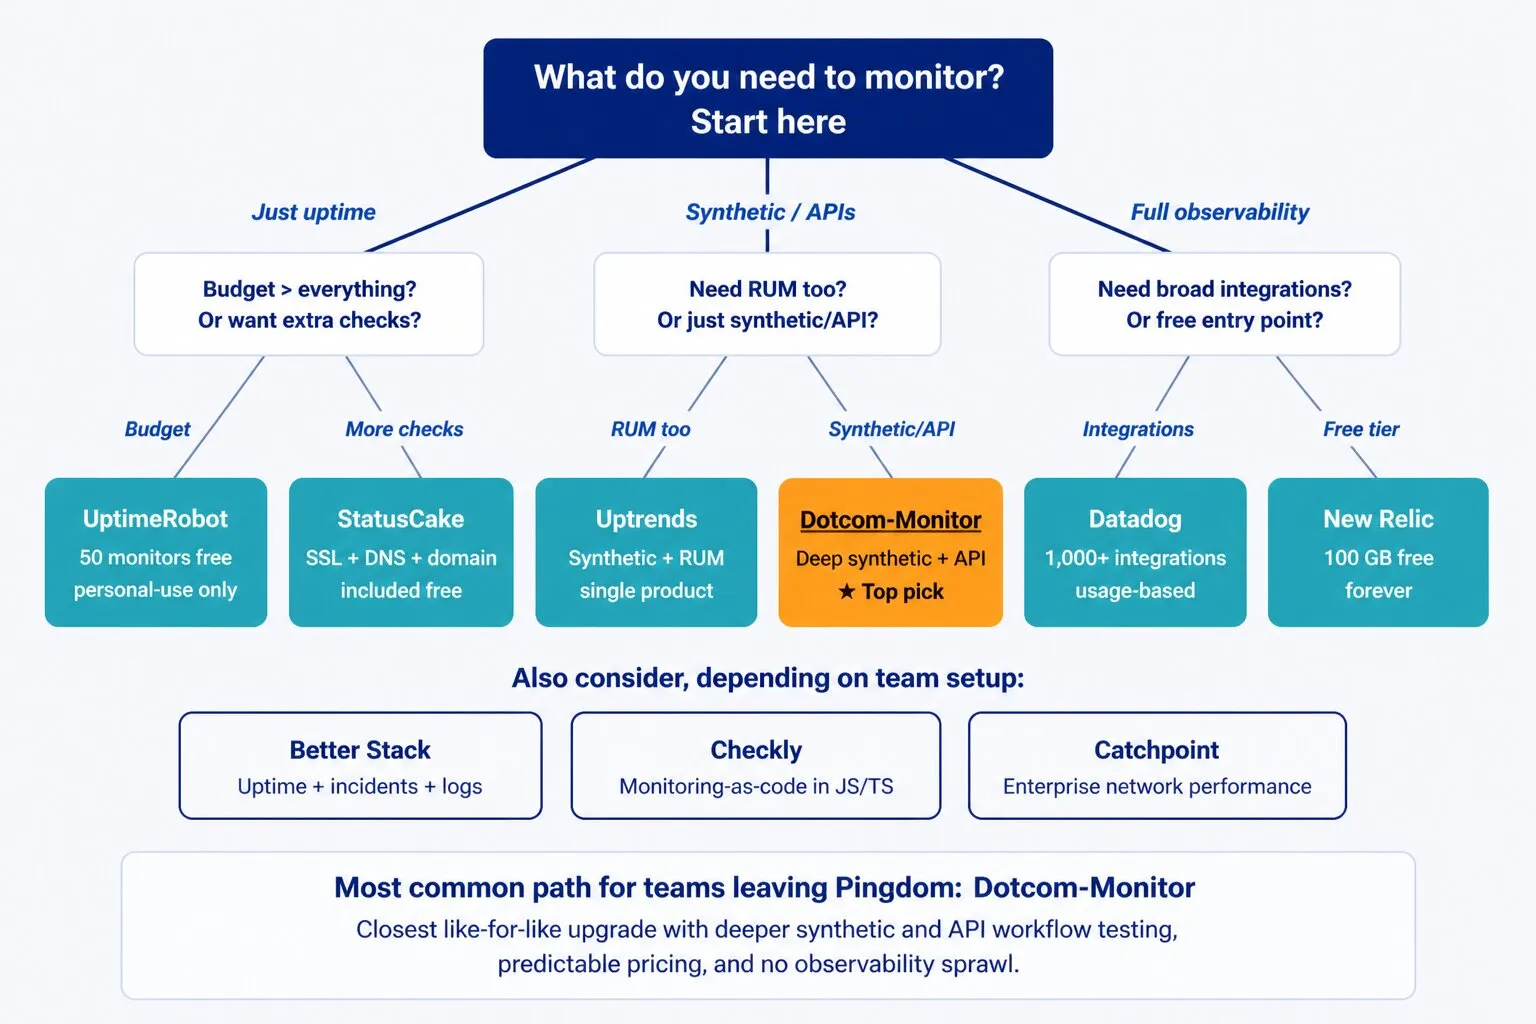
How to choose the right Pingdom alternative
The right monitoring tool depends on three things: what you need to monitor, how much complexity your team can manage, and what your budget allows. The decision tree below maps the most common cases to a recommended starting point.
Key questions to ask before deciding
- Do you need to monitor just availability, or also behavior and performance?
- Does your team have the resources to configure and maintain a complex platform?
- Are you monitoring primarily from outside (synthetic) or also from inside the application (APM)?
- Do you need RUM to understand what real users are experiencing?
- How predictable does your monitoring cost need to be?
Monitoring is ultimately about reducing the time between when something breaks and when your team knows about it. The best tool is the one your team will actually use and act on — not the most feature-rich one that sits misconfigured.
Ready to move beyond Pingdom?
Dotcom-Monitor gives you the deepest synthetic and API monitoring in a dedicated platform — with predictable pricing and no observability sprawl. Try it free for 30 days, no credit card required.
