 Traditional monitoring solutions provide valuable infrastructure metrics, they fundamentally lack the capability to understand what users actually experience. There is a significant technical gap between server-side metrics and client-side experience. Research shows that traditional monitoring fails to detect 52–68% of user-facing errors since they happen outside of the server infrastructure.
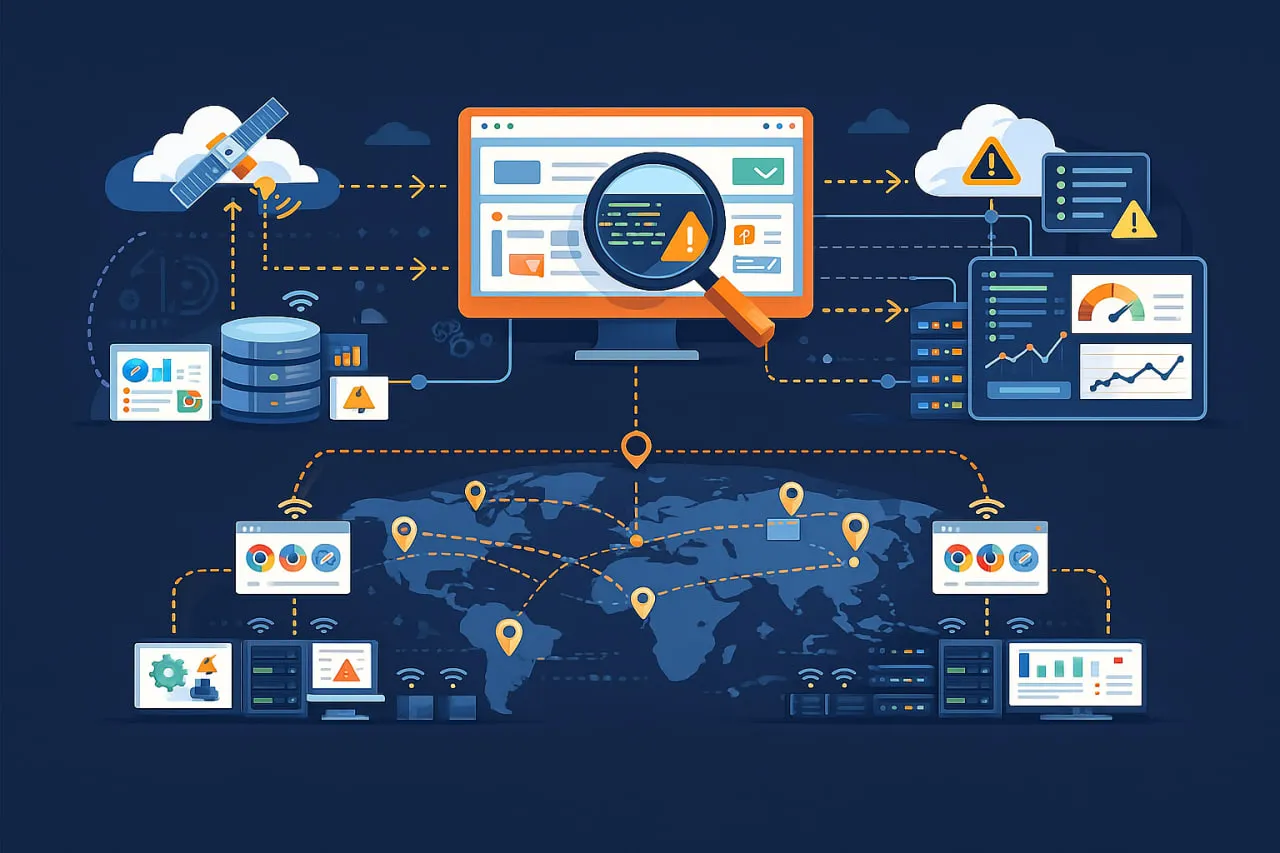
Synthetic end-user monitoring bridges this gap through systematic simulation of real user behavior. Reactive monitoring approaches that wait for problems to manifest, synthetic monitoring proactively validates user journeys by executing predefined scripts globally using real browsers, providing consistent, repeatable measurements of the complete user experience.
Technical Architecture of Synthetic End User Monitoring Systems
The technical architecture of a synthetic end-user monitoring (EUM) system consists of several key components designed to proactively simulate user interactions, gather performance data, and notify IT teams about potential issues.
Core System Components
For the conceptual foundation before the architecture detail, our pillar guide on what is synthetic monitoring explains how these scripts fit within the broader monitoring taxonomy. A synthetic EUM system includes the following key architectural components:
Script Execution Engine
These are automated instruction sequences that replicate specific user actions or interactions within an application, such as logging in, searching for a product, adding items to a cart, making an API call, or performing a simple ping. They can range from basic HTTP checks to complex, full browser-based transactions.
Test Node Infrastructure
The distributed network of execution environments positioned strategically across global locations. These nodes consist of:
- Physical or virtual machines with controlled browser environments
- Geographic distribution matching user population concentrations
- Network diversity, including different ISPs and connection types
- Hardware consistency ensuring comparable execution environments
Monitoring Scheduler
The analyzed data is displayed on customizable dashboards, providing a comprehensive view of system health. If performance metrics drop below predefined thresholds or service level objectives (SLOs), the system automatically generates alerts to inform the relevant IT teams.
Data Collection and Processing Pipeline
This centralized platform collects performance metrics such as response times, page load times, error rates, and uptime from monitoring agents. It then analyzes the data to establish performance baselines and detect any deviations or anomalies.
How the Architecture Works
Effective synthetic monitoring requires careful network architecture planning:
- Configuration: Test parameters are defined, including the scripts to execute, testing frequency, and the geographical locations and device types to be simulated.
- Script Creation: Developers or QA engineers create scripts for the sequence of user interactions to be simulated.
- Execution: Monitoring agents execute the predefined scripts according to the schedule from specified geographic locations.
- Data Transmission: Monitoring agents gather performance data and transmit it to a centralized collection and analysis system.
- Analysis and Notification: The centralized system evaluates the collected data against established baselines and thresholds. When issues are detected, it sends alerts, enabling teams to proactively address problems before they affect real users.
- Optimization: Using the insights gathered, the system can be refined and re-tested to ensure it meets performance requirements.
This technical architecture provides a consistent, repeatable, and proactive approach to monitoring application performance and availability, making it especially valuable for complex, distributed systems that depend on multiple third-party APIs and services.
Technical Implementation Patterns for Complex User Journeys
Journey Scripting Architecture
Effective user journey scripting follows a layered architecture pattern:
Base Layer: Core Navigation Functions
The foundation layer handles basic browser interactions:
- Page navigation and URL management
- Element location and interaction
- Form filling and submission
- Cookie and session management
Middle Layer: Business Logic Implementation
This layer implements application-specific workflows:
- User authentication flows
- Shopping cart interactions
- Search and filtering operations
- Checkout and payment processing
Top Layer: Validation and Assertion Framework
The verification layer ensures correct functionality:
- Performance threshold validation
- Visual regression detection
- Content accuracy verification
- Business rule compliance
For a more accessible starting point before implementing these patterns, our synthetic transaction monitoring guide explains the five core components and how each fits into a working monitoring setup.
Advanced Scripting Techniques
Dynamic Element Handling Strategies
Modern web applications present unique challenges for automation:
Intelligent Waiting Mechanisms
- DOM content loaded detection
- Network idle state monitoring
- Custom element visibility checking
- AJAX request completion waiting
State Management Patterns
- Session persistence across page navigation
- Local storage and cookie management
- Application state validation
- Multi-tab and window coordination
Error Recovery and Resilience
- Automatic retry mechanisms for transient failures
- Alternative element location strategies
- Graceful degradation handling
- Comprehensive error logging
Multi-Session Journey Testing
Complex user experiences often span multiple sessions:
- Session token management for continuity testing
- Cross-device journey simulation (desktop to mobile transitions)
- Time-delayed continuation testing
- State persistence validation across sessions
Conditional Workflow Execution
Real user journeys often involve decision points:
- A/B testing variant detection and appropriate path selection
- Geographic content adaptation based on location
- User role-based journey variation (admin vs. regular user)
- Feature flag awareness in testing scripts
Performance Measurement Framework
Timing Metrics Collection
Comprehensive performance measurement includes:
1. Navigation Timing API Metrics
- DNS resolution time
- TCP connection establishment
- SSL/TLS negotiation duration
- Time to First Byte (TTFB)
- Content download time
2. Resource Timing Data
- Individual asset loading times
- Third-party script performance
- CDN effectiveness measurement
- Cache efficiency analysis
3. User-Centric Performance Metrics
- Largest Contentful Paint (LCP)
- First Input Delay (FID)
- Cumulative Layout Shift (CLS)
- Time to Interactive (TTI)
Visual Performance Analysis
Beyond timing metrics, visual performance assessment includes:
- Screenshot comparison for visual regression detection
- Above-the-fold content loading analysis
- Progressive rendering validation
- Animation smoothness measurement
Ready to proactively monitor your user journeys?
Explore our comprehensive Synthetic Monitoring Solutions to simulate real user interactions and detect issues before they impact your customers.
Learn more about Synthetic Monitoring
Global Testing Infrastructure Design
Geographic Distribution Strategy
Dotcom-Monitor’s synthetic monitoring platform supports 30+ global probe locations with network-type filtering — visit the platform page to explore location coverage.
Tiered Location Architecture
TIER 1: CRITICAL LOCATIONS (Every 1-2 minutes)
- Primary business regions
- Major user population centers
- Strategic market locations
TIER 2: IMPORTANT LOCATIONS (Every 5-10 minutes)
- Secondary markets
- Emerging business regions
- Competitive comparison locations
TIER 3: EXTENDED COVERAGE (Every 15-30 minutes)
- Tertiary markets
- Regulatory compliance locations
- Disaster recovery validation
For detailed guidance on choosing regions, network types, and alert thresholds, our dedicated guide on synthetic monitoring from multiple locations covers each decision point in depth.
Network Diversity Implementation
Effective global testing requires network diversity:
- Multiple ISP connections per geographic region
- Different network types (fiber, cable, DSL, mobile)
- Varied bandwidth profiles to simulate real user conditions
- Carrier-specific testing for mobile applications
Test Execution Optimization
Parallel Execution Strategies
- Geographic parallelization: Simultaneous execution across locations
- Journey parallelization: Multiple user journeys executed concurrently
- Browser parallelization: Cross-browser testing in parallel
- Device parallelization: Multiple device types tested simultaneously
Resource Management Techniques
- Dynamic node allocation based on test requirements
- Intelligent load balancing across available resources
- Predictive scaling based on scheduled test patterns
- Resource pooling for efficient utilization
Data Collection and Aggregation
Distributed Data Architecture
| EDGE NODES | → | REGIONAL AGGREGATORS | → | CENTRAL PROCESSING |
|---|---|---|---|---|
| ↓ | ↓ | ↓ | ||
| Local metrics | Regional trends | Global analytics | ||
| Real-time data | Cross-location | Historical analysis | ||
| Correlation | ||||
Real-time Processing Pipeline
- Stream ingestion from global test nodes
- Immediate anomaly detection and alerting
- Real-time dashboard updates
- Live performance trend analysis
Advanced Technical Capabilities
AI and Machine Learning Integration
Predictive Analytics
- Anomaly pattern recognition using historical data
- Performance trend forecasting
- Automated root cause analysis
- Intelligent alert threshold adjustment
Automated Journey Discovery
- User behavior pattern analysis to identify common journeys
- Automatic script generation from observed patterns
- Journey optimization suggestions based on performance data
- Continuous journey refinement through machine learning
Security and Compliance Testing
Vulnerability Detection
- Cross-site scripting (XSS) vulnerability testing
- Injection attack simulation
- Authentication security validation
- Data protection compliance testing
Regulatory Compliance Validation
- GDPR compliance testing for European users
- CCPA validation for California residents
- Accessibility compliance (WCAG) testing
- Industry-specific regulation validation
Third-Party Dependency Monitoring
External Service Integration Testing
- API dependency validation and performance monitoring
- CDN effectiveness measurement
- Third-party script impact analysis
- External service failure simulation and graceful degradation testing
Integration Point Monitoring
- Payment gateway integration validation
- Social media platform connectivity testing
- Analytics and tracking script performance monitoring
- Advertising network integration testing
These same advanced capabilities extend to native mobile apps — our guide on mobile app synthetic monitoring covers how to apply this architecture to iOS and Android user journeys across device models and OS versions.
Want to dive deeper into selecting the right tools?
Discover our curated list of the Best Synthetic Monitoring Solutions and see how they compare. Read our expert guide
Integration with Development and Operations Workflows
CI/CD Pipeline Integration
Pre-Deployment Validation
- Performance regression testing before production deployment
- Functional regression detection in staging environments
- Load impact assessment of new features
- Cross-browser compatibility validation
Post-Deployment Verification
- Immediate production validation after deployment
- Canary deployment monitoring
- Feature flag performance assessment
- A/B testing result validation
Incident Management Integration
Alert Routing and Escalation
- Integration with incident management platforms (PagerDuty, Opsgenie)
- Automatic ticket creation in ITSM systems
- On-call schedule integration for immediate notification
- Escalation policy enforcement based on severity
Diagnostic Data Enrichment
- Automatic screenshot capture during failures
- Network waterfall diagram generation
- Console log collection for JavaScript errors
- Performance metric correlation with infrastructure data
Business Intelligence Integration
Performance to Business Metric Correlation
- User journey performance correlation with conversion rates
- Page load time impact on bounce rate analysis
- Geographic performance correlation with regional revenue
- Device performance impact on user engagement
Executive Reporting
- Automated performance scorecard generation
- Competitive benchmark reporting
- ROI analysis of performance improvements
- Trend analysis and forecasting reports
Scalability and Performance Considerations
System Architecture Scalability
Horizontal Scaling Strategies
- Distributed test node architecture for geographic expansion
- Load-balanced processing clusters for data aggregation
- Sharded database architecture for metric storage
- Microservices-based architecture for component independence
Performance Optimization Techniques
- Edge computing implementation for low-latency testing
- Content delivery optimization for test assets
- Database query optimization for fast analytics
- Caching strategy implementation for frequently accessed data
Cost Management Strategies
Infrastructure Optimization
- Spot instance utilization for cost-effective cloud resources
- Reserved instance planning for predictable workloads
- Automatic scaling policies to match demand patterns
- Resource pooling strategies for efficient utilization
Monitoring Efficiency Improvements
- Intelligent test scheduling to avoid unnecessary execution
- Dynamic frequency adjustment based on business hours
- Selective monitoring based on application importance
- Automated optimization suggestions for test configurations
Conclusion: Building a Technical Foundation for User Experience Excellence
Synthetic end-user monitoring is a critical capability for modern digital organizations. With a comprehensive synthetic monitoring strategy, organizations can see what their users are really experiencing in a way that has never been possible before. Synthetic monitoring detect issues before they occur, enhance performance in a meaningful way, and make decisions based on data.
The technical implementation of synthetic monitoring requires careful planning across several dimensions:
- Designing architecture which is scalable and reliable
- Global infrastructure deployment for comprehensive coverage
- Advanced scripting for realistic simulation
- Integration strategy for ecosystem connectivity
- Measurement framework for continuous improvement
Organizations that successfully implement synthetic end user monitoring achieve significant technical and business benefits, including faster issue detection, improved user satisfaction, reduced operational costs, and enhanced competitive positioning.
Ready to see synthetic monitoring in action?
Start your free trial today and experience proactive monitoring with real browser simulations from global locations.
Frequently Asked Questions
Synthetic monitoring platforms use intelligent detection systems for SPAs, including:
- JavaScript execution tracking to monitor dynamic content loading
- Mutation Observer API to detect DOM changes in real-time
- Network request monitoring for API-driven content update
- Client-side routing validation for frameworks like React and Vue
- Intelligent waiting mechanisms for AJAX calls and dynamic elements
Advanced platforms support framework-specific integration with React DevTools, Angular Zone.js, and Vue DevTools protocols for component-level monitoring and state tracking.
Global deployment requires:
- Distributed test nodes in multiple geographic regions (minimum 8-12 locations)
- Multi-ISP connectivity per location for network diversity
- Real browser environments with latest Chrome, Firefox, and Safari versions
- Minimum 2 vCPU, 4GB RAM per test node
- 100Mbps+ bandwidth with low-latency connections
- Enterprise-grade security including VPN tunnels and encrypted data storage
- Time-series database capable of handling millions of metrics per minute
- Real-time processing pipeline for immediate alert generation
Yes, advanced synthetic monitoring systems provide comprehensive third-party dependency tracking:
- External API performance monitoring with detailed waterfall analysis
- CDN asset delivery validation from multiple geographic points
- JavaScript error detection in third-party scripts
- Load time impact measurement of external dependencies
- Graceful degradation testing when third-party services fail
- Payment gateway integration validation during checkout flows
- Social media and analytics script performance tracking
- Automatic alerting when third-party SLAs are violated
Platforms can simulate third-party service failures to test fallback mechanisms and measure the impact on conversion rates and user experience.
