
A site owner usually finds out their site is down the same way customers do: through a support email, a chargeback notice, or a checkout drop that shows up in the analytics dashboard the next morning. By that point the incident is hours old and the revenue is gone.
Website availability monitoring is the practice of catching outages before that happens. But “is the site up” turns out to be a harder question than it looks. A site can return a 200 OK while the checkout button is broken. A site can be reachable from the U.S. and dead in Europe. A site can be technically online and still failing for users because the DNS provider is timing out or the SSL certificate expired at 2 a.m.
This guide covers the operational side of website availability monitoring: what to check, where to check from, how often, and what to do when an alert fires. It is written for owners who run their own site, not for SRE teams with a dedicated dashboard wall. The goal is to set up monitoring you can trust, then ignore until it pages you.
What “Available” Actually Means
There is a gap between “the server responded” and “a user could buy something.” Availability monitoring lives in that gap.
A bare uptime monitoring check pings your URL and looks for a 200 status code. That is the floor. It catches catastrophic failures (server down, DNS broken, network unreachable) and misses everything subtler: a payment processor that 500s on checkout, a CDN config that serves a blank page, a JavaScript error that breaks the login button on Safari.
Real availability monitoring layers checks on top of each other so that “the site is up” means a real user, in a real browser, in a real location, can do what they came to do. The Dotcom-Monitor glossary has a fuller definition of website availability if you want the formal version.
A common real outage pattern: a Friday-evening deploy ships a new analytics tag. The HTML still returns 200 OK from every region, so a basic uptime tool reports green all weekend. On Monday morning, support is buried in tickets because the third-party tag blocks the checkout form’s submit handler in Safari. A real-browser check on the checkout page would have caught the failure inside one polling interval. A bare HTTP check could not.
Why Availability Monitoring Matters
The cost of downtime varies wildly depending on the business, but the categories of damage are consistent: lost transactions, broken SLAs, harmed brand reputation, and search ranking penalties from crawlers hitting error pages during prolonged outage, and the internal cost of all-hands incident response.
For e-commerce sites, even a few minutes of downtime during peak traffic can mean thousands of dollars in lost orders. For SaaS providers, a single sustained outage can trigger SLA credits and erode the customer trust that took years to build. For media and publishing sites, downtime during a breaking news cycle is traffic that simply never comes back.
Availability monitoring shrinks the window between something going wrong and someone fixing it. That mean-time-to-detection (MTTD) is often the single biggest lever for reducing the total impact of an incident.
How Availability Monitoring Works
Most availability monitoring relies on synthetic checks: automated requests sent from monitoring nodes distributed around the world. These checks run at regular intervals — anywhere from every few seconds to every few minutes — and record whether the target responded correctly within an acceptable time.
A typical check involves a monitoring agent in a specific geographic location sending an HTTP request to your URL, then evaluating the response against a set of rules. Did it return a 2xx status code, or did it trigger a critical server error? Did the response time stay under the threshold? Did the page contain the expected content? Did all the resources on the page load successfully?
When a check fails, the monitoring system doesn’t usually fire an alert immediately. Instead, it typically retries from the same node and, just as importantly, from different nodes. This filters out transient network blips and localized issues at the monitoring node itself, which would otherwise generate constant false alarms. Only when failures are confirmed across multiple locations does the system escalate to an alert.
How to Monitor Website Uptime: The Five Checks Every Site Needs
The standard advice is to “monitor uptime.” That misses most of the failure surface. Below are the five check types that catch the outages site owners actually see in production.
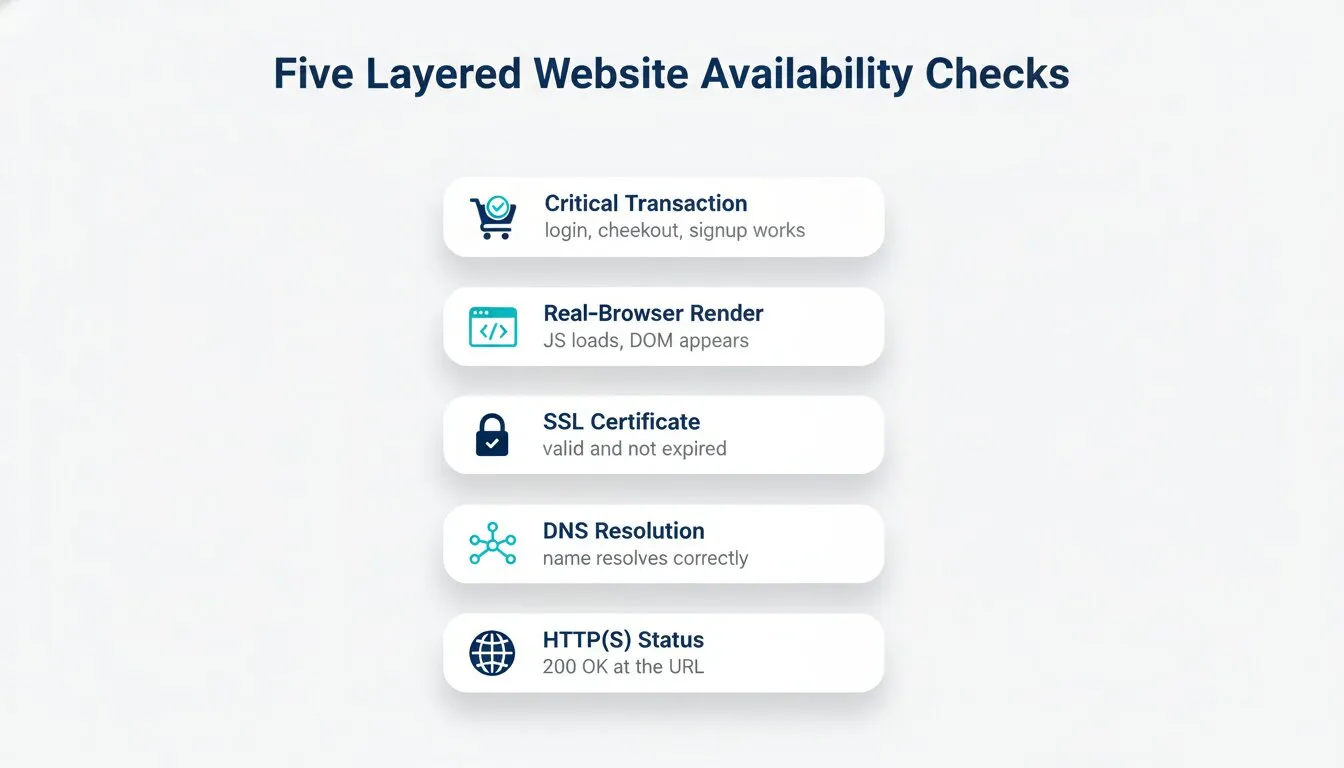
1. HTTP(S) Status Check
The basic check. Hit a URL, expect a 2xx response, alert on anything else. Set it up for the homepage, the pricing page, the checkout page, and any landing pages tied to paid traffic. This catches hard outages and SSL handshake failures.
Run it from multiple locations. A check from a single U.S. data center will report “up” while customers in Sydney are looking at a CloudFront error.
2. DNS Resolution Check
A site that cannot be resolved is a site that does not exist, even if the server is healthy. DNS issues usually trace back to provider outages (Route 53 has had a few notable ones), expired domains, or propagation problems after a record change.
A DNS monitoring check resolves your domain against several public resolvers and alerts when the answer changes unexpectedly or the lookup fails entirely.
3. SSL Certificate Validity
Certificates expire. They get revoked. They get misconfigured during a Let’s Encrypt renewal that quietly failed. A visitor who hits an expired-cert warning is gone. They do not click through “Advanced > Proceed anyway.”
SSL certificate monitoring checks the cert chain, expiry date, and revocation status. Set the expiry alert to fire 30 days out, then 14, then 7. You want time to rotate the cert without an incident page.
4. Full-Page Real-Browser Check
A 200 response is not the same thing as a working page. Modern sites depend on JavaScript bundles, third-party scripts (analytics, payment, chat), and CDN-served assets. Any of those can fail while the HTML still returns 2xx.
A real-browser web page monitoring check loads the page the way Chrome would, runs the JavaScript, and verifies that critical DOM elements appear. This is the check that catches “the site looks broken” issues that pure HTTP checks miss.
5. Critical Transaction Check
For a SaaS app, the most important check is “can a user log in.” For an e-commerce site, it is “can a user complete a checkout.” These are multi-step flows that involve a session, a form submission, an API call, and a final confirmation page.
Synthetic monitoring for transactions runs a scripted user journey on a schedule (login, search, add to cart, checkout) and alerts if any step fails. Dotcom-Monitor’s EveryStep lets you record these flows in a real browser without writing code.
If you only set up one check beyond basic HTTP, make it this one. Transaction monitoring is the closest signal to actual revenue.
Choosing Monitoring Intervals and Locations
Where to Check From
A single monitoring location is a single point of failure for your monitoring. If your one check node sits in Virginia and AWS us-east-1 has a regional issue, you will get a false outage. If your check node sits in Virginia and your CDN’s European edge is degraded, you will miss a real one.
The fix is distributed checks from multiple geographies. Dotcom-Monitor’s global monitoring network runs checks from data centers across North America, Europe, Asia-Pacific, and South America.
For a small site, three to five locations is enough. Pick one near each major customer cluster, plus one outlier to catch network path issues. Do not pay for 30 locations if your customers are all in one country.
A practical rule: alert when at least two locations report a failure within a 30–60 second window. That window is roughly two consecutive 1-minute check cycles, which filters out transient single-node hiccups while still catching real outages fast.
How Often to Check
Check frequency trades off cost against detection time. The common intervals:
- 1 minute for revenue pages (checkout, login, paid traffic landers).
- 5 minutes for main marketing pages and API monitoring
- 15 minutes for secondary pages, internal tools, and low-traffic content.
A 5-minute check means an outage can run for up to 5 minutes before you know about it. The cost of that window depends on how much revenue passes through the affected page per minute. Dotcom-Monitor’s availability calculator helps size that against your SLA.
One-minute checks cost more (some tools price per check, others per monitor). For most small sites, one-minute coverage on the three revenue paths and five-minute everywhere else is the right call.
Alert Routing That Actually Gets Noticed
The failure mode here is alert fatigue. If your monitoring pages you for every blip, you start ignoring it, and the one real outage comes in muted. A few practical rules:
Set an N-of-M policy. Do not alert on a single failed check. Alert when 2 of 3 (or 3 of 5) consecutive checks fail. This kills most false positives without meaningfully delaying real ones.
Split critical from non-critical. The checkout-broken alert should ring your phone at 3 a.m. The “marketing page is slow” alert should land in a chat channel during business hours. Configure separate routing for each. Dotcom-Monitor’s alerts feature supports per-monitor channels, escalation chains, and on/off-hours rules.
Use suppression windows during planned maintenance. If you are pushing a release and expect a 30-second blip, suppress alerts on the affected monitors during the window. Do not disable them. Suppression should auto-expire.
Escalate after a delay. If the first contact does not acknowledge in 5 minutes, page the second. After 15 minutes, page a third. Pulling someone out of a meeting is fine. Missing an outage because the first responder was on a flight is not.
Add a dead man’s switch. A monitoring tool that goes silent is not the same as a healthy site. Run a heartbeat check that pages you if no check has reported in 10 minutes. This catches the failure mode where the monitoring vendor itself is having a bad day.
Tier your channels. Critical alerts should go to phone or SMS, not email. Email is fine for daily summaries and 99.95% SLA breach reports. A noisy Slack channel for warnings is fine. A phone call at 3 a.m. should mean something is actually wrong.
What to Do When an Alert Fires
An alert is the start of a process, not the end. Write down what to do for your three most likely alert types before they happen. The goal is to remove decision-making from the first five minutes of an incident.
A minimal runbook for a “site is down” alert:
- Open the monitoring dashboard. Confirm the failure from at least two locations before treating it as real.
- Check the most recent deploy. If a release went out in the last 30 minutes, roll back first and investigate second.
- Check the upstream: DNS provider status page, CDN status page, hosting provider status page. Most outages turn out to be someone else’s outage.
- If it is a third-party issue, post to your own status page and stop trying to fix it on your side.
- If it is your side, check application logs for the error spike, find the failing service, and restart or roll back.
- After resolution, run a 15-minute post-mortem. Write down what failed, how you noticed, what fixed it. You will not remember the details in three months.
Common Failure Modes and What They Look Like
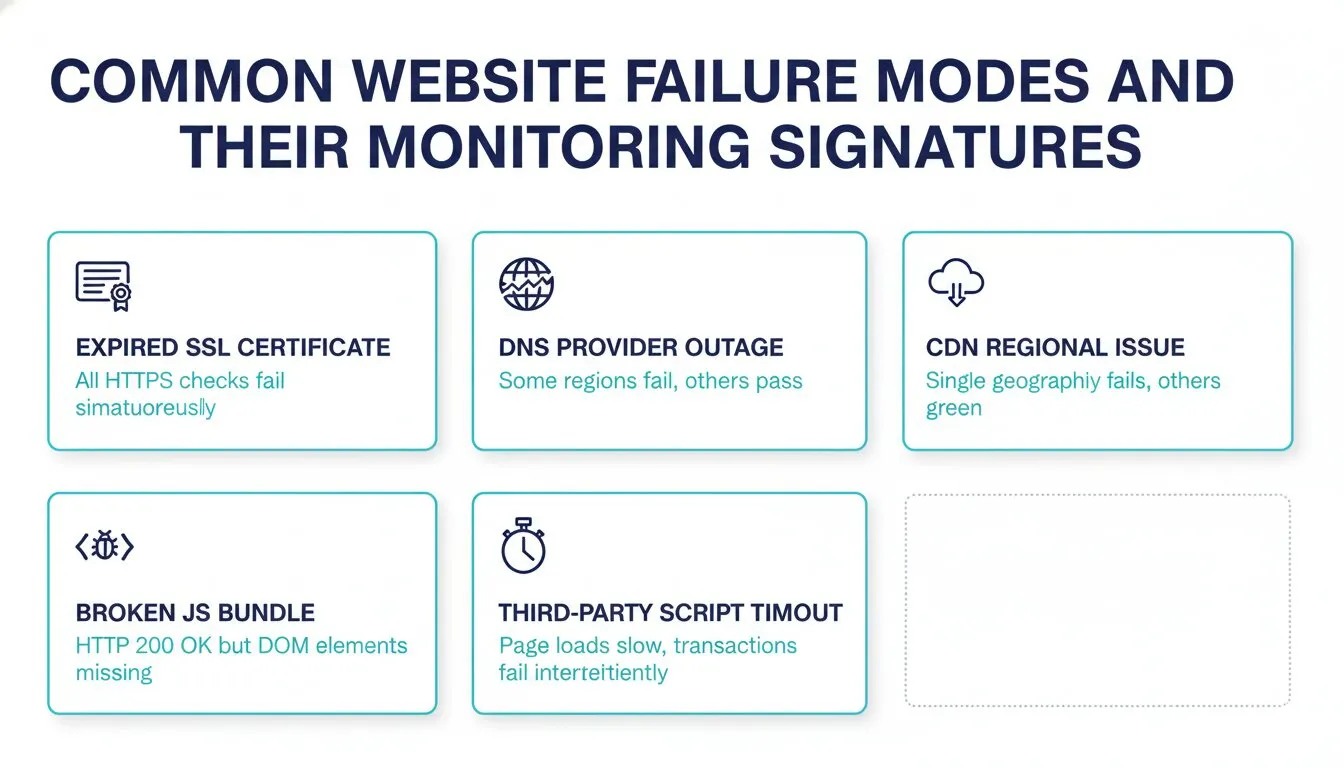
A short field guide so the alert is not the first time you have seen the symptom.
Expired SSL certificate. All HTTPS checks fail simultaneously across every location. The HTTP check still works (port 80) if you serve it. Fix: rotate the cert. Prevent: SSL expiry alerts at T-30, T-14, and T-7 days.
DNS provider outage. Some checks fail, others pass, with no clean pattern by region. Your TTL determines how long the outage will last from a user’s perspective. Fix: switch providers or wait it out. Prevent: a secondary DNS provider on the same domain.
CDN regional issue. Checks from one geography fail while others pass. Page loads return 5xx or hang. Fix: purge the CDN cache or fail over to origin. Prevent: monitor from multiple regions so you catch this in minutes, not hours.
JavaScript bundle broken by deploy. HTTP checks pass (200 OK). Real-browser checks fail because DOM elements are missing. Symptom: customers email “the button does not work.” Fix: roll back. Prevent: real-browser checks on critical pages and deploy gating on synthetic check success.
Third-party script timeout. Page loads, but slowly. Transaction checks fail intermittently at the step that depends on the script (chat widget, analytics, A/B tester). Fix: load the script async, set timeouts, remove it if it is not essential. Prevent: page-load time alerts on critical pages.
How to Choose the Right Tool
The market has dozens of options. UptimeRobot and Pingdom handle basic uptime well. StatusCake, Site24x7, and Uptrends compete on price and feature breadth. Datadog Synthetics and New Relic Synthetics fit teams already on those platforms for APM.
The questions to ask, in order:
- Does it run checks from the geographies my customers actually live in?
- Does it support real-browser checks and multi-step transactions, not just HTTP?
- Does alerting integrate with the channels I actually monitor (SMS, phone, PagerDuty, Slack)?
- Does it offer a public status page my customers can subscribe to?
- What is the price at 1-minute intervals for the critical checks I need?
Dotcom-Monitor covers the full stack from a single platform: uptime, synthetic, web application monitoring, API, plus the alerting layer and uptime and SLA reports on top. See pricing for what 1-minute multi-check coverage looks like for a site your size.
What to Do This Week
Set up HTTP(S) checks on your top three revenue pages from at least three geographic locations at 1-minute intervals. Add SSL expiry monitoring. Add a real-browser check on your most important transaction (login or checkout). Configure SMS alerts on a 2-of-3 failure policy. Write down what you will do if each one fires.
