

Your status page says every server is up. Your help desk says customers in Germany can’t log in. Both are correct. The servers are running, but the URL, port or API that users connect to isn’t answering from where those users are.
Endpoint monitoring checks those connection points from the outside, on a schedule, and alerts you when one stops answering correctly. This guide explains what counts as an endpoint, how the checks work, what to measure and how to set it up without paging your team for every network blip.
Key Takeaways
- Endpoint monitoring tests the URLs, APIs, ports, DNS servers and certificates that users connect to, from outside your network, on a schedule.
- A closed port, a 200 response with the wrong content or a regional routing problem all leave the server looking healthy.
- Check critical endpoints every 1 to 5 minutes from several locations, and confirm each failure from a second location before anyone gets paged.
- About 38% of outages detected on the Dotcom-Monitor platform resolve within 5 minutes, so 15-minute checks miss most of them.
- Dotcom-Monitor covers these endpoints with four device types (Web Pages, Web Applications, Web Services and Internet Infrastructure) from 33 public locations and from private agents inside your network.
What Is Endpoint Monitoring?
Endpoint monitoring is the continuous, automated testing of the network addresses your users and systems connect to (websites, APIs, mail servers, DNS servers and TCP ports) to confirm each one is reachable, fast and returning the correct response. A monitoring agent sends a request to the endpoint every few minutes from one or more locations, measures the response and raises an alert when a check fails.
In security, the same phrase describes watching laptops and servers for threats with EDR software. This article covers the availability and performance meaning.
Most of this work falls under synthetic monitoring, because the monitor generates the traffic, not your customers. The check runs at 3 a.m. when nobody is using the site, which is often when a failed certificate renewal or a bad maintenance window shows up first.
Dotcom-Monitor runs these checks against websites, transactions, APIs, DNS, mail servers and TCP ports from 33 public locations and from private agents inside your network.
Which Endpoints Should You Monitor?
An endpoint is any address and port a client connects to in order to use a service. For most organizations, that list is longer than the list of servers, because one server can expose several endpoints and many endpoints belong to vendors.
| Endpoint | Example | What a check confirms | Dotcom-Monitor device type |
|---|---|---|---|
| Website or page | https://www.example.com/pricing/ | The page loads in a browser, within a time limit, with the expected content | Web Pages |
| Multi-step transaction | Login, search, checkout | Each step completes and the user reaches the end of the flow | Web Applications |
| API | POST /v1/orders | Status code, response time and the fields in the JSON or XML body | Web Services |
| TCP service port | mail.example.com:25, db01:5432 | The service accepts connections and how long the handshake takes | Internet Infrastructure |
| DNS | Authoritative name servers for example.com | Records resolve to the right addresses from each region | Internet Infrastructure |
| SSL/TLS certificate | Certificate on api.example.com | Expiry date, chain and hostname match | Internet Infrastructure |
| Host | Router, gateway, VPN concentrator | Reachability, round-trip time and packet loss | Internet Infrastructure |
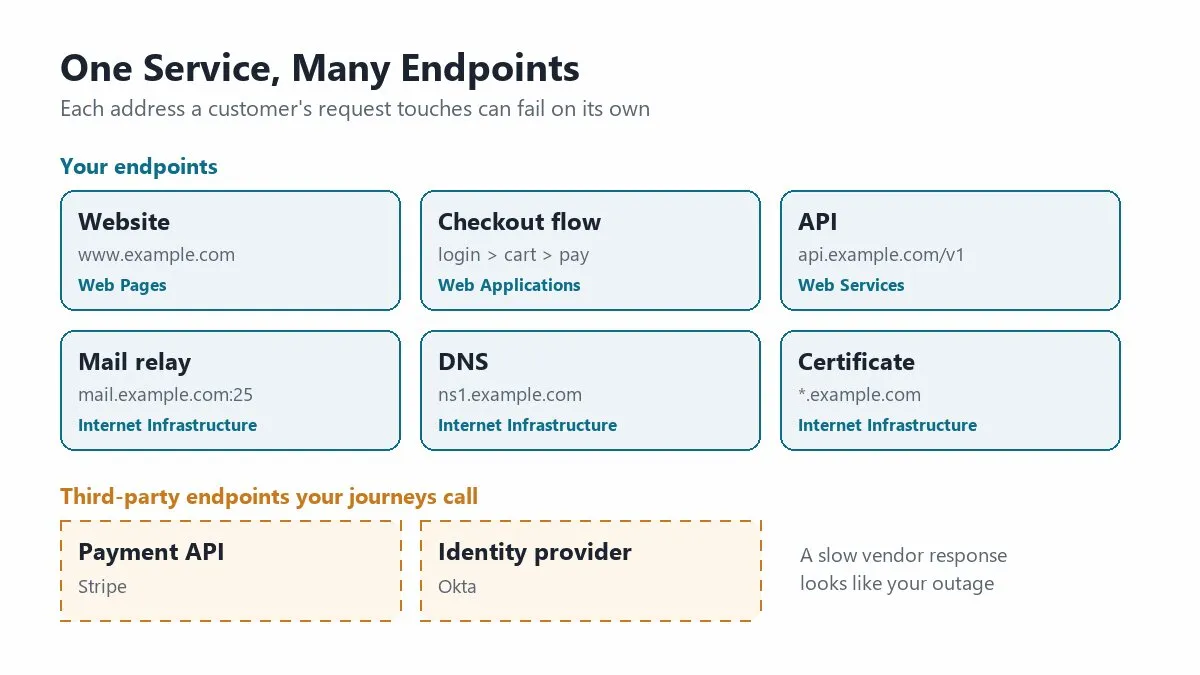
Third-party endpoints belong on the list too. If checkout calls Stripe and login goes through Okta, a slow response from either one looks like your outage to the customer.
How Does Endpoint Monitoring Work?
An endpoint check sends a request, times each phase of the response, validates what comes back and confirms any failure before it alerts. Here is what a single HTTPS check does on every run.
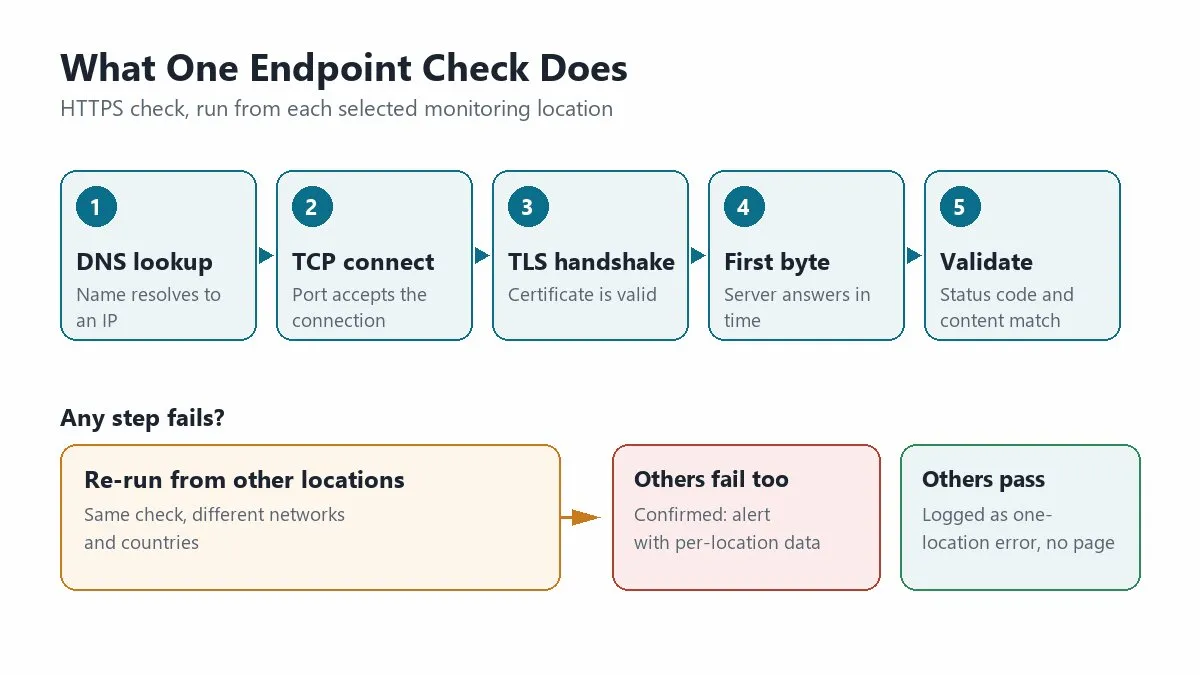
- Resolve the name. The agent looks up the hostname in DNS. A slow or failed lookup is reported as a DNS error, separate from the server.
- Connect. The agent opens a TCP connection to the port. A refused connection means nothing is listening. A timeout usually means a firewall or a routing problem is dropping packets.
- Negotiate TLS. For HTTPS, the agent completes the handshake and reads the certificate.
- Send the request and time the response. The agent records time to first byte and total download time.
- Validate the response. The check compares the status code, headers and body against rules you set. A 200 response with an error message in the body still fails.
- Confirm and alert. By default, when one location fails, the platform re-runs the check from other locations and only alerts on a confirmed failure.
Dotcom-Monitor runs these checks from 33 monitoring locations in 18 countries, as often as once a minute. Each location reports its own timings, and a failure that only affects Asia shows up only in the Asian results. For a closer look at how each phase fails, see how DNS, TCP, TLS and HTTP errors differ.
Why Does Endpoint Monitoring Matter to the Business?
Endpoint monitoring usually tells you about an outage before your customers do.
Without it, the first signal is a support ticket, a social media post or a sales rep who can’t demo the product.
Plus, endpoint checks change what you can prove. Server metrics show that a machine was running. Endpoint checks show that the service answered correctly from Frankfurt, Chicago and Sydney at every interval, which is the evidence an SLA review or a vendor dispute needs. Dotcom-Monitor’s uptime and SLA reports are built from those check results.
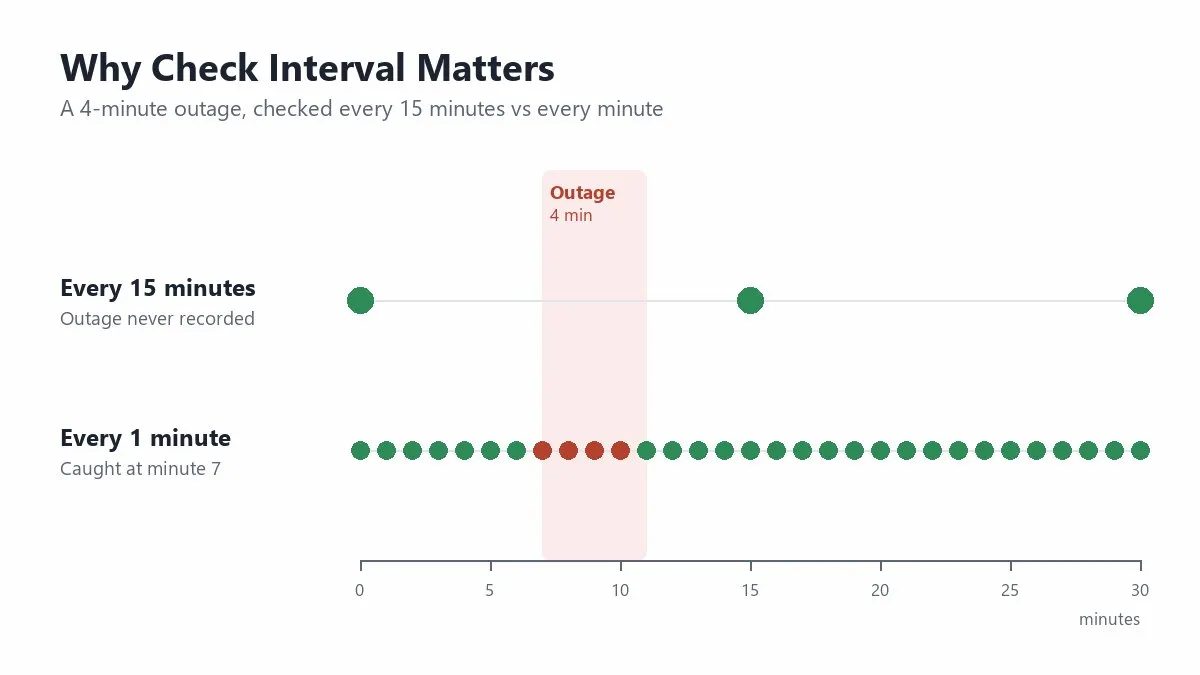
And short outages are more common than most teams assume. Across the Dotcom-Monitor platform, about 38% of detected outages resolve within 5 minutes, typically routing issues, reboots and failovers. A check that runs every 15 minutes misses most of them, but they still count against your availability.
For a sense of what those minutes cost, the cost of downtime breakdown walks through the calculation.
What Metrics Should Endpoint Monitoring Track?
Track availability, response time broken into phases, and correctness for every endpoint. The exact mix depends on the endpoint type.
- Availability. The percentage of checks that passed in the period, per location and overall.
- Response time by phase. DNS time, connect time, TLS time, time to first byte and download time. The phase that grows tells you where to look.
- Status codes and error codes. HTTP status for web and API endpoints, and connection errors (refused, timeout, unreachable) for ports and hosts.
- Response content. Expected text on a page, or expected values in an API response. Dotcom-Monitor’s assertions check JSON fields, XML fields, headers and response codes, such as “status equals success” or “price greater than 0.”
- Certificate expiry. Days until the certificate expires, plus chain and hostname errors. SSL certificate monitoring alerts at thresholds such as 30, 14 and 7 days.
- Latency and packet loss. For hosts and network paths, round-trip time and loss percentage show a degraded link before it goes down.
- Regional differences. The same metric compared across locations. A page that loads in 1.2 seconds from Chicago and 5 seconds from Sydney needs attention in Sydney.
What Do Endpoint Failures Look Like in Practice?
Most endpoint failures leave the server looking healthy.
The Server Pings, but the Service Is Down
A patch window reboots the mail relay. The host answers ping within a minute, but the SMTP service was never set to start automatically, so port 25 refuses every connection. Server dashboards show the machine as up. Outbound invoices and password reset emails queue up until someone notices.
What catches it: a Dotcom-Monitor Internet Infrastructure TCP port monitoring task on port 25 reports “connection refused” (error 10061) on the next run, confirms it from a second location and names the port in the alert.
The Page Returns 200 With an Error Message
After a deployment, the product API starts returning HTTP 200 with an empty results array because a database connection string points at the wrong replica. But a basic uptime check sees the 200 and passes. The storefront shows “No products found” to every visitor.
What catches it: a Dotcom-Monitor Web Services monitor with an assertion that the response contains at least one product ID fails on the first run after the release, with the response body attached to the alert.
One Region Can’t Reach the Site
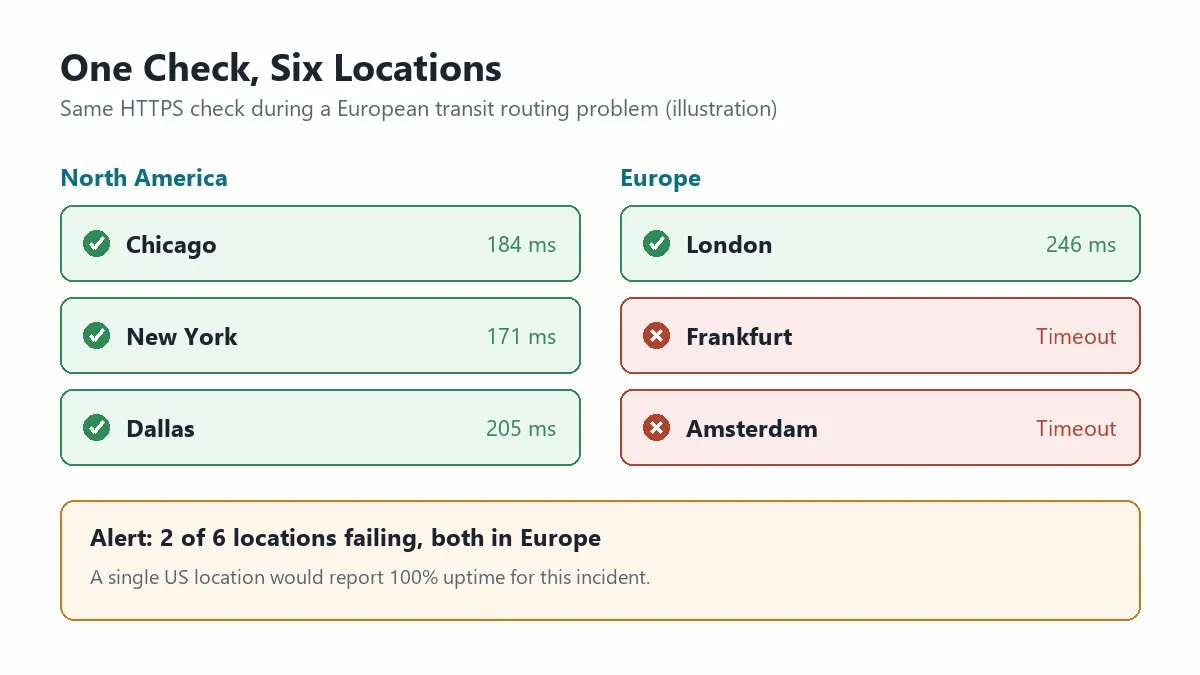
A transit provider has a routing problem in Europe. Customers in Frankfurt and Amsterdam see timeouts. Every check from a US location stays green, so a single-location monitor reports 100% uptime for the whole incident.
What catches it: the same Dotcom-Monitor check running from European and North American locations fails in Europe only. The alert lists which regions failed and which passed. Network monitoring checks against the same host capture a traceroute automatically when they fail, which points to the hop where packets stop.
A Certificate Renewal Fails on One Node
An automated Let’s Encrypt renewal succeeds on two of three load balancer nodes. The third keeps serving the old certificate, which expires on Saturday. One in three visitors gets a browser warning, and the problem looks intermittent to anyone who tests by hand.
What catches it: Dotcom-Monitor SSL certificate monitoring alerts 30, 14 and 7 days before expiry and flags chain and hostname errors. Point a separate certificate check at each node’s own hostname, not just the public name, and the stale node shows up on its own.
What Are the Best Practices for Endpoint Monitoring?
Start with the endpoints that cost money when they fail, and add the rest once the alerts are tuned.
Step 1: List the Endpoints Users Depend On
Walk through your top three customer journeys and write down every address involved, including the login page, the APIs behind it, the identity provider, the payment gateway, the mail relay that sends receipts. Include internal services that have no public address, such as database listeners and LDAP. Those get monitored from inside the network (see Step 3).
In Dotcom-Monitor, each endpoint becomes a monitoring device. Group several ports on one host under one device, and a host-wide outage opens one incident instead of three.
Step 2: Match Each Endpoint to a Check Type
Use the table above. Pages and journeys get browser checks, APIs get request and assertion checks, and everything else gets a protocol check. A login or checkout flow needs web application monitoring, which you record with the EveryStep recorder by clicking through the flow once with a test account. APIs go to API monitoring, which also imports Postman and Insomnia collections.
Step 3: Pick Locations That Match Your Users
Choose locations in the regions where your customers and offices are, and use at least three. One location can’t tell a regional outage from a global one.
For internal endpoints, install private agents on a Windows or Linux machine inside the network. An agent reports over an outbound HTTPS connection, so you don’t open inbound firewall ports. And when the same check fails from a public location but passes from a private agent, the fault is at your network edge, not in the application.
Step 4: Set the Check Interval by Impact
Run revenue and login endpoints every 1 minute, important APIs and services every 3 to 5 minutes, and low-traffic pages every 15 minutes. Because so many outages resolve within 5 minutes, long intervals make your availability numbers look better than they are. The guide on choosing check frequency and locations covers the tradeoffs.
Dotcom-Monitor sets the interval per device, down to 1 minute on paid plans. Add maintenance windows for planned work, and a scheduled reboot won’t page anyone.
Step 5: Validate Content, Not Just Status Codes
Add at least one content rule to every web and API check. A page check should look for a word that only appears when the page rendered correctly, such as the product name or the “Add to cart” label. Or, for an API, assert on a field value instead of trusting the 200.
In Dotcom-Monitor, EveryStep scripts verify that text, images or elements appear on the page, and Web Services assertions check JSON fields, XML fields and headers without code.
Step 6: Confirm Failures Before Anyone Gets Paged
Require a second location to confirm a failure before an alert goes out. A single failed check from one probe is often one bad network path, and teams that get paged for those learn to ignore alerts. Dotcom-Monitor does this by default and can also require a failure to repeat or last a set time before it fires.
Step 7: Route Alerts and Review the Reports

Send confirmed alerts to the tools your on-call team already uses. Dotcom-Monitor’s alerting integrations include Slack, Microsoft Teams, PagerDuty, SMS, phone calls and webhooks, with escalation if the first person doesn’t respond. Then review availability and response-time trends monthly.
What Should You Look for in an Endpoint Monitoring Tool?
Look for a tool that checks every endpoint type from the regions your users are in, validates content and filters out one-off failures before it alerts. Use this list when you compare endpoint monitoring tools.
| What to check | Why it matters | How Dotcom-Monitor handles it |
|---|---|---|
| Monitoring locations | Regional outages are invisible from one location | 33 locations in 18 countries, all included on every plan |
| Check frequency | Short outages slip between long intervals | Down to 1 minute per device |
| Endpoint types | Pages, APIs and ports fail in different ways | Browser, multi-step, API and protocol checks (DNS, SSL, SMTP, FTP, TCP, ping, traceroute) in one account |
| Content validation | A 200 response can still be wrong | EveryStep content checks and API assertions on JSON, XML and headers |
| False alarm control | Teams ignore alerts that fire on network blips | Second-location confirmation by default, plus repeat and duration filters |
| Internal endpoints | Databases and intranet apps have no public address | Private agents on Windows or Linux, outbound HTTPS only |
| Alerts and reports | Alerts must reach on-call, and SLAs need evidence | Slack, Teams, PagerDuty, SMS, phone and webhooks with escalation, plus uptime and SLA reports |
For data on your actual visitors or traces from your code, add a RUM or APM tool, as the next section explains.
What Can’t Endpoint Monitoring Tell You?
Endpoint monitoring shows that something is wrong and where, but it doesn’t explain why inside the code. A failed API check tells you the response took 9 seconds. It doesn’t tell you which database query caused it. That is the job of an APM tool, and Dotcom-Monitor isn’t one.
And it measures synthetic traffic, not your actual visitors. Dotcom-Monitor doesn’t offer real user monitoring, so it won’t show you how a specific customer’s browser performed. Most teams pair synthetic endpoint checks with APM and logs, and use the endpoint alert as the starting point for the investigation.
Where Should You Start With Endpoint Monitoring?
Start with your login page, your most important API and your certificates. Check them every minute from at least three locations near your customers, add one content rule to each, and require a second location to confirm before anyone gets paged. Then add port and DNS checks for the services those journeys depend on.
You can build that setup during a Dotcom-Monitor 30-day free trial, with full platform access and no credit card required.
Endpoint Monitoring FAQ
API monitoring is one kind of endpoint monitoring. Endpoint monitoring also covers websites, ports, DNS, certificates and hosts. For the API side in depth, see API endpoint monitoring.
No. Ping only shows that the host is reachable. A crashed service, a closed port or a page returning an error all leave ping passing. Use ping for hosts and network paths, and add port, HTTP or API checks for the services on them. In Dotcom-Monitor, pair ping monitoring on the host with a TCP port task for each service. When the port fails and ping passes, the service is down, not the host.
