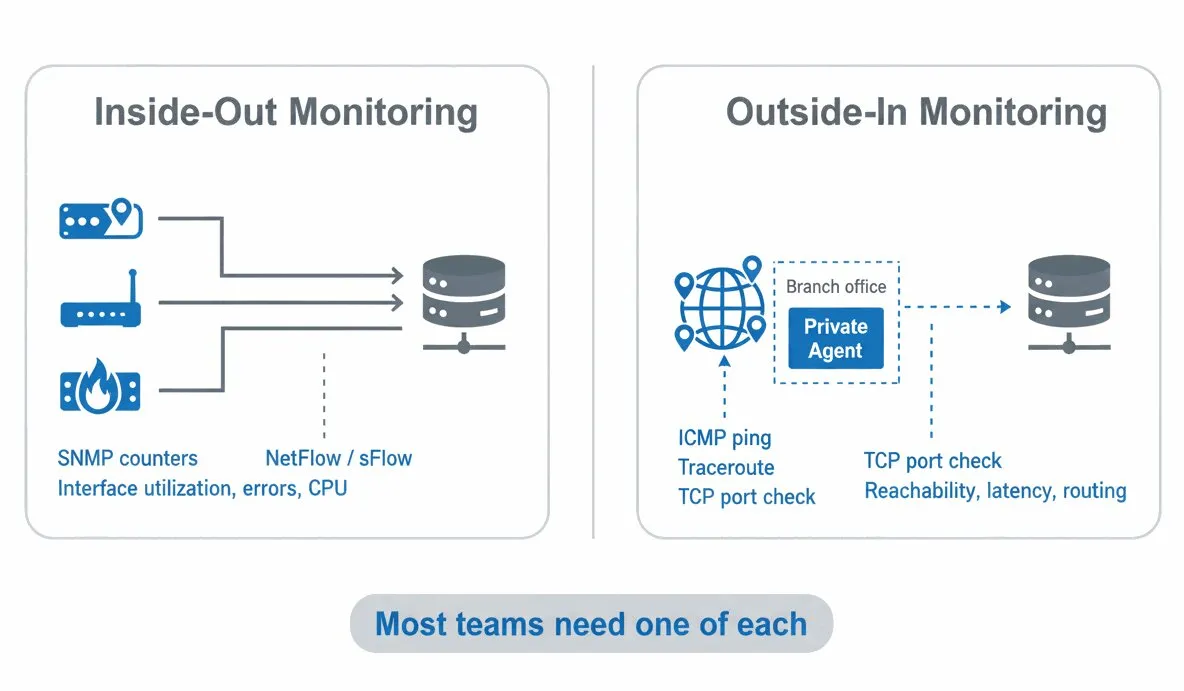
The best network monitoring software depends on where you need to see from. For switch, router and interface data, use an SNMP and flow tool such as PRTG, LibreNMS, Zabbix or Auvik. For reachability, latency and routing checks from outside the network and from branch sites, use a synthetic tool such as Dotcom-Monitor or ThousandEyes. Most teams run one of each and send both to the same alert channel.

What Is Network Monitoring Software?
Network monitoring software continuously tests hosts, network devices and the paths between them, then alerts when something is unreachable, slow or misrouted. Vendors also sell it as network performance monitoring (NPM), a network management system (NMS), or simply network monitoring tools; the terms overlap and the buying decision is the same.
SNMP polling asks a switch, router or firewall for its own counters: interface throughput, error and discard rates, CPU, memory, temperature. Flow analysis (NetFlow, sFlow, IPFIX) records which hosts talked to which, over what ports, and how much data moved. Synthetic checks send test traffic along the route users take: ICMP ping for reachability and round-trip time, traceroute for hop-by-hop path analysis, and TCP connects to confirm a service is listening on its port.
SNMP and flow data show how the network looks from inside. Synthetic checks show if it works from wherever the check runs, which can be a public location on another continent or an agent in a branch office. A complete network monitoring solution usually needs both views, and few products deliver both well.
How We Evaluated These Network Monitoring Tools
Every tool was assessed on the same points:
- Vantage point. Inside the network (SNMP, flow, LAN agents), outside it (public test locations), or both.
- Protocols and data sources. SNMP versions, NetFlow/sFlow/IPFIX, ICMP, TCP, WMI, APIs, packet capture.
- Setup and upkeep. Auto-discovery, templates, self-hosted or SaaS, and how much configuration lives in text files.
- Alerting and integrations. Thresholds, escalation, and delivery to Slack, Microsoft Teams, PagerDuty, ServiceNow or a webhook.
- Pricing model. Per sensor, per device, per host, open source, or quote only. Vendors change list prices often, so the table names the model rather than a dollar figure.
For a longer checklist on scoring a vendor, see our guide on how to choose a monitoring platform.
How Do the 20 Best Network Monitoring Software Solutions Compare?
| # | Tool | Vantage point | Main data sources | Pricing model | Best for |
|---|---|---|---|---|---|
| 1 | Dotcom-Monitor | Outside and inside (Private Agents) | ICMP, traceroute, TCP port, DNS, UDP | Fixed monthly by targets and frequency; free plan | Reachability, latency and routing from 30+ locations and branch sites |
| 2 | Paessler PRTG | Inside | SNMP, WMI, NetFlow, packet sniffing | Per sensor; 100 sensors free | Windows teams that want auto-discovery and maps |
| 3 | SolarWinds NPM | Inside | SNMP, NetFlow (add-on), NetPath | Per element; quote | Large enterprise networks with a SolarWinds stack |
| 4 | ManageEngine OpManager | Inside | SNMP, WMI, CLI, flow (add-on) | Per device | Mixed Cisco, Juniper, Fortinet and HP estates |
| 5 | Auvik | Inside (cloud managed) | SNMP, flow, config backup | Per network device | MSPs and multi-site teams that need live topology maps |
| 6 | Zabbix | Inside | SNMP, agents, ICMP, IPMI, HTTP | Open source; paid support | Teams with Linux skills that want servers and network in one tool |
| 7 | LibreNMS | Inside | SNMP, syslog, flow (via add-ons) | Open source | Network engineers who want auto-discovered SNMP graphs fast |
| 8 | Nagios Core / XI | Inside | Plugins (ICMP, SNMP, TCP, scripts) | Core free; XI per node | Shops that already run Nagios plugins |
| 9 | Checkmk | Inside | SNMP, agents, flow (Enterprise) | Raw edition free; Enterprise per service | Distributed sites that need rule-based configuration |
| 10 | Icinga 2 | Inside | Plugins, SNMP, REST API | Open source; support subscription | Nagios users who want an API and a modern web UI |
| 11 | Datadog Network Monitoring | Inside and outside | Host agents, SNMP (NDM), synthetics | Per host and per device | Cloud and container traffic next to existing Datadog data |
| 12 | LogicMonitor | Inside (SaaS) | SNMP, API, flow, collectors | Per device; quote | Hybrid infrastructure with minimal on-prem servers |
| 13 | Site24x7 | Inside and outside | SNMP, NetFlow/sFlow/J-Flow, synthetics | Per monitor; low entry price | Budget teams that also need website checks |
| 14 | Kentik | Inside (flow) | NetFlow, sFlow, IPFIX, BGP, cloud flow logs | Quote | Traffic analytics on high-volume networks and peering |
| 15 | Cisco ThousandEyes | Outside and inside | Cloud agents, enterprise agents, BGP | Quote | Enterprise WAN, SaaS and internet path visibility |
| 16 | Progress WhatsUp Gold | Inside | SNMP, WMI, flow (add-on) | Per device | Windows Server monitoring with discovery and maps |
| 17 | Netdata | Inside | Per-second host and interface metrics | Free agent; cloud per node | High-resolution server and interface metrics |
| 18 | Prometheus + Grafana | Inside | Exporters (SNMP, blackbox), scrape | Open source | Engineering teams that want metrics as code |
| 19 | Obkio | Inside (agent to agent) | Synthetic UDP between agents, SNMP | Per agent | Small teams measuring WAN and ISP quality between sites |
| 20 | ntopng | Inside (traffic) | Packet capture, NetFlow/sFlow, nDPI | Community free; Pro licensed | Seeing which applications and hosts consume bandwidth |
1. Dotcom-Monitor
Dotcom-Monitor is a cloud network monitoring service that tests reachability, latency and routing from 30+ public locations and from Private Agents installed inside your own network. It runs three check types against every host: ICMP ping monitoring for up/down, round-trip time and packet loss, traceroute monitoring for hop-by-hop path analysis, and TCP port monitoring to confirm the service on port 443, 25, 3389 or a database port is accepting connections. Checks run as often as once a minute, and a traceroute fires automatically on failure so the hop data is waiting in the alert.
The Private Agents are the part that matters for network teams. An agent is a Windows or Linux install that polls out over HTTPS, needs no inbound firewall rule, and appears in the account as another monitoring location. The same ping or port check can run from Frankfurt and from the Denver branch at the same time. When the two results disagree, the failing side is the one to investigate.
Alerting: Slack, Microsoft Teams, PagerDuty, ServiceNow, SNMP trap, webhook, SMS and phone, with escalation groups.
Pricing: Fixed monthly rate set by target count and frequency, not by check run. Protocol checks start at $40/month for five targets on the Dotcom-Monitor pricing page; a free plan covers 25 targets from two locations; Protocol Edition Private Agents are $4.95 per agent per month.
Pros and cons: Sees the network from both sides of the perimeter without opening inbound ports, agentless for public targets, predictable bill at 1-minute frequency. It does not poll SNMP interface counters, analyze NetFlow or draw topology maps, so for per-port bandwidth off your switches, pair it with one of the SNMP tools below.
Best for: IT teams that need to know if hosts, branch links and services are reachable and fast from where their users are.
Scenario: A retailer’s site-to-site tunnel between the data center and AWS drops for a few minutes every couple of weeks around 3 AM. Every SNMP graph looks fine by morning because the tunnel is back up. What catches it: a Private Agent on each side running an ICMP ping and TCP port check across the tunnel every minute. The check fails within 60 seconds, the alert reaches the on-call engineer in PagerDuty, and the packet loss chart shows how long each drop lasted.
2. Paessler PRTG
PRTG is a Windows-hosted monitoring server built around sensors. One sensor is one measured thing: traffic on a switch port, ping to a gateway, a NetFlow stream, a WMI counter on a file server. Auto-discovery scans a subnet and suggests sensors, so many small IT teams have it running in an afternoon.
Pricing: Per sensor. The free tier allows 100 sensors, enough for a home lab or a very small office.
Pros and cons: Fast setup, good maps, a large sensor library. But sensor counts grow quickly; a 48-port switch can use 48 sensors on its own.
Best for: IT teams on Windows that want SNMP and flow monitoring with maps and minimal scripting.
3. SolarWinds Network Performance Monitor
SolarWinds NPM has been the default enterprise SNMP poller for two decades and is now sold as part of SolarWinds Observability. It covers fault, availability and performance for routers, switches, firewalls and wireless controllers, and NetPath traces the hop-by-hop route to a service and marks where latency is added.
Pricing: Per monitored element, quote only. Flow analysis and configuration management are separate modules.
Pros and cons: Deep vendor coverage, mature reporting, alert dependencies that stop a dead core switch from paging you 200 times. Cost and footprint are enterprise scale, and many mid-market teams review SolarWinds alternatives when the renewal arrives.
Best for: Large networks with a dedicated NOC and existing SolarWinds modules.
4. ManageEngine OpManager
OpManager is ManageEngine’s on-premises network monitor for estates where Cisco, Juniper, Fortinet and HP hardware share the same racks. Device templates cover thousands of models, discovery classifies hardware by role, and Layer 2 maps show which switch port a host hangs off.
Pricing: Per device, with a small free edition for a handful of devices.
Pros and cons: Good value per device, wide multi-vendor support, distributed probes for branch offices. Setup takes time, and dashboards are less flexible than Grafana.
Best for: Mid-size networks that want one on-prem console at a lower price than SolarWinds.
5. Auvik
Auvik is a cloud-managed network monitor whose main attraction is the map. Install a collector, and within an hour it draws the Layer 1, 2 and 3 topology of the site, keeps it current as devices change, and overlays alerts on the diagram. It also backs up device configurations and diffs them.
Pricing: Per network device (switches, routers, firewalls); endpoints are not counted.
Pros and cons: Automated topology, multi-tenant dashboard, fast onboarding of a new site. Price climbs with device count, and the collector only sees inside each site.
Best for: MSPs and IT teams managing many locations who need an accurate map more than raw metrics.
6. Zabbix
Zabbix is an open source monitoring server that handles network devices, servers, databases and services in one system. Network data arrives by SNMP, ICMP or the Zabbix agent, is stored as items, and triggers fire when an expression evaluates true. Shared templates cover most switch and router models.
Pricing: Free under GPL. Commercial support and training from Zabbix LLC.
Pros and cons: No license cost at any device count, high availability, proxies for branch sites. But it runs on Linux and expects Linux skills, and low-level discovery can generate thousands of items on a big switch.
Best for: Teams that want one open source tool for servers and network and can run the database behind it. It also appears on our list of top server monitoring tools.
7. LibreNMS
LibreNMS is the tool network engineers on Reddit most often recommend for SNMP graphs with the least setup. It auto-discovers devices by SNMP, CDP, LLDP, OSPF and ARP, then graphs every interface, CPU and sensor it finds.
Pricing: Free and community maintained.
Pros and cons: Discovery is nearly hands-off, graphs appear immediately, active community. You host and update it, and it covers SNMP devices only, so servers and applications need another tool.
Best for: Network engineers who want per-interface graphs for every device without buying sensors.
8. Nagios Core and Nagios XI
Nagios Core, first released in 1999, is the plugin model most later tools copied: a check script returns OK, WARNING or CRITICAL, and Nagios schedules it, tracks state and notifies. Thousands of community plugins cover ICMP, SNMP, TCP ports and almost any device. Nagios XI adds a configuration wizard, dashboards and reports.
Pricing: Core is free. XI is licensed per node with a free tier for very small deployments.
Pros and cons: Proven at large node counts, huge plugin ecosystem, predictable behavior. Core is configured in text files, has a dated interface and needs add-ons for graphing.
Best for: Shops with existing Nagios plugins and staff who know the config format.
9. Checkmk
Checkmk started as a Nagios add-on and became a standalone platform with its own core. Its rule-based configuration applies one threshold to thousands of hosts by tag or folder, which keeps large distributed setups manageable.
Pricing: Checkmk Raw is free and open source. Enterprise and Cloud editions are priced per monitored service.
Pros and cons: Scales to many sites from one console and is well documented. Rule precedence takes time to learn, and small networks may not need the structure.
Best for: Companies with several sites that have outgrown a single PRTG probe or Nagios instance.
10. Icinga 2
Icinga 2 is a Nagios fork rewritten with its own configuration language, a REST API and a cluster mode for high availability and distributed zones. Icinga Web 2 replaces the classic interface, and the Director module manages hosts and services from a web UI instead of flat files. Existing Nagios plugins run unchanged.
Pricing: Open source. Paid subscriptions add support and enterprise packages.
Pros and cons: Configuration through the REST API, clustering, cleaner UI than Nagios Core. Adding agents still involves configuration work unless you commit to Director.
Best for: Nagios users who want automation and an API without leaving the plugin ecosystem.
11. Datadog Network Monitoring
Datadog’s network products sit inside its observability platform. Network Performance Monitoring uses the host agent to map traffic between services, hosts, containers and cloud regions, including DNS failures and retransmits. Network Device Monitoring adds SNMP polling of switches, routers and firewalls, and Synthetic Monitoring runs ICMP, TCP, DNS and HTTP tests from managed locations.
Pricing: Per host for NPM, per device for NDM, per test run for synthetics.
Pros and cons: Network data lands next to application traces, which helps with Kubernetes and multi-cloud traffic. Modular pricing adds up, and the SNMP side is younger than dedicated NMS tools.
Best for: Teams already on Datadog who need east-west traffic visibility in cloud environments.
12. LogicMonitor
LogicMonitor is a SaaS infrastructure monitoring platform that uses lightweight collectors inside your network to poll devices by SNMP, WMI and API, then stores and analyzes the data in its cloud. LogicModules identify a device and apply datapoints and thresholds automatically.
Pricing: Per device, quote only, with tiers for monitoring depth.
Pros and cons: Little to host, quick time to coverage, hybrid cloud and on-prem in one view. Enterprise pricing, and collectors need outbound access and their own upkeep.
Best for: Mid-size to large teams that want NMS coverage without running the server themselves.
13. Site24x7
Site24x7, from Zoho, bundles network device monitoring with website, server and cloud checks at a lower entry price than most competitors. Its on-premise poller discovers devices across IP ranges, applies templates for hundreds of vendors, and collects NetFlow, sFlow and J-Flow for interface traffic breakdowns. External website and API checks run from more than 100 locations.
Pricing: Per monitor with a low monthly starting price; network device packs are add-ons.
Pros and cons: Broad coverage for the money when one team owns both the LAN and the website. Add-on math can be confusing, and alerting is less customizable than Zabbix or Checkmk.
Best for: Small and mid-size IT teams that want network, server and website monitoring on one invoice.
14. Kentik
Kentik is a network observability platform built on flow data at very large volume. It ingests NetFlow, sFlow, IPFIX, BGP and cloud flow logs from AWS, Azure and GCP, enriches every record with geography, ASN and application, and lets you query it interactively.
Pricing: Quote, scaled to flow volume and device count.
Pros and cons: Query speed on billions of flow records, peering and cost analysis, DDoS visibility. Overkill and expensive for a company with two offices and a firewall.
Best for: Service providers, large enterprises and cloud networks focused on traffic analytics.
15. Cisco ThousandEyes
ThousandEyes tests network paths from Cloud Agents in cities around the world and from Enterprise Agents in your offices and data centers. Each test records hop-by-hop path visualization, loss, latency and jitter, then correlates that with BGP route changes and internet outage data. Large enterprises use it to tell if a problem is theirs, their ISP’s or Microsoft 365’s.
Pricing: Quote, based on a unit model tied to test frequency and agent count.
Pros and cons: Detailed path visualization, internet and SaaS outage intelligence, Cisco integration. Enterprise pricing and unit accounting, and more than a mid-market team usually needs.
Best for: Large distributed enterprises that depend on SaaS and need WAN and internet visibility.
16. Progress WhatsUp Gold
WhatsUp Gold is a Windows-hosted network monitor known for quick discovery and clear Layer 2 and 3 maps. Add-ons cover flow analysis, configuration management and logs.
Pricing: Per device, with a free trial.
Pros and cons: Easy to stand up, readable maps, lower cost than SolarWinds. Windows only, with fewer integrations than newer SaaS tools.
Best for: Small and mid-size IT departments standardized on Windows Server.
17. Netdata
Netdata is an agent that collects every metric on a host every second, including per-interface throughput, packets, errors and drops, TCP connection states and socket queues. Dashboards generate themselves, and the agent stores data locally. Netdata Cloud adds fleet views and alert routing.
Pricing: Free open source agent. Netdata Cloud is per node with a free tier.
Pros and cons: One-second resolution shows spikes that one-minute averages hide, with zero configuration to start. It is host-centric, not a switch and router monitor, and long retention needs planning.
Best for: Teams that want high-resolution interface and TCP metrics on servers, next to a device monitor.
18. Prometheus With Grafana
Prometheus scrapes metrics from exporters on a schedule and stores them as time series. For network monitoring, snmp_exporter polls switches and routers, blackbox_exporter runs ICMP, TCP and DNS probes, Alertmanager routes alerts, and Grafana turns the result into dashboards.
Pricing: Open source. Grafana Cloud offers hosted Prometheus and Grafana with a free tier.
Pros and cons: Flexible query language, fits engineering workflows, no license cost. But snmp_exporter configuration is a project in itself, and long-term storage needs Thanos, Mimir or Cortex.
Best for: DevOps and platform teams that already run Prometheus and want network devices in the same stack.
19. Obkio
Obkio is a network performance monitor for smaller teams. You place agents at each site (software, a small hardware unit, or a cloud region), and the agents exchange synthetic UDP traffic with each other every 500 milliseconds to measure latency, jitter and packet loss on every link between them. That is a practical way to prove an ISP or SD-WAN problem.
Pricing: Per agent, monthly, with a free trial.
Pros and cons: Continuous measurement between sites, easy to read, good for WAN and VoIP troubleshooting. Not a full NMS, and device monitoring is limited to SNMP basics.
Best for: Companies with several offices that need to measure WAN quality and hold their provider to an SLA.
20. ntopng
ntopng is an open source traffic analyzer that shows which hosts and applications are using bandwidth right now and over time. It captures packets on a span port or receives NetFlow and sFlow through nProbe, and its nDPI engine identifies applications such as Zoom, Microsoft 365 or BitTorrent from the traffic itself rather than the port number.
Pricing: Community edition free; Pro and Enterprise licenses add reporting and retention.
Pros and cons: Shows which host is saturating the WAN link within seconds and runs on modest hardware. Traffic analysis only, so pair it with a device or reachability monitor.
Best for: Admins who need application traffic visibility without a Kentik-size budget.
Which Network Monitoring Software Is Free or Open Source?
Eight tools on this list cost nothing to license: Zabbix, LibreNMS, Nagios Core, Icinga 2, Checkmk Raw, Prometheus with Grafana, the Netdata agent and ntopng Community. All are open source and self-hosted, so the cost moves to a Linux server, patching and the hours someone spends on templates and triggers.
Two commercial tools have usable free tiers. PRTG allows 100 sensors, enough for a small office. Dotcom-Monitor’s free plan covers 25 targets at 5-minute frequency from two locations. And ManageEngine OpManager, Nagios XI and Netdata Cloud each have a free edition limited to a handful of devices or nodes.
For a home lab or a network under about 30 devices, LibreNMS or PRTG Free is the fastest path to graphs. Above that, Zabbix or Checkmk Raw scales further but expects more setup time.
How to Choose Network Monitoring Software for Your Network
Start with the failures you have actually had, then pick tools that would have caught them.
If the last three incidents were a switch running hot, an interface flapping and a WAN link saturated by backups, you need an SNMP and flow tool: PRTG, LibreNMS, Zabbix, Auvik or OpManager depending on budget and skills. If the incidents were a service down while the host still pinged, a branch that could not reach HQ, or customers in one region seeing timeouts, you need synthetic reachability checks from where those users are, which is what Dotcom-Monitor, ThousandEyes and Obkio do.
Most teams have had both kinds. And most tools in this list only see one side, so plan for two tools that feed the same alert channel rather than one tool for everything.
Scenario: A payroll application at a 300-person manufacturer goes down on a Friday. Ping to the server is fine, CPU is normal, and PRTG shows the interface up. The application service crashed and stopped listening on port 8443. What catches it: a TCP port check on 8443 running every minute from a Private Agent on the office LAN, next to the ping. The port check fails while ICMP stays green, which tells the on-call admin it is the service, not the network, before anyone opens a ticket.
Then check these points:
- Frequency. A 5-minute interval means a 4-minute outage may never register. For anything in an SLA, look for 1-minute checks and confirm the price at that frequency.
- Locations and agents. External tools should test from the regions where your users are, and from inside your own sites without opening inbound firewall ports.
- Dependencies. Alerting that understands topology (a dead core switch suppresses alerts for everything behind it) saves your on-call rotation.
- DNS. Many “network” outages are resolver failures. Add DNS checks to any tool you pick; our guides on how to improve DNS resolution time and prevent DNS outages cover the specifics.
- Total cost. Free software still costs a server, patching and someone’s time. Per-sensor and per-device licenses grow with the network.
If the applications running over the network matter as much as the network itself, our comparison of web application monitoring tools covers the next layer up.
The Bottom Line
For a small or mid-size IT team, the practical combination is one SNMP tool for the devices you own and one synthetic tool for the paths you depend on. PRTG or LibreNMS covers the first job well; Zabbix or Checkmk if you want servers in the same system. Dotcom-Monitor covers the second, with 1-minute ping, traceroute and port checks from 30+ locations and from Private Agents inside each site, at a fixed monthly price.
Larger networks with a NOC will lean toward SolarWinds, LogicMonitor or Auvik for devices and ThousandEyes or Kentik for path and traffic analytics. Either way, send both tools’ alerts to the same channel.
See your network from outside and inside.
Start a free 30-day trial of Dotcom-Monitor, point ping, traceroute and TCP port checks at your hosts from 30+ locations, and add a Private Agent to watch the links your users depend on. No credit card required. Details are on the network monitoring solution page.