
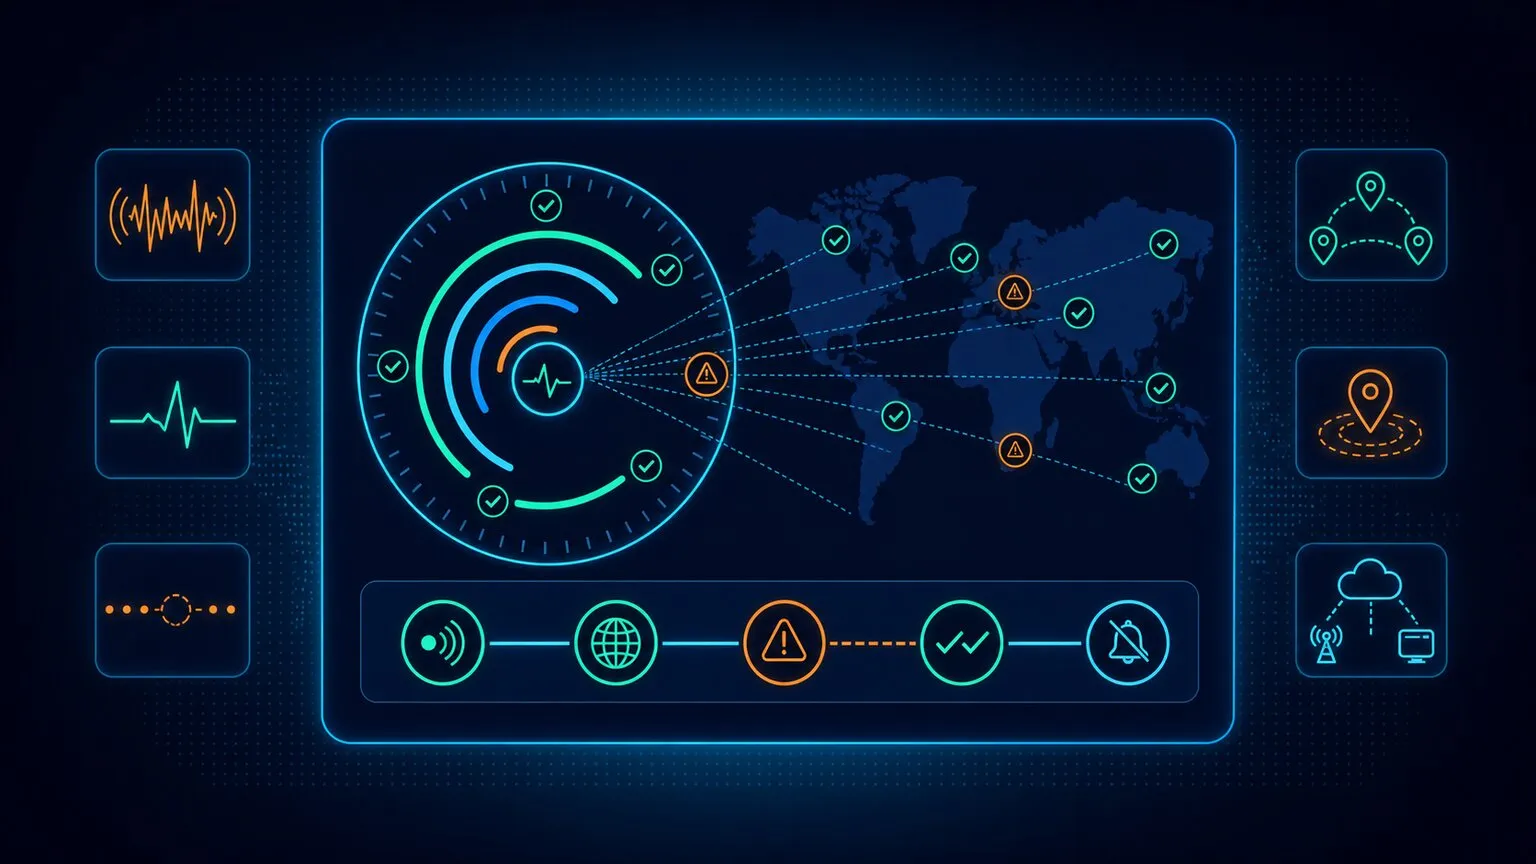
Synthetic monitoring is, at its core, about visibility. It’s the practice of probing your systems from the outside to see what a user would see.
But two hidden parameters determine whether those probes actually deliver value: frequency, meaning how often you run checks, and location, meaning where you run them from. Both are more than technical configurations. They’re strategic choices that ripple through detection speed, operational noise, and even your team’s credibility.
Run checks too often, and the system feels hyperactive. You’ll catch every transient blip, every network hiccup, and every one-off error. That can be useful for diagnosis, but it also floods teams with false positives and inflates monitoring bills.
Run checks too rarely, and you create blind spots. An outage may smolder unnoticed until customers feel it first, undermining both trust and your stated SLAs.
Location carries the same risk. Even a perfectly tuned cadence can mislead you if every check originates from a single, pristine cloud data center. A login might work flawlessly from your primary region while failing for users everywhere else.
What Is Synthetic Monitoring?
Synthetic monitoring is the practice of running scripted checks against your applications from external locations. These checks simulate user actions like loading a page, logging in, and completing a checkout without relying on real users. Unlike real-user monitoring (RUM), which passively observes traffic, synthetic monitoring is active and intentional. Not sure what is synthetic monitoring? Read our complete guide.
The key advantages are control and predictability. With synthetic, you decide what workflows to test, from which geographies, and at what intervals. This allows you to:
- Detect downtime before users complain.
- Validate third-party services like payment gateways or OTP providers.
- Measure performance consistently across time and region.
The trade-off is that synthetic monitoring is sampled, not continuous. Its usefulness hinges on how often you run those probes, where you run them from, and how you design their scope.
How Dotcom-Monitor does it: Dotcom-Monitor’s synthetic monitoring runs these scripted checks in real Chrome, Firefox, Edge, and Safari browsers rather than simplified simulations, so front-end rendering problems, JavaScript errors, and slow third-party resources are caught along with outright downtime. You build the scripts without writing code: the EveryStep Web Recorder captures multi-step workflows such as SSO logins, cart actions, and multi-page checkouts simply by clicking through your site. When a check fails, the platform records video playback of the failed run, waterfall charts, and full-DOM snapshots, so you see exactly which call, element, or redirect broke the journey.
Why Frequency Matters in Synthetic Monitoring
Frequency is the heartbeat of synthetic monitoring. It sets the rhythm for how quickly you detect problems, how much noise you generate, and how much you spend. A healthy rhythm gives you visibility without overwhelming your teams, and an unhealthy one either leaves you blind or drowns you in noise.
Too frequent, and every jittery TLS handshake or transient 500 error turns into a potential alert. Costs rise as runs multiply across workflows and locations. Too infrequent, and you risk missing short outages entirely or taking too long to respond when major incidents begin. In both extremes, monitoring loses credibility, which is the worst fate for any operational tool.
The right frequency is rarely obvious. It depends on how critical the workflow is, what your SLA requires, how much noise you’re willing to absorb, and how much budget you can allocate. Treating frequency as a lever and not as a default gives you the ability to tune monitoring so it reflects your business priorities.
How Dotcom-Monitor does it: Frequency is set per monitor, not per account. Checks can run as often as every 60 seconds for revenue-critical flows, while secondary workflows run on relaxed schedules, all managed from one dashboard. That means a silent checkout failure can be detected within a minute or two, while your marketing pages aren’t burning budget on the same cadence.
Why Location Matters: Monitoring from Multiple Locations Why Location Matters: Monitoring from Multiple Locations
Frequency answers “how often.” Location answers “from where,” and it deserves the same deliberate treatment. Online businesses serve global audiences, so single-location monitoring isn’t enough. A user login might work perfectly from one region but fail everywhere else; an e-commerce checkout may be fast on desktop Chrome but struggle on a mobile network. The probes behind synthetic monitoring might live in a cloud data center, on a mobile network, or inside a corporate office, and their location changes what the test can see.
Running checks from multiple locations delivers several distinct benefits:
- Identifies regional performance issues. Applications can perform differently depending on the time of day and the user’s location. Monitoring from several global vantage points surfaces region-specific problems like high latency or delayed load times. To ensure consistent resolution across regions, specialized DNS monitoring tools are often used to track record health from multiple global nodes.
- Provides a global view of user experience. For companies operating globally, multi-location monitoring ensures applications perform correctly for all users and geographies, not just those near the primary site. This is the foundation of synthetic end user monitoring across global environments: simulating full user journeys from each key region, not just pinging endpoints.
- Enables targeted optimizations. Analyzing location-specific performance variations supports strategic improvements, such as upgrading servers in specific regions or deploying CDNs to reduce latency for a worldwide audience.
- Supports proactive problem resolution. Evaluating real user workflows from multiple locations lets you identify and fix performance issues, defects, and failures before they reach an actual user.
- Drives better infrastructure planning. Multi-location insights inform capacity planning and decisions about where to strategically place servers to best serve your global customers.
- Validates multi-regional functionality. It verifies that critical user flows, like logging in or adding items to a cart, work correctly across different geographic locations, confirming consistent functionality worldwide.
- Reduces false positives in alerts. With data from multiple locations, you can configure alerts to trigger only when an issue is confirmed across probes, rather than paging the team for an isolated, short-lived blip at a single location.
How Dotcom-Monitor does it: Dotcom-Monitor’s global monitoring network spans 30+ checkpoints across every major region, hosted in top-tier data centers. Every benefit above maps to a platform capability: per-location reporting isolates regional latency, location-filtered dashboards give the global view, and built-in double-check logic verifies a failure reported by one node against other nodes before alerting, which is how the platform keeps false positives out of your on-call rotation.
How Multi-Location Synthetic Monitoring Works How Multi-Location Synthetic Monitoring Works
Multi-location synthetic monitoring works by deploying scripts, bots, or agents in different geographic locations to continuously test an application’s performance, functionality, and availability. The lifecycle looks like this:
- Probes/agents are deployed. Monitoring agents are set up on servers or devices in different global locations, including cloud data centers, mobile networks, and even behind corporate firewalls.
- Scripted transactions are executed. Probes run automated scripts that replicate user behavior: navigating pages, logging in, adding items to a cart, completing a purchase.
- Data is collected. As scripts run, agents record key metrics like load time, error occurrences, and availability.
- Results are centralized. All collected data flows back to a central monitoring system for analysis and reporting.
- Location-specific performance is assessed. Because the same test runs from many vantage points, issues affecting users in a specific location or on particular network conditions stand out immediately.
- Alerts are triggered. The system notifies the relevant teams when an error is detected and confirmed by follow-up tests from that location, or when a defined number of locations experience the same issue.
How Dotcom-Monitor does it: This entire lifecycle is managed for you. Dotcom-Monitor operates the public checkpoint network, so there are no agents to install and no code changes for external monitoring; you record a script once and assign it to any combination of the 30+ locations. For step 6, alerts flow into the tools your team already uses, including Slack, Microsoft Teams, PagerDuty, and ServiceNow, through native integrations.
Factors That Influence Frequency
Frequency reflects both technical realities and business constraints. Six drivers show up consistently:
- Application type. Mission-critical systems like banking and healthcare portals justify near real-time checks. Internal HR tools or marketing blogs don’t.
- Geographic distribution. A global audience demands distributed checks to catch CDN or ISP issues (see the multi-location sections above and below for how to choose regions).
- Compliance and industry rules. Financial services, healthcare, and government systems often face strict uptime monitoring requirements.
- SLAs and customer promises. If you’ve committed to 99.9%, a 15-minute detection lag consumes a third of your monthly error budget before you even start responding.
- Cost considerations. Lightweight probes are cheap. OTP SMS, email checks, and device emulations are expensive at scale.
- Operational readiness. If your team cannot triage minute-level alerts 24/7, scheduling them only creates fatigue.
The takeaway is that frequency is not a technical knob; it’s a reflection of organizational maturity and priorities. A startup might run checks every 15 minutes and rely on customer reports. A regulated bank might run every minute and invest in staff and tooling to support that load.
How Dotcom-Monitor does it: The platform matches each driver with a control. Compliance-heavy workflows get 60-second real-browser checks with SLA-oriented reports and dashboards that document uptime from neutral third-party locations. Cost pressure is handled by mixing check types: lightweight uptime, ping, DNS, and TCP port checks run at high frequency cheaply, while full browser transactions are reserved for the flows that earn them. And operational readiness is protected by role-based recipient lists, so minute-level alerts reach the on-call engineer rather than everyone’s inbox.
Network Types: Beyond Geography
Geography answers the “where in the world” question. Network type answers “through which kind of connection,” and it matters just as much, because end-user experience is shaped not only by distance but by the quality and variability of the networks your users rely on. A test might look perfect when run from a fast, clean cloud network like AWS or Google Cloud, yet perform poorly over a real-world mobile connection that’s slow, congested, or unstable.
Cloud/data center probes
- Pros: Highly stable, low latency, consistent baselines.
- Cons: Unrealistically fast compared to real-world connections.
- Use case: Great for backend availability monitoring, but limited for end-user realism.
Residential ISP probes
- Pros: Reveal last-mile issues like DNS caching, ISP throttling, or packet loss.
- Cons: Home networks vary widely, so results fluctuate more than tests from controlled cloud environments.
- Use case: Validating consumer-facing apps where home internet is the dominant access method.
Mobile probes (3G/4G/5G)
- Pros: Expose latency, jitter, and performance issues on cellular networks.
- Cons: Results vary significantly from run to run and are hard to predict.
- Use case: Essential for mobile-first apps or regions where most traffic is mobile.
Corporate/branch office probes
- Pros: Validate internal business applications, VPN access, or hybrid cloud connectivity.
- Cons: Not representative of public customers.
- Use case: Enterprises with remote workforces or branch offices relying on SaaS tools.
Combined, these network types give a multi-dimensional picture of how real users experience your application. Cloud agents measure raw application performance but can’t show how everyday networks feel; ISP probes expose last-mile problems; mobile probes show cellular behavior; and corporate probes ensure business-critical apps work for employees. This blended approach reduces blind spots, strengthens SLA reporting, and builds confidence that your monitoring reflects the reality of your audience, not just the comfort of your data center.
How Dotcom-Monitor does it: The public checkpoint network covers the cloud/data center layer with stable baselines, and mobile network checks simulate cellular conditions for mobile-first audiences. For the corporate and internal layer, private agents (Private Nodes) install inside your own network or private cloud and monitor intranets, ERP systems, VPN tunnels, and employee portals from a secure internal vantage point, without modifying firewall or security settings. Public checkpoints and private agents report into the same dashboard, so external and internal experience sit side by side.
Best Practices for Choosing a Frequency
Before setting any cadence, make sure your tooling supports the scheduling granularity you need. Use our checklist for choosing the best synthetic monitoring tools to evaluate your options. Teams that succeed with synthetic monitoring don’t stumble into the right cadence; instead, they design it deliberately. The most effective approaches share five recurring themes.
Anchor Frequency in Outcomes
The first question should always be: what happens if this flow breaks? If the answer is revenue loss or compliance breach, the interval must be tight. If the impact is minor, like a marketing blog, the cadence can be relaxed.
Protect the Most Important Pieces
Not all workflows are equal. Logins, payments, and checkout flows sit at the top of the hierarchy and deserve higher frequency. Supporting features can afford more breathing room.
Adapt to Context
Monitoring shouldn’t be static. Increase cadence during business hours, promotions, or release windows, then scale it back when risk is lower, which balances vigilance with cost.
Think in Tiers
Uptime checks are your smoke detectors, and they run every minute. Transaction flows come next, at 5–15 minute intervals. Long-tail workflows, like account settings or loyalty programs, may only need hourly checks. Deciding how many regions to cover is equally important, and the next section walks through exactly how to choose.
Design Alerts to Match Frequency
High cadence is only valuable if it doesn’t overwhelm your team. Multi-location confirmation and suppression rules prevent false positives from turning into 3 a.m. pages.
Together, these principles highlight the truth: frequency and alerting are inseparable. The interval sets the heartbeat, but your alert design determines whether that pulse signals health or just noise.
How Dotcom-Monitor does it: Each tier maps to a monitor type: protocol-level uptime checks act as the every-minute smoke detectors, EveryStep browser transactions cover logins and checkouts at 5–15 minutes, and lower-priority flows run hourly, each with its own schedule. Custom alert thresholds and conditions let you define exactly what counts as a failure (response time, error rate, missing content), and double-check verification across locations suppresses one-off blips so high cadence never turns into high noise.
Take Control of Your Monitoring Strategy
Dotcom-Monitor’s Synthetic Monitoring solution helps you fine-tune frequency, manage alerts intelligently, and monitor globally—all from a single platform that provides visibility without noise.
Explore Synthetic Monitoring Solutions
Choosing the Right Geographic Locations and Network Types
So how do you choose the right locations? The goal of synthetic monitoring is to collect accurate, meaningful, and consistent data, not to run an overwhelming number of tests or gather unnecessary information. A strategic mix balances cost, coverage, and clarity, giving you enough visibility to detect real issues without drowning your team in data.
- Match probes to your customer base. If 70% of your traffic comes from North America, ensure multiple probes across U.S. regions. If 20% is in Europe, cover at least one EU city.
- Don’t overspend. Running tests from 30 cities every minute may flood your alert system with noise and inflate monitoring costs. Start small.
- Balance frequency across regions. Use high-frequency checks in your top regions and lower-frequency checks in secondary regions. This is where the frequency tiers above and your location strategy intersect.
- Test across network types. Add mobile probes if your analytics show 60% of traffic comes from phones. Use residential probes to mimic real consumer internet.
- Consider compliance and SLAs. Some businesses need proof that uptime was measured from multiple neutral third-party locations, not just their own servers.
A common pattern: run one probe in each major region where you do business, plus at least one residential or mobile probe to capture end-user variability. Expand over time as you learn where issues crop up. The key is to treat probe placement as an evolving design choice, not a one-time configuration. Your customer footprint will change, your infrastructure may shift, and compliance expectations can tighten. By revisiting your monitoring mix periodically, you avoid both blind spots and wasted spending, ensuring that your tests continue to reflect reality rather than assumptions.
How Dotcom-Monitor does it: Dotcom-Monitor’s synthetic monitoring solution makes probe placement a checkbox exercise: activate, schedule, and manage any combination of the 30+ regions from a single dashboard, and change the mix at any point as your customer footprint evolves. For most enterprise workloads, 3 to 5 locations covering each major customer region is the sweet spot, which is enough for double-check verification without flooding your alert budget. For compliance cases, the checkpoints act as neutral third-party measurement points, and SLA reports document uptime from each of them.
Common Frequency Ranges and When to Use Them
There isn’t a universal schedule for synthetic checks. Every organization ends up balancing risk, cost, and visibility in its own way. That said, certain cadences show up so often across industries that they’ve become practical benchmarks. Think of these not as rigid rules but as calibration points you can measure yourself against:
Every 1 minute
Used for high-stakes systems where downtime is catastrophic. Think trading platforms, online banking logins, and healthcare portals. In these contexts, seconds matter.
Every 5 minutes
The sweet spot for many SaaS dashboards and e-commerce checkouts. This interval provides high visibility while keeping costs and false positives manageable.
Every 15 minutes
Typical for marketing sites, blogs, or landing pages. Failures still matter, but the urgency is lower, so the cadence can stretch.
Hourly or daily
Best for OTP delivery validation, email checks, and batch jobs. These are inherently noisy or expensive to monitor continuously, so slower cadence makes sense.
These ranges are useful reference points, but they aren’t prescriptions. The biggest mistake teams make is assuming everything deserves the one-minute treatment. That approach is expensive, noisy, and unsustainable. Strong monitoring programs map different cadences to different risks, building a layered model instead of a flat schedule.
How Dotcom-Monitor does it: All four tiers are supported natively. The 60-second minimum interval covers the one-minute tier for trading, banking, and healthcare flows; browser transaction monitors handle the 5 and 15 minute tiers; and scheduled protocol checks (email server, phone number, streaming) cover the hourly and daily tier. Because every monitor carries its own schedule, one account can run the entire layered model without paying one-minute prices for hourly problems.
Examples of Synthetic Monitoring Frequency in Practice
Below are common examples of ways to schedule synthetic monitoring in practice:
Ecommerce checkout. A global retailer runs login and checkout flows every 5 minutes from five regions. Supporting workflows like loyalty programs run every 30 minutes. During peak campaigns such as Black Friday, transaction cadence doubles and additional geographies come online.
SaaS uptime monitoring. A fintech SaaS platform runs uptime checks every minute from three canary regions. The login-to-portfolio workflow runs every 3–5 minutes, and heavy exports run hourly. Compliance pressures and customer trust justify the cost.
OTP delivery monitoring. A healthcare provider validates SMS and email OTP delivery hourly, using dedicated test accounts. At the same time, bypass mechanisms allow synthetic agents to log in frequently without triggering OTP, ensuring availability is monitored at high cadence while delivery is validated at low cadence.
Event-driven monitoring. A media company accelerates frequency during live-streamed events, running checks every minute across multiple regions, and then tapers back afterward. This adaptive strategy matches cadence to risk windows.
These stories highlight a pattern: frequency is context-driven, not one-size-fits-all. So, don’t try and apply a broad, generic template when setting your synthetic monitoring frequency. Instead, look at your industry and the needs and patterns of your customers or users, and then make a decision about what monitoring frequency is best for you.
How Dotcom-Monitor does it: Every pattern above is a standard configuration. The retailer’s setup is an EveryStep checkout script assigned to five checkpoints on a 5-minute schedule; the fintech’s canary regions are three checkpoints running 60-second uptime checks; the healthcare provider’s OTP validation uses email and phone number monitoring on hourly schedules; and the media company simply edits schedules and location groups before and after each event, no re-scripting required.
Implementing and Adjusting Frequency
Setting a cadence once and walking away is one of the fastest ways to end up with blind spots or wasted spending. Monitoring frequency isn’t static, so it should evolve with your systems, your users, and your business priorities. The most reliable programs treat frequency as a living decision, refined in cycles rather than locked in place. For a step-by-step rollout framework, see our blueprint for successful synthetic monitoring implementation.
Here’s a practical sequence to guide that process:
- Start broad: Begin with reasonable defaults: 1 to 5 minutes for critical flows, 15 to 60 minutes for secondary ones. This establishes a baseline without over-engineering.
- Measure outcomes: Compare how often incidents are detected by monitors versus reported by users. If your users are beating your monitors, cadence is too slow. If noise dominates, cadence may be too fast.
- Visualize results: Dashboards make it easier to see patterns in false positives, wasted spend, or gaps in coverage. Use the data to make frequency adjustments grounded in evidence.
- Align with SLAs: Monitoring intervals must support the detection and response times you’ve promised externally. Otherwise, your SLAs risk becoming paper commitments.
- Review regularly: As dependencies, architectures, or geographies shift, cadence should evolve too. A quarterly review cadence works well for most teams.
Treat synthetic monitoring frequency decisions the way you treat budgets or staffing plans: important, dynamic, and worth revisiting often. By embedding review cycles, you ensure that your monitoring adapts alongside the business rather than drifting into irrelevance.
How Dotcom-Monitor does it: Steps 2 through 5 run on data the platform already collects. Historical alert logs show which alerts were genuine versus noise, feeding your cadence reviews with evidence instead of anecdotes. Reports and dashboards visualize per-location performance trends and coverage gaps, SLA reports track your intervals against promised detection times, and schedule changes take effect from the dashboard immediately, so a quarterly review turns into minutes of reconfiguration rather than a migration project.
Mistakes to Avoid
Getting monitoring frequency right is as much about discipline as it is about strategy. Teams often know the proper theory but fall into the same traps when pressure mounts, whether that’s from anxious stakeholders who want “maximum coverage” or from budget concerns that push monitoring into neglect. Recognizing the common pitfalls up front makes it easier to avoid them. The following are points to consider:
- Everything, every minute. Unsustainable noise and cost. It might feel rigorous, but it overwhelms staff and depletes budgets.
- Too infrequent. Missed incidents and credibility loss. If users discover outages before your monitors do, trust in your system erodes quickly.
- Flat frequency. Failing to distinguish between critical and trivial flows. Treating all workflows equally wastes resources and dilutes focus.
- Single-location monitoring. Checking only from one region or only from pristine cloud networks hides regional outages and last-mile issues that your real users hit every day.
- Ignoring costs. Running OTP/email checks too often. Some flows incur hard per-message or API fees, and frequency multiplies those costs.
- No feedback loop. Failing to revisit cadence as systems evolve. What worked a year ago won’t necessarily fit today’s architecture or risk profile.
It’s important to understand that avoiding these traps is half the battle of building a credible monitoring program. Good monitoring isn’t about chasing a “perfect number”; it’s about maintaining a balance that evolves with your systems, your team, and your users.
How Dotcom-Monitor does it: The platform is built to make these traps hard to fall into. Per-monitor schedules prevent flat frequency, double-check verification and edge-case geographic alert rules keep single-location blind spots and false pages out of the rotation, customizable recipient lists stop alert floods from reaching the wrong people, and historical alert data gives you the feedback loop for quarterly reviews.
Role of Monitoring Tools
Modern monitoring platforms help organizations apply discipline to frequency and location alike. Tools like Dotcom-Monitor allow global scheduling, multi-location confirmation, and layered policies that separate uptime probes from transactions. Built-in suppression reduces false positives, and adaptive scheduling lets you increase cadence during high-risk windows. Without these features, teams often default to “everything every minute,” burning money and eroding trust. Explore how our synthetic monitoring platform puts all these controls in one place.
When evaluating a platform’s multi-location capabilities specifically, look beyond uptime tracking. Our comparison of the best tools for synthetic & infrastructure monitoring breaks down what to look for. Five key criteria, and how Dotcom-Monitor meets each one:
- Global coverage. A broad network of monitoring locations across continents, regions, and key business markets. Dotcom-Monitor operates 30+ checkpoints worldwide, so you can test from where your visitors actually are and catch geography-specific routing issues.
- Flexible test configuration. Customizable test frequency and locations, from simple HTTP checks to complex user transactions. Dotcom-Monitor spans protocol checks to full real-browser journeys recorded with EveryStep, each with independent schedules down to 60 seconds.
- Reliable data accuracy. Consistent testing environments and standardized metrics, so data from multiple locations remains trustworthy and comparable. Dotcom-Monitor’s checkpoints run in top-tier data centers with standardized configurations, backed by a 99.99% platform uptime SLA.
- Real-time alerts and reporting. Instant alerts and reporting broken down by location. Dotcom-Monitor delivers threshold-based alerts through Slack, Teams, PagerDuty, ServiceNow, SMS, and email, with per-location dashboards for regional slowdowns.
- Integration and scalability. A platform that fits your existing monitoring stack and scales with your business. Dotcom-Monitor offers a full management API for provisioning monitors programmatically, plus enterprise options such as multi-tenant accounts and white-label reporting.
Dotcom-Monitor provides probes in key global regions and supports both browser-based and API-level tests, along with mobile network checks and the ability to segment monitoring views by department (e.g., IT vs. marketing), ensuring each team gets the visibility it needs.
How Dotcom-Monitor Delivers Multi-Location Synthetic Monitoring at Every Frequency
Everything this article recommends, layered frequencies, deliberate probe placement, and alerting that matches cadence, comes together in a single Dotcom-Monitor account.
On frequency, every monitor carries its own schedule. Uptime and protocol checks run as often as every 60 seconds to act as smoke detectors for trading platforms, banking logins, and healthcare portals. EveryStep browser transactions cover logins, carts, and checkouts at 5–15 minute intervals in real Chrome, Firefox, Edge, and Safari browsers. Lower-stakes flows, such as OTP delivery, email services, and batch jobs, run hourly or daily using dedicated email and phone number monitors. Schedules change from the dashboard in minutes, so cadence can tighten for a Black Friday peak or a product launch and relax afterward, no re-scripting required.
On location, the platform runs your same scripts from 30+ global checkpoints hosted in top-tier data centers, and a typical enterprise setup assigns each critical flow to 3 to 5 locations covering every major customer region. Mobile network checks add cellular realism for mobile-first audiences, and private agents extend the same monitoring inside your firewall for intranets, ERP systems, and VPN-dependent apps. Public checkpoints and private agents report into one dashboard, so external and internal experience sit side by side.
Tying the two together, double-check verification confirms a failure seen at one location against other locations before anyone is paged, per-location dashboards isolate regional slowdowns, and SLA reports document uptime as measured from neutral third-party vantage points. The result is the layered model this article describes: the right check, at the right interval, from the right places, with alerts your team can trust.
Start Monitoring Smarter
Experience real-time insights, custom alerting, and global visibility with Dotcom-Monitor’s Synthetic Monitoring. Detect issues before users notice them and optimize your performance with data you can trust.
