
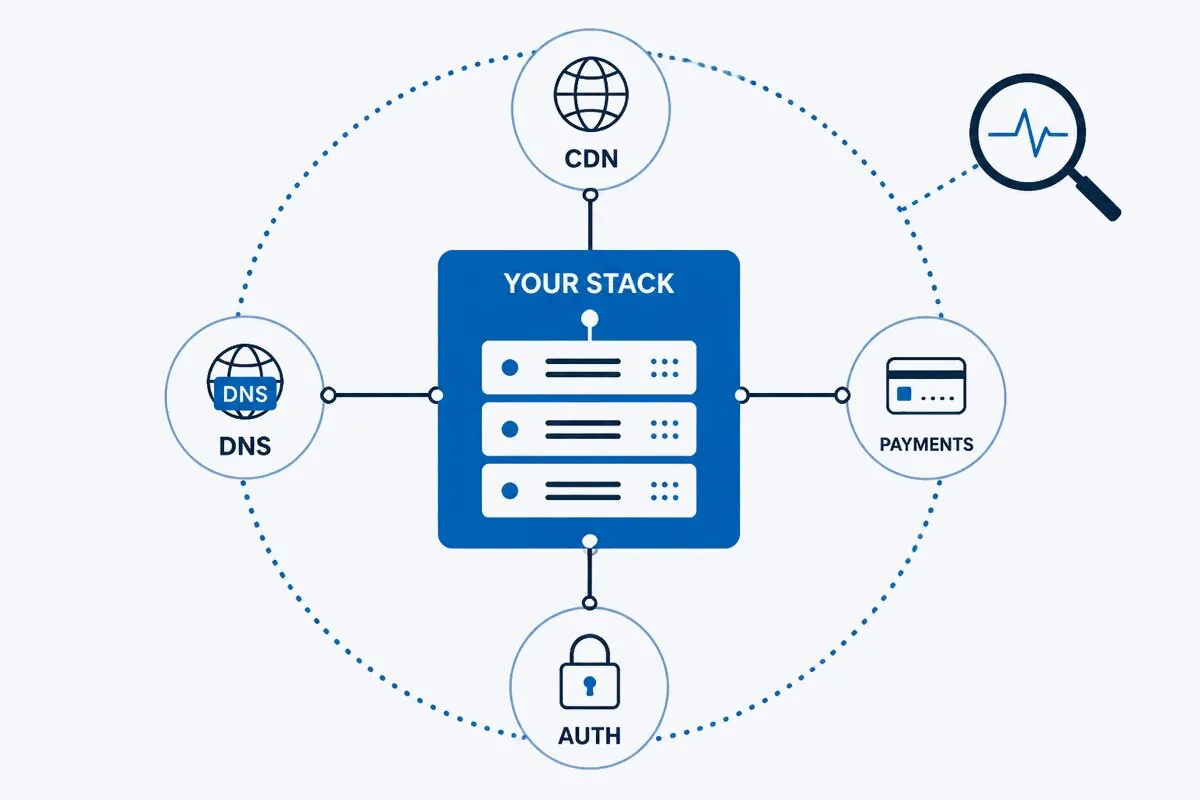
The seven SRE principles come from a company that owns its data centers, its network, its load balancers, and every line of code in between. Your stack probably doesn’t look like that. A good chunk of what your users experience runs on infrastructure you can’t SSH into: a CDN, an auth provider, a payment gateway, DNS, a tag manager, a partner API.
That gap matters, because the principles still hold outside Google. But several of them change shape once the component that’s failing isn’t yours to fix. An error budget behaves differently when a third of it gets spent by someone else’s outage. The four golden signals look different from outside the firewall than they do from inside it. And the risk you can’t engineer away, you have to measure.
This article walks through all seven principles the way the Google SRE book defines them, then adds the part the book skips: what each principle looks like when you depend on services you don’t control. If you’re newer to the role itself, start with what a site reliability engineer does and come back.
What Are the SRE Principles?
SRE principles are the working rules Google codified for running reliable systems at scale: embracing and managing risk, service level objectives, eliminating toil, monitoring, automation, release engineering, and simplicity. Together they answer one question: how reliable does this service need to be, and what’s the cheapest sustainable way to keep it there?
The list hasn’t changed since the SRE book was published in 2016. What has changed is the average stack. Microservices, SaaS dependencies, and third-party scripts mean part of your reliability now lives in other companies’ hands. Each section below covers the principle as written, then what breaks when the dependency isn’t yours. At the end, a short list of SRE best practices drawn from all seven.
Principle 1 – Embracing and Managing Risk
The Google formulation: 100% reliability is the wrong target. Users reach you through networks and devices that fail on their own, so past a certain point extra nines cost real money and nobody can tell the difference. Pick a reliability target the business can defend, and treat the gap between that target and perfection as a budget you’re allowed to spend on shipping features. The Embracing Risk chapter lays this out in detail.
Inside Google, that works because risk is a dial they can turn. More replication, more redundancy, slower rollouts: spend money, get nines.
Outside Google, part of the dial isn’t connected to anything. You can’t add a replica to your payment gateway. You can’t tune the failover behavior of your DNS provider. Their reliability is a contract term, not an engineering parameter.
So the principle changes shape: for the components you own, manage risk by engineering. For the components you don’t, manage it by measurement. You need to know your auth provider’s real availability as measured from your users’ side of the internet, not the number on their status page. Status pages routinely post green during partial outages, and a dependency that’s up in its own data center can still be unreachable from yours. Independent measurement is what turns “we think the CDN is flaky” into a renewal conversation backed by data. This is the first job Dotcom-Monitor does here: put an external check on every critical dependency. A DNS check against the provider’s nameservers, an HTTP(S) check on the CDN edge, an API check against the payment gateway. Each builds its own uptime and response-time record from a global network. And where the numbers justify it, route around the risk: a second DNS provider, a fallback payment path, a cached copy of the third-party script.
How to Implement Risk Management
- List every dependency a user request touches (DNS, CDN, auth, payments, third-party tags) and mark which ones you can engineer and which you can only measure.
- Create a Dotcom-Monitor device for each one you can only measure: a DNS task pointed at the provider’s nameservers, an HTTP(S) task on the CDN edge, a web services task against the payment or auth endpoint.
- Run those checks from several monitoring locations in your users’ regions, so a regional failure at the vendor can’t hide behind a healthy region.
- Bring each device’s uptime report to the vendor conversation, and add routing fallbacks (secondary DNS, backup payment path) only where that data says the risk justifies the cost.
Principle 2 – Service Level Objectives (SLA, SLO, SLI)
Three terms get mixed up constantly, so here’s the breakdown:
- SLA (Service Level Agreement): the contract. What you promise customers, with penalties attached if you miss it.
- SLO (Service Level Objective): the target you set for a service level indicator, typically internal and tighter than the SLA so you breach your own alarm before you breach the contract. 99.9% uptime, checkout completes in under 3 seconds, that kind of goal.
- SLI (Service Level Indicator): the measurement itself. The actual uptime number, the actual response time, the error rate you observed.
The SLI measures, the SLO targets, the SLA promises. Everything downstream, including the uptime and SLA reports you hand a customer, depends on the SLI being trustworthy.
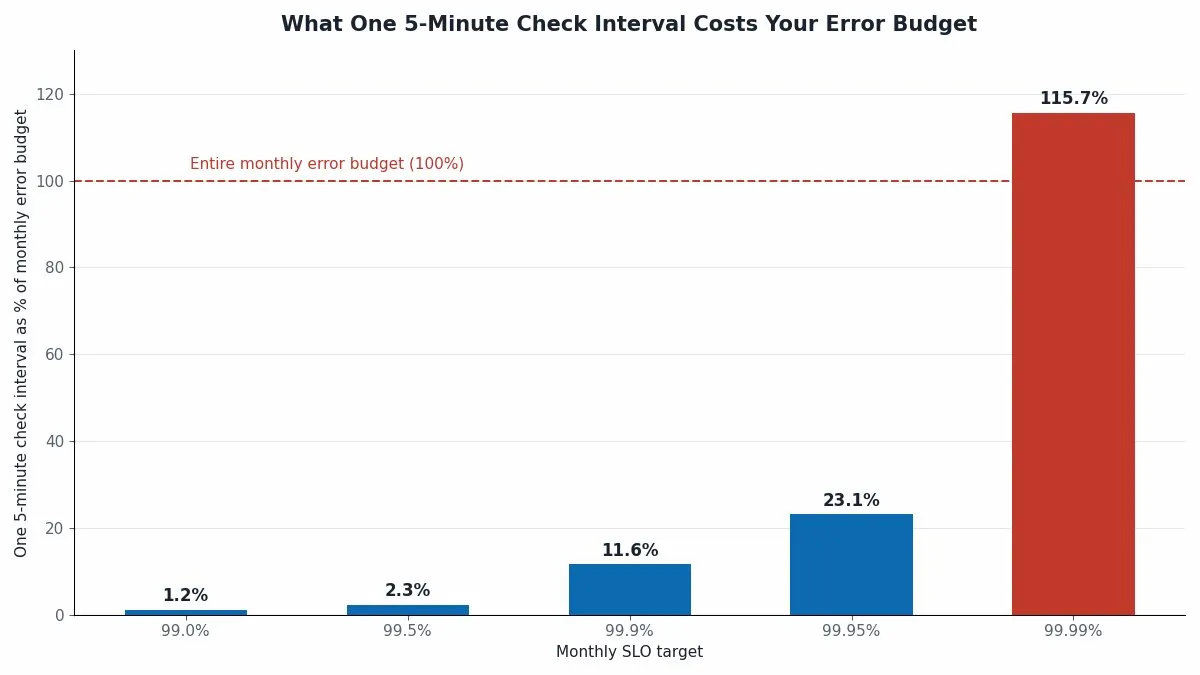
And this is where most teams have a blind spot: an error budget is only as precise as the measurement behind it. If your checks run every 5 minutes, every recorded outage has a start and an end that are each only known to within 5 minutes, and outages shorter than the interval can end without ever being seen. Here’s what that does to a monthly error budget across common SLO targets, using a 30-day month (43,200 minutes):
| Monthly SLO | Error Budget (30-Day Month) | Smallest Outage a 5-Min Check Reliably Sees | One 5-Min Quantum as % of Budget |
|---|---|---|---|
| 99.0% | 7h 12m (432 min) | 5 min | 1.2% |
| 99.5% | 3h 36m (216 min) | 5 min | 2.3% |
| 99.9% | 43m 12s (43.2 min) | 5 min | 11.6% |
| 99.95% | 21m 36s (21.6 min) | 5 min | 23.1% |
| 99.99% | 4m 19s (4.32 min) | 5 min | 116%, more than the whole budget |
You cannot measure a 99.99% monthly SLO with 5-minute checks. A single check interval is larger than your entire monthly error budget.
The probability math is just as unforgiving. With a check interval of I minutes, a random outage lasting D minutes (where D is shorter than I) gets caught with probability of roughly D/I, assuming the outage start is independent of the check schedule. So a 4-minute outage against a 5-minute interval gets caught about 4 times in 5, and the remaining 1-in-5 chance is the outage falling entirely between two checks and never being recorded. And for outages that outlast the interval, mean detection delay is about half of it, so 5-minute checks add an average 2.5 minutes before anyone even knows.
One caveat: the table assumes a single scheduled check and interval-based downtime accounting. Multi-location confirmation and request-based SLIs change the details, not the sampling problem.
Short outages aren’t an edge case, either. Across the outages Dotcom-Monitor detects, about 38% resolve inside 5 minutes. These are mostly network routing flaps, reboots, restarts, and fail-overs that fix themselves before anyone could reasonably intervene, and our Response Filter holds back the alert for exactly that reason. But filtered from alerting is not filtered from the record: that downtime still counts against the SLA, internal or vendor, and still has to be accounted for. Of the outages that do alert, more than 56% are resolved within 15 minutes of the first notification, around 18% run past an hour, and roughly 3% drag past 24 hours. The split shifts a little between service types, but the shape holds: more than a third of all outages sit in the bucket a 5-minute check can barely see. This is why check frequency is a measurement decision, not a cost line: at 1-minute intervals, the measurement quantum drops to 2.3% of a 99.9% monthly budget instead of 11.6%, and the short outages that dominate incident counts start showing up in your record. It’s why Dotcom-Monitor runs checks as often as every minute and builds its SLA reporting on the same record: the compliance number you show a customer is only as trustworthy as the sampling behind it.
How to Implement Service Level Objectives
- Define two or three SLIs your users would recognize, like uptime measured from a real browser or checkout time, and make a Dotcom-Monitor check the source of record for each.
- Set each SLO tighter than the SLA it protects, then set the device’s check frequency to match the tier: per the table above, anything past 99.9% needs 1-minute checks.
- Schedule uptime and SLA reports to the people who own the SLA conversation, so the compliance number comes from the same check record as the alerts.
- Agree upfront on what happens when the error budget runs out, while nobody is arguing about a specific incident.
Principle 3 – Eliminate Toil
Toil is manual, repetitive work that scales with the size of the service and produces no lasting value. The Eliminating Toil chapter set a famous cap: SREs should spend no more than half their time on it, and the rest on engineering that makes the toil go away.
Abstract definitions make toil easy to nod at and hard to find. So name it. In most teams it looks like this:
- Someone logs in every morning to confirm the checkout flow still works.
- Someone hand-tests the signup form after every deploy.
- Someone keeps a calendar reminder for SSL certificate expiry dates.
- Someone hits a partner API by hand whenever support tickets spike, to see whether the problem is on your side or theirs.
Every one of those is a scripted transaction waiting to be written, and it’s where Dotcom-Monitor earns its keep most directly. A script recorded with EveryStep, its point-and-click transaction recorder, walks the same checkout path every few minutes from a real browser and raises an alert the moment a step fails. Its certificate checks watch expiry dates without the calendar. Its API checks poke the partner endpoint on a schedule and keep the response-time history that settles the “us or them” argument in one glance.
The test for what to automate first isn’t sophistication, it’s recurrence. The check a human performs daily is the check a machine should perform every minute.
How to Implement Toil Elimination
- Keep a one-week log of every manual check anyone on the team performs; recurrence, not difficulty, decides what gets automated first.
- Record the most frequent one as an EveryStep script by clicking through the flow once, then let it run every few minutes instead of once a morning.
- Replace the certificate expiry calendar with Dotcom-Monitor SSL certificate checks, and put partner APIs on scheduled web services checks so nobody owns them by memory.
- Track the hours of manual checking removed each quarter, so the automation work stays visible and funded.
Principle 4 – Monitoring and the Four Golden Signals
The Monitoring Distributed Systems chapter names four golden signals: latency, traffic, errors, and saturation. Watch those four and you’ll catch most of what goes wrong.
The chapter nods at black-box monitoring, but most teams end up instrumenting all four signals from inside the system. Watch them from where your users sit instead, and three of the four change:
| Signal | Inside (APM, Prometheus, Server Metrics) | Outside (External Synthetic Checks) |
|---|---|---|
| Latency | Application and database time. Excludes everything that happens before the request reaches your servers. | DNS + TCP + TLS + CDN edge + transfer + render. The number the user actually feels. |
| Traffic | Requests per second, fully visible. | Not observable externally. A synthetic check generates its own traffic; it can’t see yours. |
| Errors | 5xx rate, exception counts. | The HTTP 200 that returned a broken checkout. The third-party script that failed silently. The page element that never rendered. |
| Saturation | CPU, memory, queue depth, connection pools. | Not directly measurable. Inferred from latency degrading as load rises. |
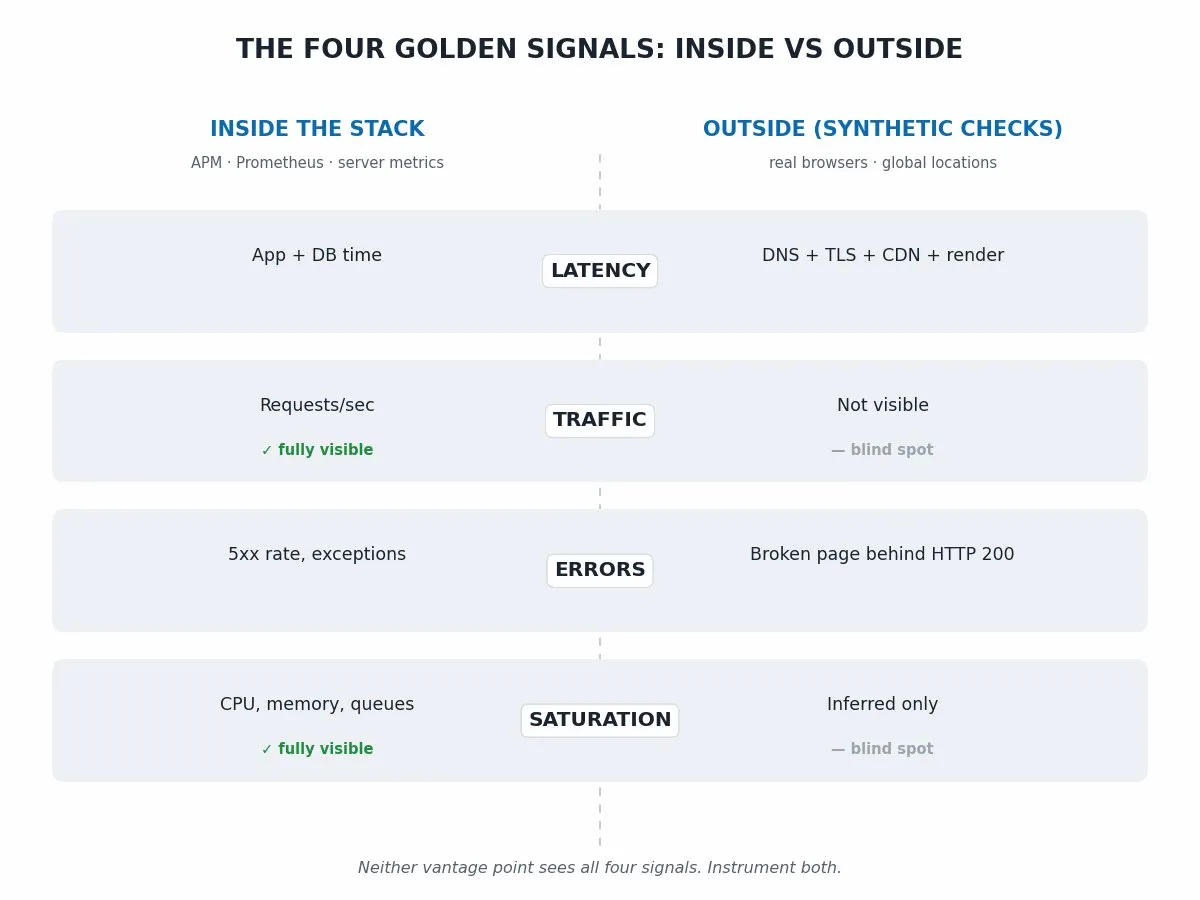
Read the table honestly and the conclusion isn’t “outside is better.” It’s that neither vantage point sees everything. Traffic and saturation belong to your internal tooling: Prometheus, Datadog, New Relic, whatever your APM stack is. Latency as experienced and errors as experienced belong to external synthetic monitoring. That’s the half Dotcom-Monitor covers. Real-browser checks from a global network load your pages the way users do and time the whole path: DNS resolution, TLS handshake, CDN edge, page render, scripted user steps. Protocol checks for HTTP(S), API, DNS, TCP, and ICMP watch the dependencies around the page. The two aren’t competing; they’re different views of the same four signals, and you need both.
The practical rule: every signal your users can feel needs at least one measurement taken from where your users are. An APM dashboard showing green while the CDN serves cached error pages to half of Europe is not a hypothetical. It’s the standard failure mode of inside-only monitoring.
How to Implement Monitoring
- Keep traffic and saturation on your APM or Prometheus stack; give latency and errors to Dotcom-Monitor real-browser checks running from the regions your users are actually in.
- Set up content assertions on those checks, not just status-code checks, so the broken checkout behind an HTTP 200 fails the way it fails for a user.
- Script the transactions that matter (login, search, checkout) with EveryStep, so the monitoring walks the same path your users do.
- Compare the inside and outside numbers regularly; the gap between them is your CDN, DNS, and third-party layer.
Principle 5 – Automation
The SRE case for automation is consistency at scale. Humans forget steps, machines don’t, and any response that has to happen at 3 a.m. should not depend on a human being sharp at 3 a.m.
The part that changes outside Google: automation is only as good as the signal that triggers it. Failover scripts, rollback jobs, and auto-scaling rules all fire on a detection event, so every minute of detection delay is a minute added to every automated response you’ve built. The math from the SLO section applies directly: an automated failover triggered by a 5-minute check hands the outage an average 2.5-minute head start.
And some automation triggers can only come from outside. A script that fails over to a backup payment provider needs to know the primary is failing for users, not just that its health endpoint answers pings from inside the same network. Dotcom-Monitor closes that loop by firing alerts and webhooks off its external checks, so the failover triggers on what users are experiencing rather than on what the health endpoint claims.
How to Implement Automation
- Start with the responses you already perform by hand during incidents: restarts, failovers, rollbacks.
- Wire Dotcom-Monitor alert webhooks into the scripts that perform them, so the trigger is an externally confirmed failure rather than an internal health endpoint.
- Use alert escalation groups so the first notification reaches the person or system that acts, not a shared inbox nobody watches at 3 a.m.
- Let the Response Filter absorb self-resolving blips so they don’t fire your automations, and review triggers quarterly against false-positive rates.
Principle 6 – Release Engineering
Release engineering is the discipline of building and shipping software the same way every time: versioned builds, repeatable pipelines, rollbacks that work because they’ve been rehearsed.
Modern CI/CD covers most of that inside the pipeline. Tests pass, artifacts build, deploys go out behind flags. What the pipeline can’t tell you is whether the system works for users after the deploy lands. CI proves the build; on its own it says nothing about the DNS record that didn’t propagate, the CDN cache serving the old bundle, the third-party tag that broke in combination with your new code, or the config value that only exists in production.
That’s the gap post-deploy verification fills. An EveryStep script that walks the critical path (load the page, log in, complete the transaction), run from Dotcom-Monitor’s network against production immediately after each release, is the only test that exercises what users actually get. Teams that run one treat it as the final stage of the pipeline: deploy, verify from outside, and only then mark the release done. If the check fails, the rollback fires while the blast radius is still measured in minutes.
How to Implement Release Engineering
- Version every build and make rollback a rehearsed, one-step action rather than an improvised one.
- Make an EveryStep transaction against production the final stage of the deploy pipeline, running from Dotcom-Monitor’s network so DNS, CDN cache, and third-party tags are part of the test.
- Point the check’s alert webhook back at the pipeline, so a failed post-deploy run becomes an automatic rollback signal instead of a ticket for the morning.
- Keep the same check running between releases; its history is your baseline for whether a deploy made things slower.
Principle 7 – Simplicity
The Simplicity chapter argues that reliability and complexity trade against each other: every component you add is a component that can fail, and software should be exactly as complex as its job requires.
Apply that to the monitoring stack itself, because monitoring is where complexity quietly accumulates. Teams end up with an APM tool, a log platform, an uptime pinger, a status-page service, and three dashboards nobody opens. Each tool alerts on its own schedule, and the combined result is alert fatigue: so many notifications that the one that matters gets swiped away with the rest.
A monitoring vendor telling you to run fewer monitoring tools is an unusual argument, which is exactly why it’s worth making. The simplicity test for a monitoring stack has two questions. First: for each thing you monitor, do you know which tool is authoritative when two of them disagree? Second: does every alert that fires have a person who acts on it? If a tool fails both questions for everything it watches, it isn’t monitoring, it’s noise with a subscription fee. Consolidating uptime monitoring, transaction, API, and infrastructure checks into one platform with one alerting path is a simplicity decision before it’s a purchasing one. That’s how Dotcom-Monitor is built: those checks in one place, one alerting path, working alongside the APM tool that watches the inside rather than replacing it.
How to Implement Simplicity
- Inventory your monitoring tools and write down, for each, the one thing it is authoritative for.
- Delete every alert that has no owner and no action attached; if nobody acts on it, it’s noise.
- Fold the external checks (uptime, page, transaction, API, infrastructure) into Dotcom-Monitor as one platform with one alerting path, and let your APM keep the inside.
- Repeat the audit yearly; monitoring stacks regrow complexity on their own.
SRE Best Practices
The principles say what to aim for. These are the practices that hold up in teams that don’t own their whole stack:
- Set SLOs on what users experience, not what servers report. “Checkout completes in under 4 seconds from a real browser” is an SLO users would recognize. “API p95 under 200ms” is an input to it.
- Match check frequency to your SLO. Per the error-budget table above: at 99.95%, one 5-minute quantum already eats 23% of the monthly budget, and at 99.99% it exceeds the budget outright. Treat 1-minute checks as the practical floor from 99.95% up.
- Monitor your dependencies like you monitor yourself. DNS, CDN, payment, auth: an external check per critical dependency, with its own response-time history. When their status page says green and your users say broken, this data settles the dispute.
- Write the error budget policy before you spend the budget. Agree in advance what happens when the budget is gone: feature freezes, reliability sprints, postmortem priorities. A budget without a policy is a chart nobody acts on.
- Rehearse incident response before you need it. On-call rotations, escalation paths, and blameless postmortems are covered in depth in our SRE incident management guide.
- Keep the tool count honest. Audit the monitoring stack yearly against the two simplicity questions above. Our roundup of SRE tools covers the categories worth keeping.
- Make reliability reporting a habit, not a scramble. Scheduled uptime and SLA reports mean the compliance conversation starts from shared numbers instead of a log-diving exercise after a dispute.
The Bottom Line
The seven SRE principles survived the trip out of Google. What didn’t survive is the assumption behind them: that the team applying them controls the stack they’re applied to. You don’t, and that changes the work. Risk you can’t engineer away has to be measured. Error budgets are only as real as the check interval behind them. Internal tooling owns traffic and saturation; the user-experienced side of latency and errors only shows up from an external vantage point. Post-deploy verification has to run from outside, because that’s the only place the whole system exists.
The common thread is measurement from the outside. Every principle, applied to a stack full of components you don’t own, ends up needing an independent vantage point: per-dependency checks for risk, 1-minute intervals for error budgets, real browsers for the golden signals, scripted transactions for toil and releases, one platform for simplicity. That’s the role Dotcom-Monitor plays across all seven. Not a tool preference—it’s what the principles require once the stack stops being yours.
Measure the Stack You Don’t Own
Run real-browser checks at 1-minute intervals from a global network, and see what your error budget has been missing. Start a free trial.
