Dotcom-Monitor continues to add advanced features and functionality to its unparalleled monitoring and testing platforms. The most recent enhancement to announce is console logging, a boost to the EveryStep Web Recorder.
Dotcom-Monitor’s EveryStep Web Recorder is a dominant no-code tool used for creating scripts that can be used for synthetic user testing, load and stress testing, and monitoring of websites and web applications to ensure consistent experience throughout a user’s journey on your site.
Previous iterations of EveryStep Web Recorder produced stellar scripts in use around the globe, yet, there was something missing. While the scripts were powerful they monitored page load errors—checking that a page loaded and rendered correctly. It is possible that a site, page, or application view could load and render as expected, but underlying JavaScript functionality may not be working as expected, unidentified security issues may exist, or any number of other issues could be putting your site at risk. Until now this would go unnoticed by the EveryStep Web Recorder.
The addition of console logging within EveryStep allows you to generate alert notifications or simply log issues on your site so you can take steps to make sure users can expect the best possible experience.
Implementing Console Logging
You are likely familiar with seeing console errors like: Uncaught SyntaxError: Unexpected token, TypeError: ‘undefined’ is not an object, TypeError: $ is not a function, Uncaught TypeError: Cannot set property ‘innerText’ of null, and countless others.
Just like you are used to using the developer console (F12) within the browser while developing, troubleshooting, and debugging code for your web app, you can extend the same power of the console to your monitoring and testing.
Within your EveryStep script, simply right-clicking in the script will open the context-sensitive menu. You will see Console at the bottom of the menu. From here you can select Raise Error, Log, Skip, and Clear as options. You will want to be sure to right-click in the script where you want to place the Console statement and then select the appropriate option.
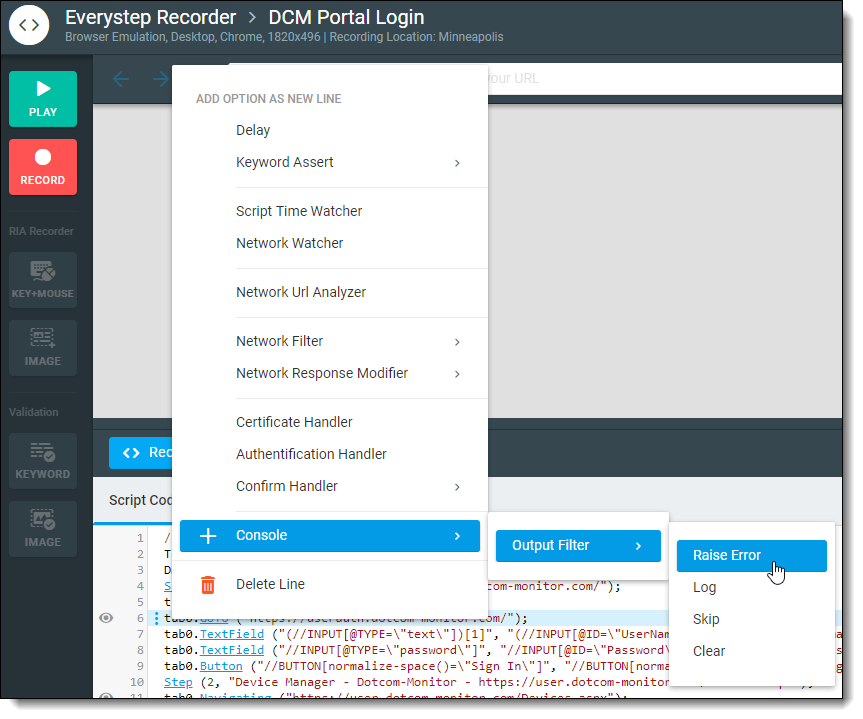 Selecting Raise Error will generate an error alert and initiate messaging that has been configured for your monitoring device such as sending SMS text messages, emails, or phone call alerts in the event a console error occurs. Selecting Log will identify errors the same as Raise Error, but it will not place the device in an error state and it will not initiate alert messaging. It will merely log the error within the device reporting such as in the waterfall chart.
The Skip option can be used to ignore console errors on pages or elements with which you do not have concerns about; and the Clear option will clear the console log.
Console Logging Options
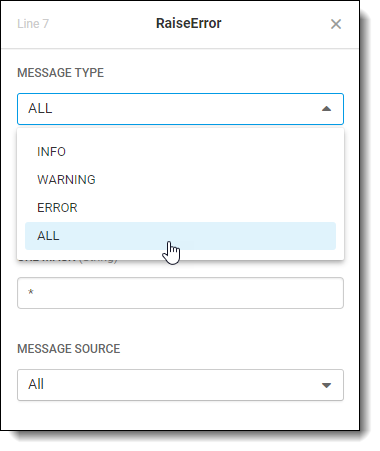
After inserting a console logging command into your script, you can further define exactly what types of console messaging on which you would like to be notified. The default console filter is to note all console output. You can choose Info, Warning, or Error logs if you would like to know about only specific information.
The Message Mask filter allows you to customize logs or errors to specific information such as SyntaxError or TypeError: Cannot read property if that is what you are looking for. You can also filter console log information for specific URLs by using the URL Mask field.
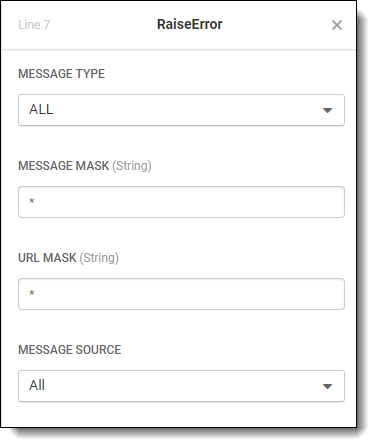
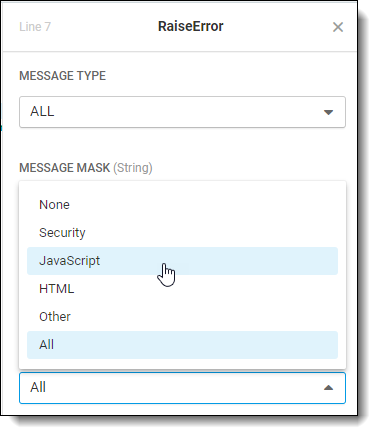
Beyond message type, message mask, and URL you can also configure the message source to: Security, JavaScript, HTML, Other, or All console log messages. The default is set to All.
Custom Log Messaging
You can add to the power of your monitoring and testing script created with EveryStep Web Recorder by creating your own custom console messages. Using the console.error() method within your code you have the ability to generate your own alerts and logs within your configured monitoring which can be incredibly helpful.
The console.error() method writes an error message to the console similar to console.log() but it will style the message as an error and include a stack trace from where the method was called. The will be recognized and acted upon by the Console Logging feature in your EveryStep script!
For any additional questions regarding the EveryStep Web Recorder Console Logger, please reach out to your Dotcom-Monitor representative.