Let’s face it – the ideal load test emulates real world traffic, yet most load testing software doesn’t come close. A series of GET requests from an in-house server can’t possibly replicate what actually happens when a website sees a sudden increase in users from all over the world. Held back by budget and infrastructure restrictions, some organizations have been forced to settle for load tests that paint an incomplete picture. With that option, you might be ready for a big product launch or viral success, but you can’t be completely sure.
Today we’ll be reviewing LoadView, an on-demand load-testing platform from Dotcom-Monitor that makes realistic load testing possible without an up-front investment in hardware or software infrastructure. Thanks to cloud-based virtual servers, LoadView can send traffic to your site or application from around the world. Since you only pay for the server time you actually use, this is a much more practical and budget-friendly option than maintaining your own load-testing platform.
This review will focus on performing a simple load test with LoadView.
Creating a Script
LoadView can perform very basic load testing by itself, but for more meaningful testing, you’ll need to download and install the EveryStep script recording tool. That process takes less than five minutes and is well worth the effort.
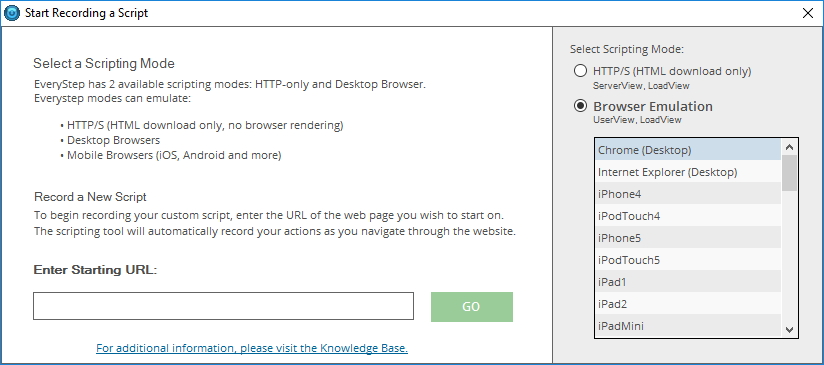
EveryStep allows you to easily record test scripts by pointing and clicking. To start, you enter your starting URL and select which browser you want to emulate in this test. EveryStep currently offers a choice of over 42 browser emulations – everything from Chrome and Internet Explorer to iPhone, Google Nexus, and Samsung Galaxy. This breadth of options allows for impressively thorough load testing.
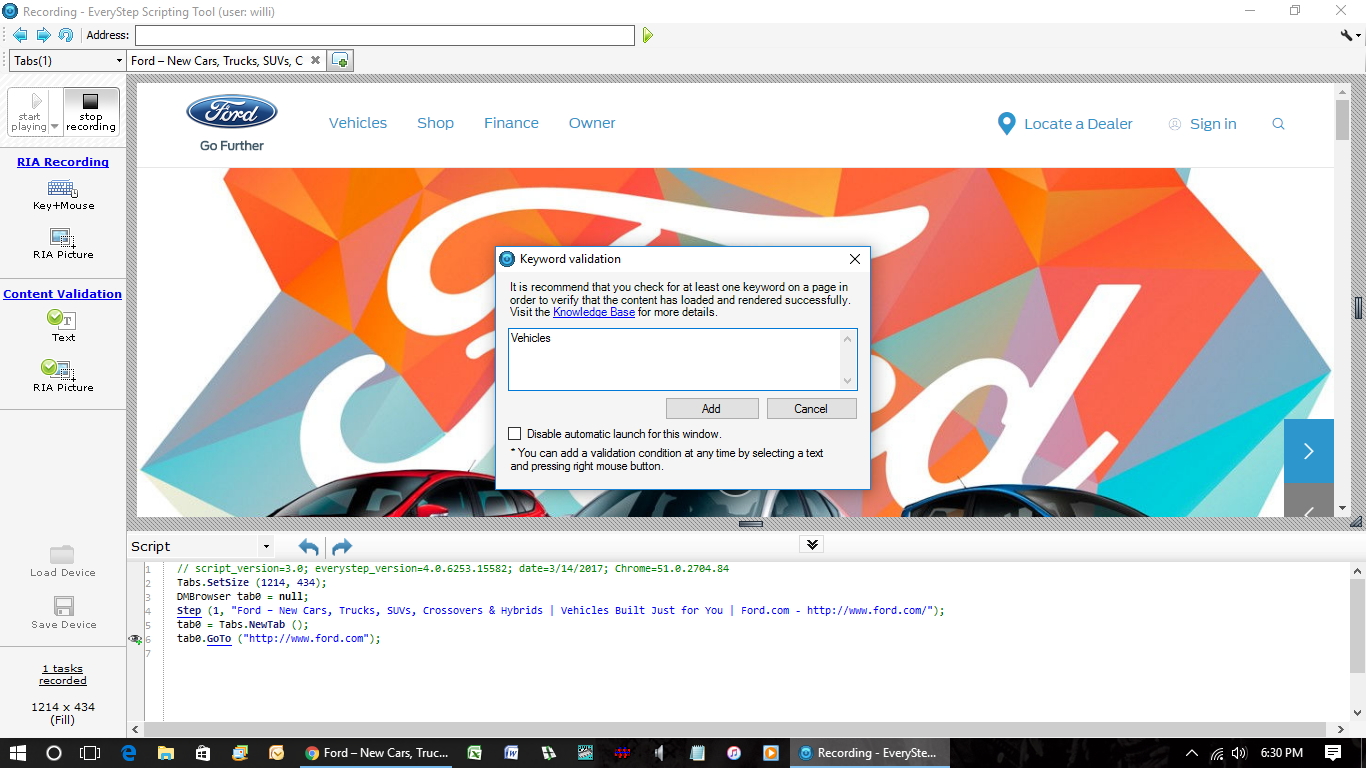
Recording a test script in EveryStep is quick and straightforward. Just click around the site and EveryStep logs your every move. Navigating to a new web page while recording brings up a prompt to add content validation. (EveryStep also offers the option to disable automatic launch of this window if you prefer.) You have the option to specify text or an image to validate – a welcome bit of flexibility.
Stop recording, and EveryStep prompts you to run the script to check for errors before saving or uploading the script. Be sure to save the device to LoadView Stress Testing and now UserView Monitoring, the other testing solution that interfaces with EveryStep.
EveryStep makes recording test scripts easy and uncomplicated, so you can quickly move on to setting up and performing the test.
Setting Up the Test
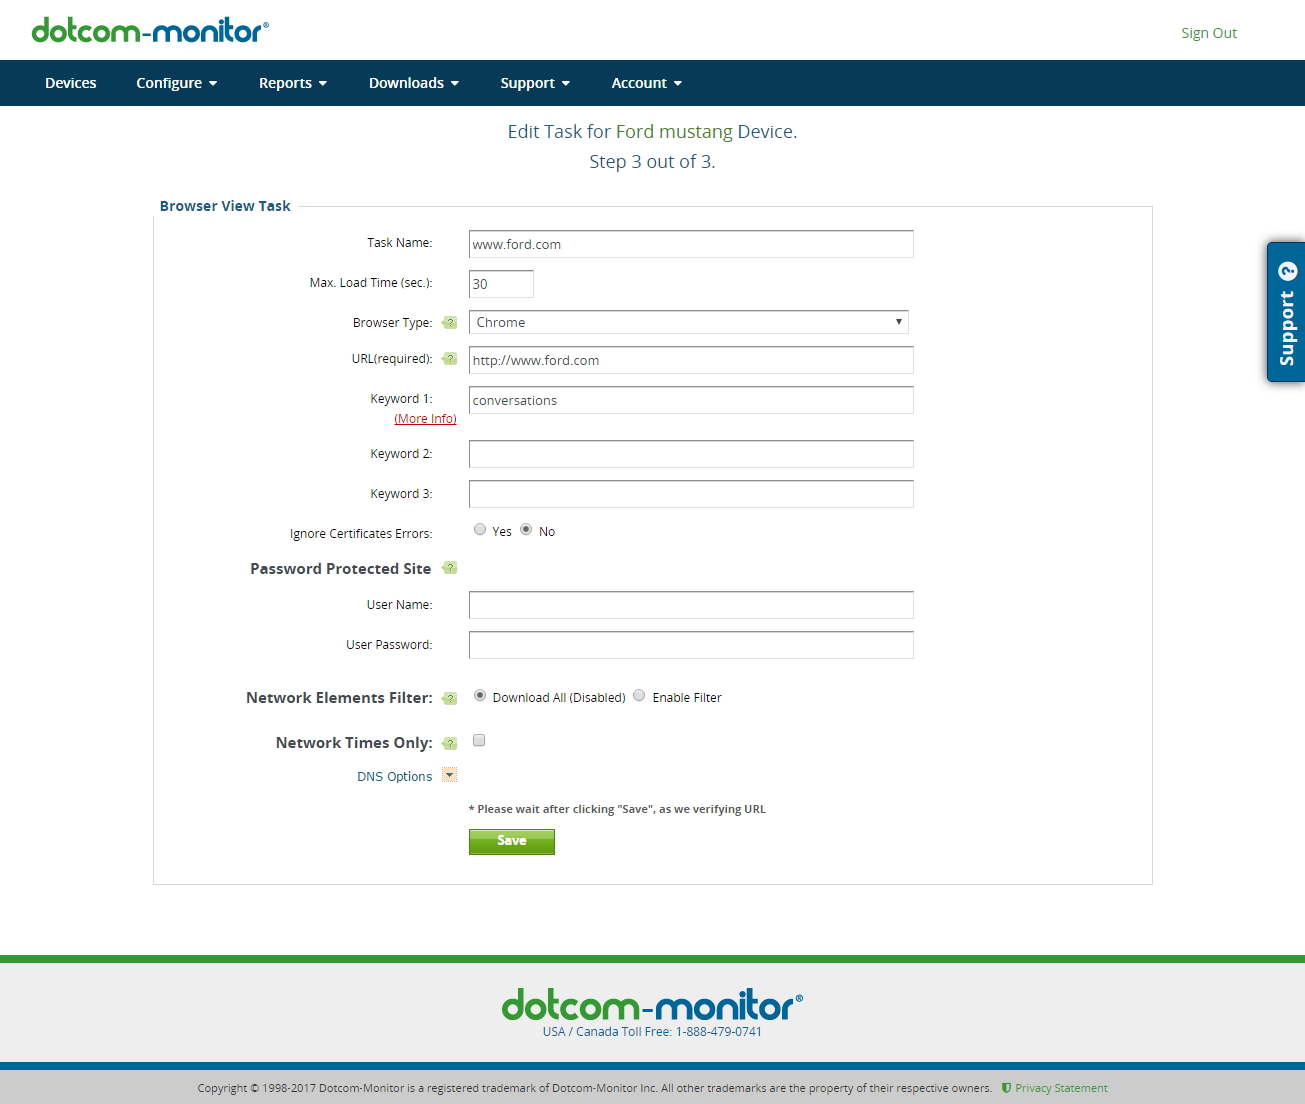
Once you’ve uploaded your script to LoadView’s web application, you can specify some critical details, such as a password for login and maximum load time. Dotcom-Monitor supplies plenty of tooltips to walk you through each option.
One noteworthy feature is the Network Elements Filter. Instead of having to completely halt testing to address each error as it crops up, you can filter out the guilty element (such as images or flash) and continue load testing right away.

LoadView requires that you calibrate the test when you first set up the test, and once seven days have passed since the last calibration. It’s all done with the click of a single button. This process checks for errors and determines the Number of Virtual Users per Virtual Machine you need to perform a meaningful load test without over-burdening the CPU of any of the virtual machines. This ensures that the virtual servers don’t create any bottlenecks that would throw off your test results.
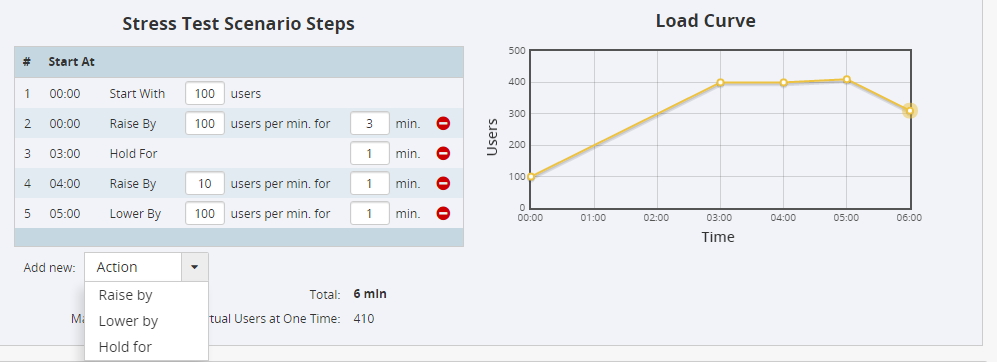
Building a load curve in LoadView is an easy process that comes with quite a bit of flexibility. With just a few clicks and keystrokes, you can steadily increase the number of users, hold steady, and reduce the load as the test progresses. Specify as many steps as you’d like and the Load Curve graph updates to reflect your changes.
The last step in the setup process allows you to specify the geographic zones you’d like to include in your test. Although LoadView offers access to cloud-based virtual servers around the world, this may be more than you’re looking for. If you’re testing a site that’s primarily for users in a specific region (say, the United States), there’s no need to test for traffic coming from somewhere else (like the European Union). And certainly no need to pay for it.
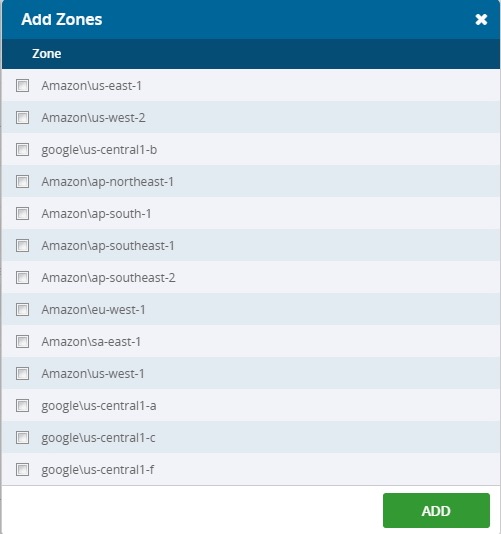
LoadView helpfully displays the cost of the test at the bottom of the Setup page so there are no surprises. You can save and exit, or continue to run the test.
Performing the Load Test
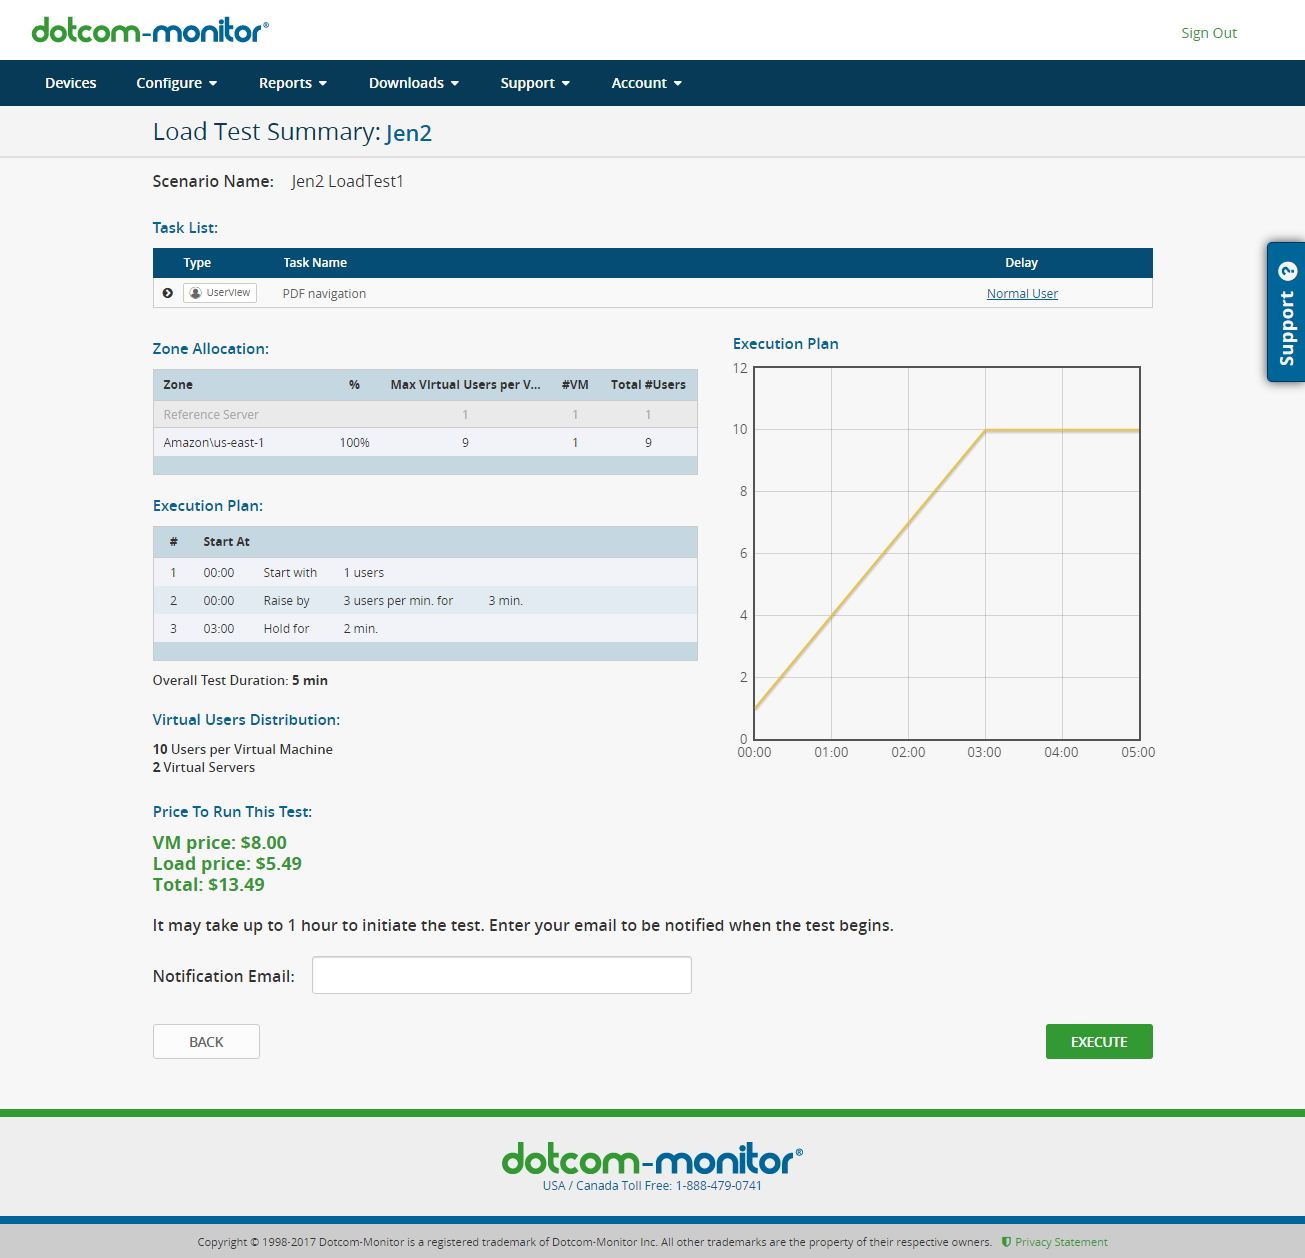
Once you’re done with Setup, LoadView takes you to a summary of your test. The summary displays everything you specified in the previous step as well as price. All you need to do here is supply an email address and click a button. LoadView will send a notification email when the test begins and ends. Tests typically run within ten minutes, although some tests may take up to an hour to initiate depending on the zones you selected.
It’s possible to watch the test results in real time, or you can wait for PDF reports to arrive via email.
Reading the Reports
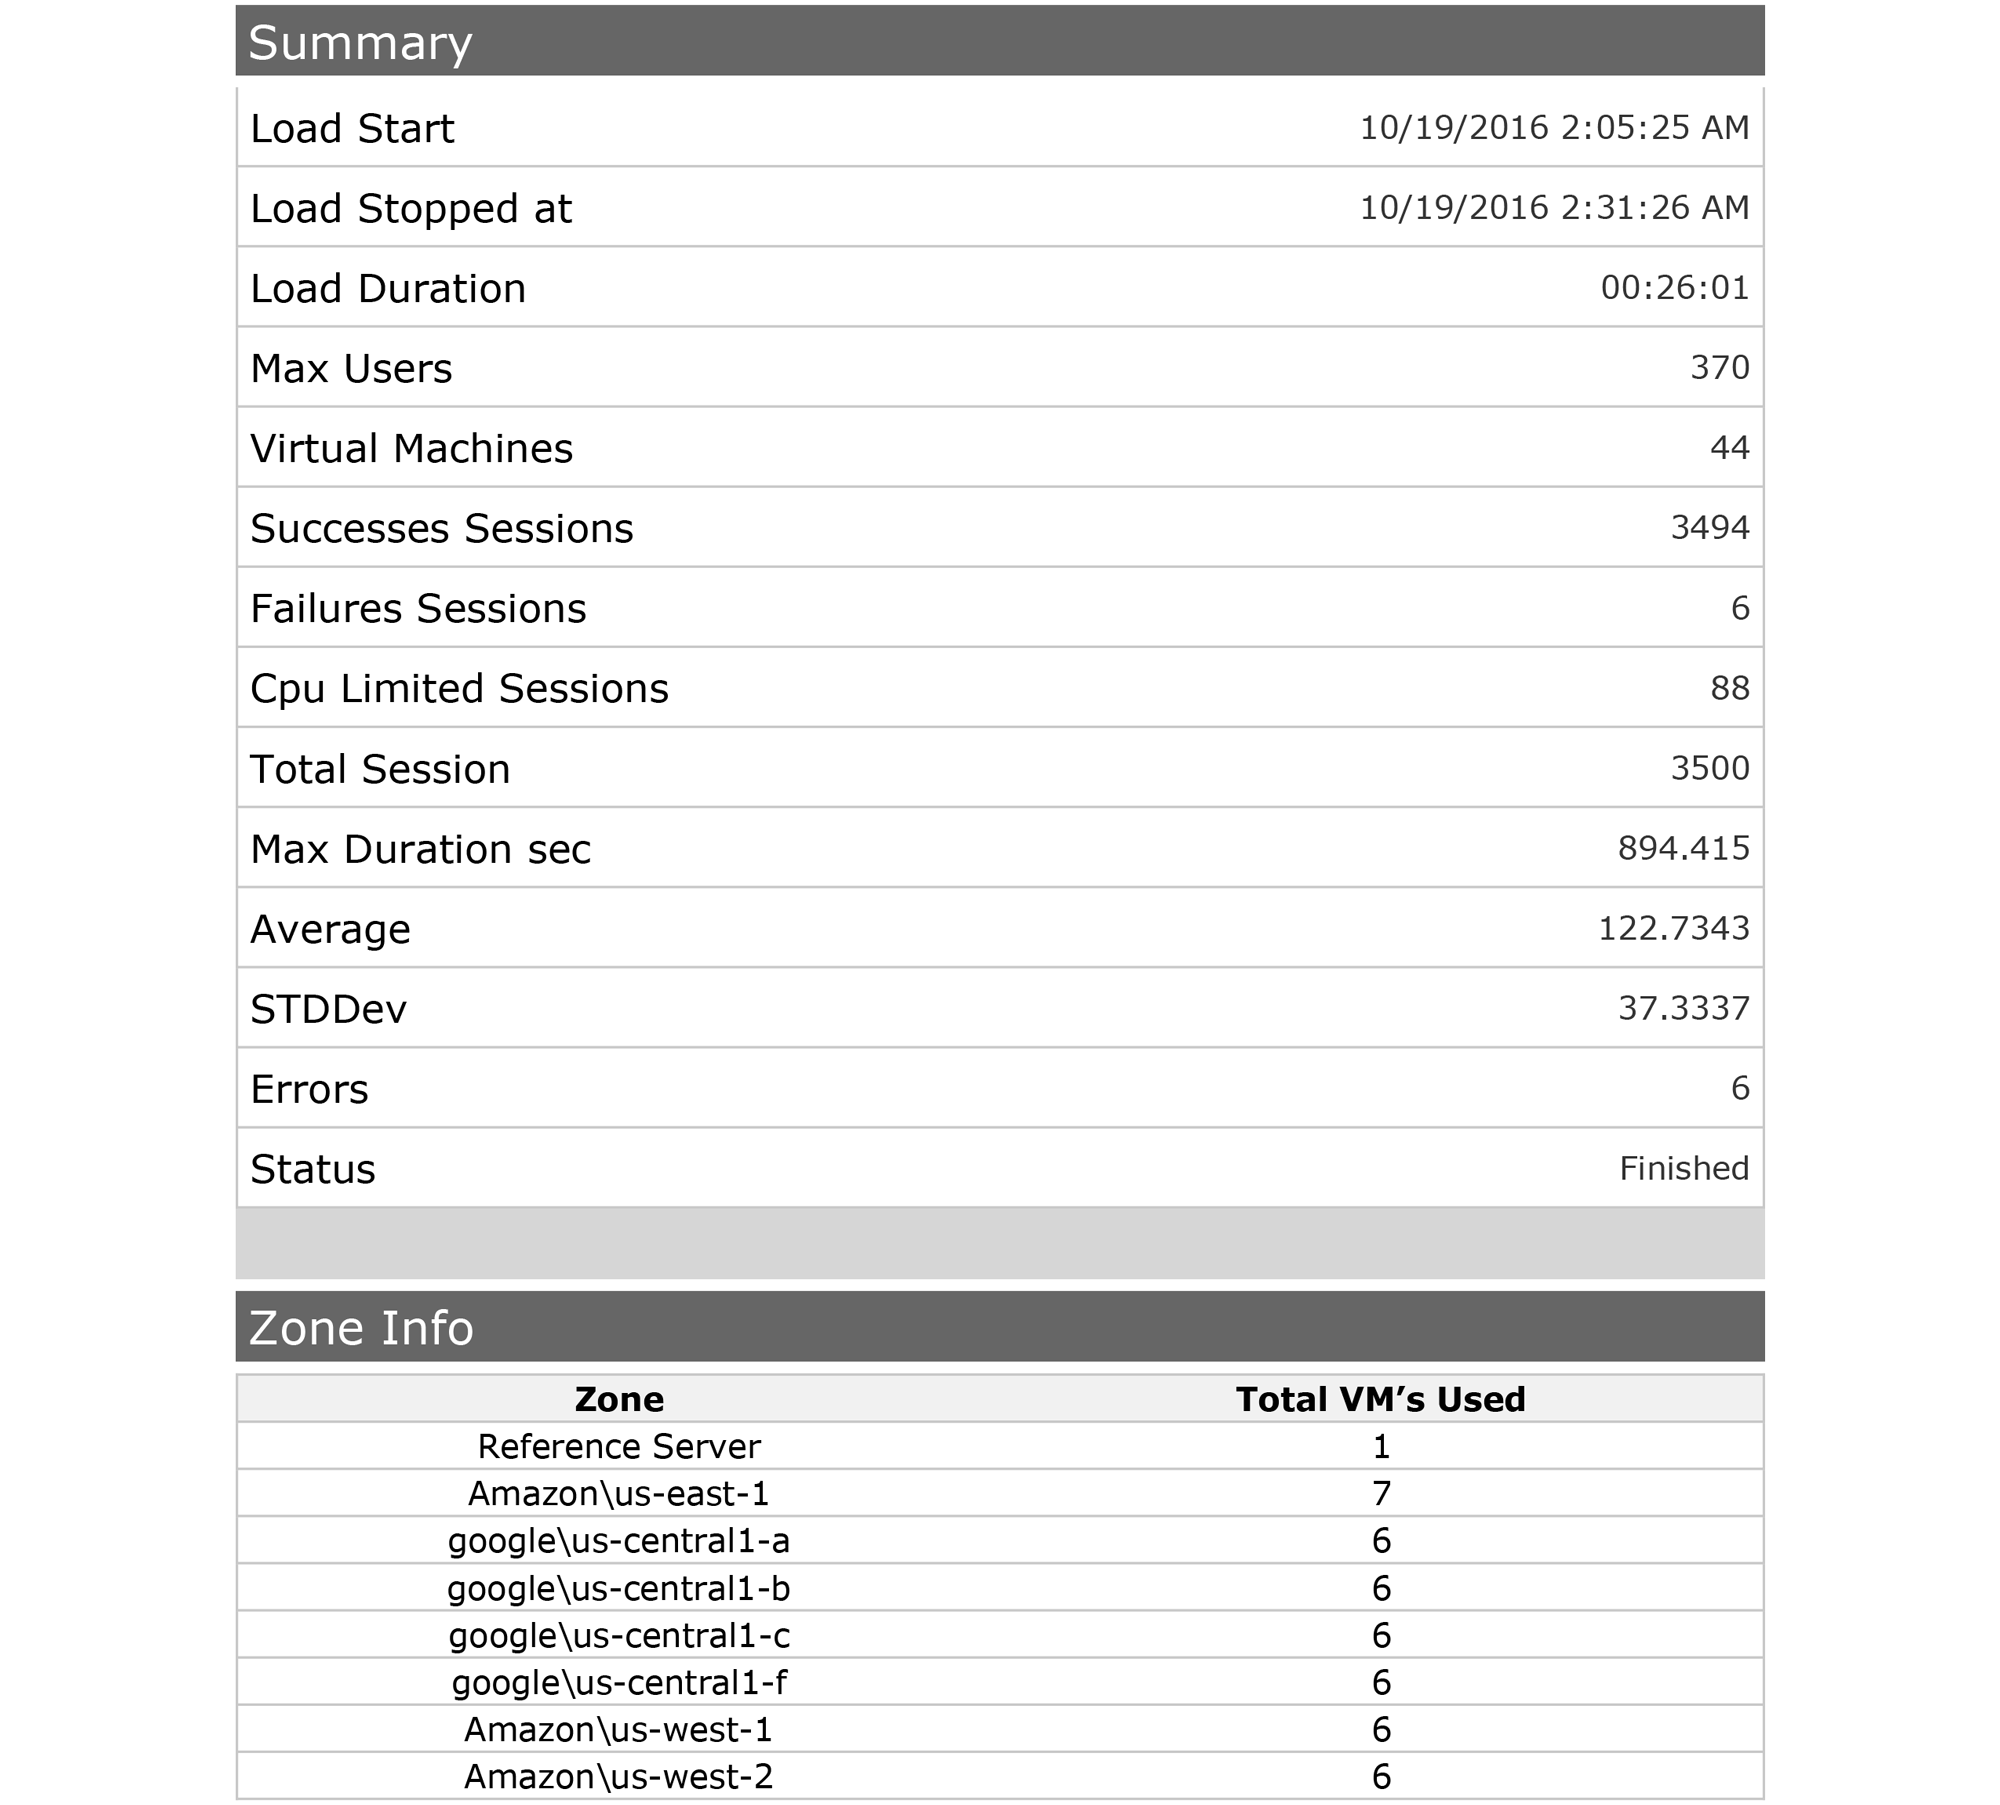
You can view your test results in LoadView’s web interface. From there you can download reports as a CSV or a PDF. LoadView also emails the PDFs when the test completes.
First up is a summary.
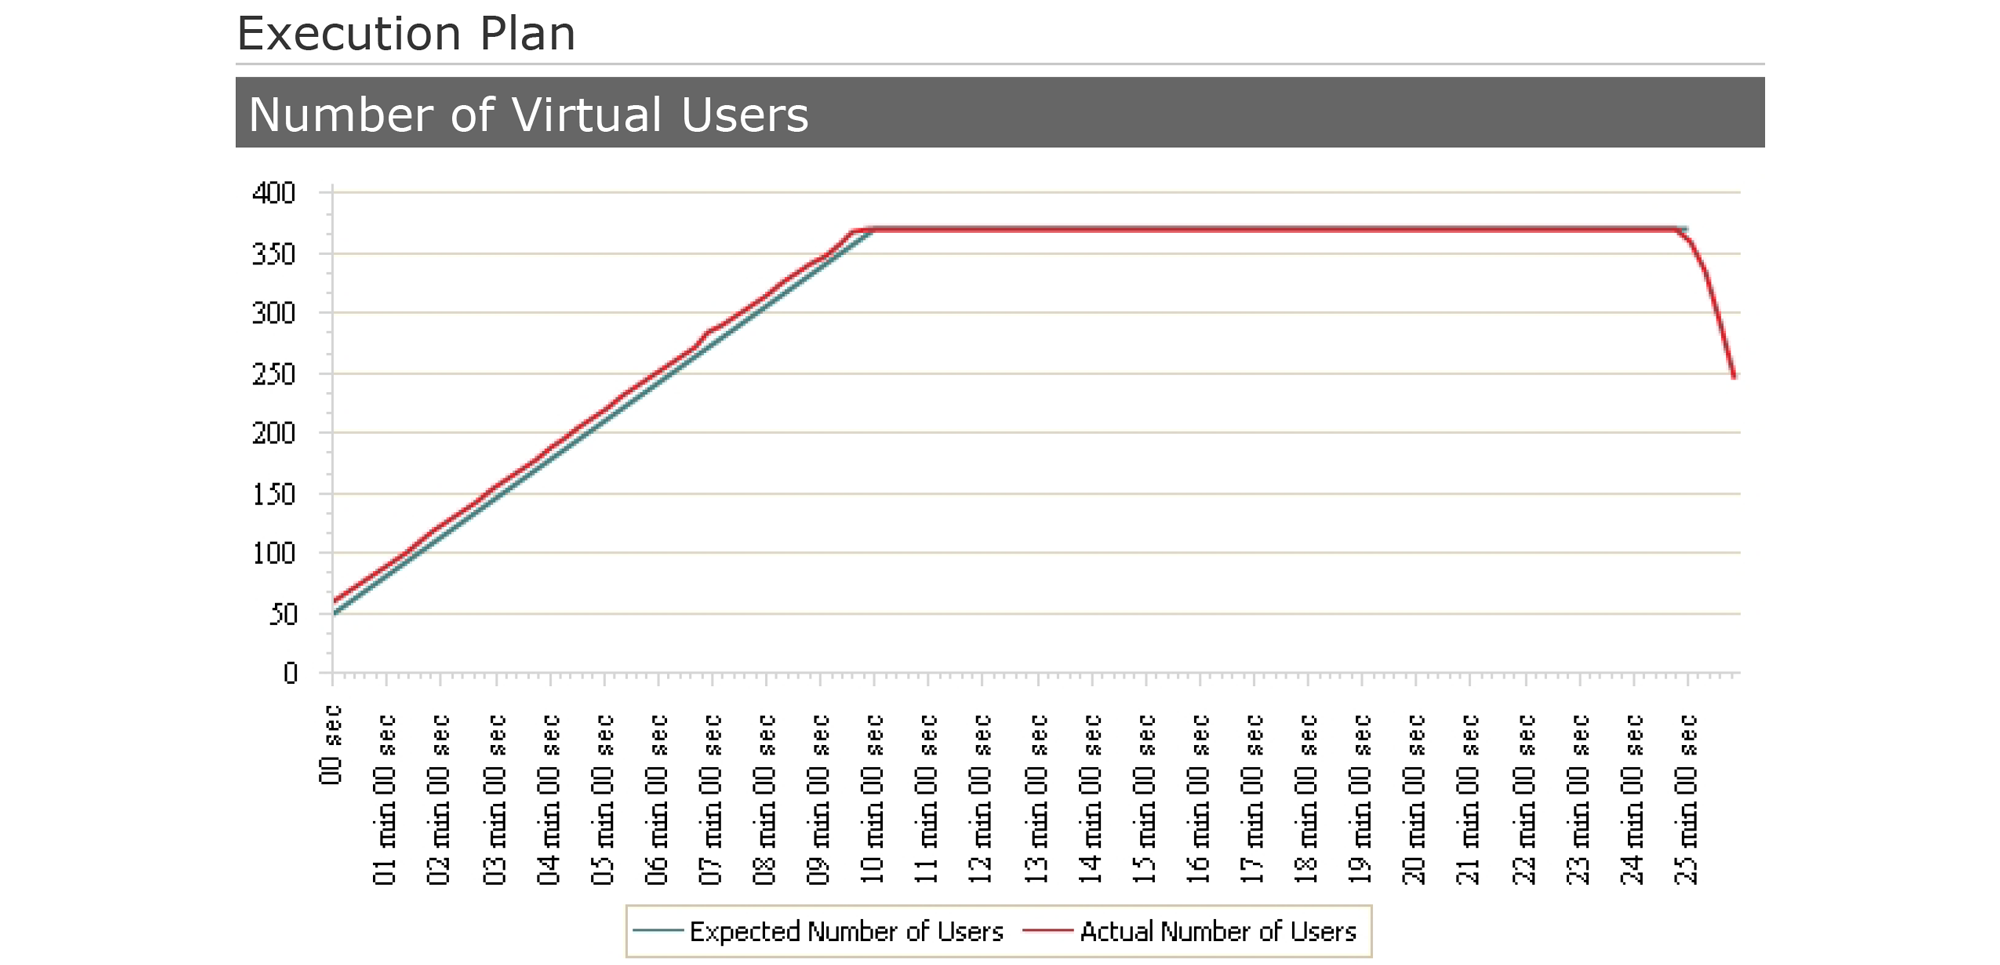
Next up is the Execution Plan, showing the number of virtual users you specified vs. the actual number of users.
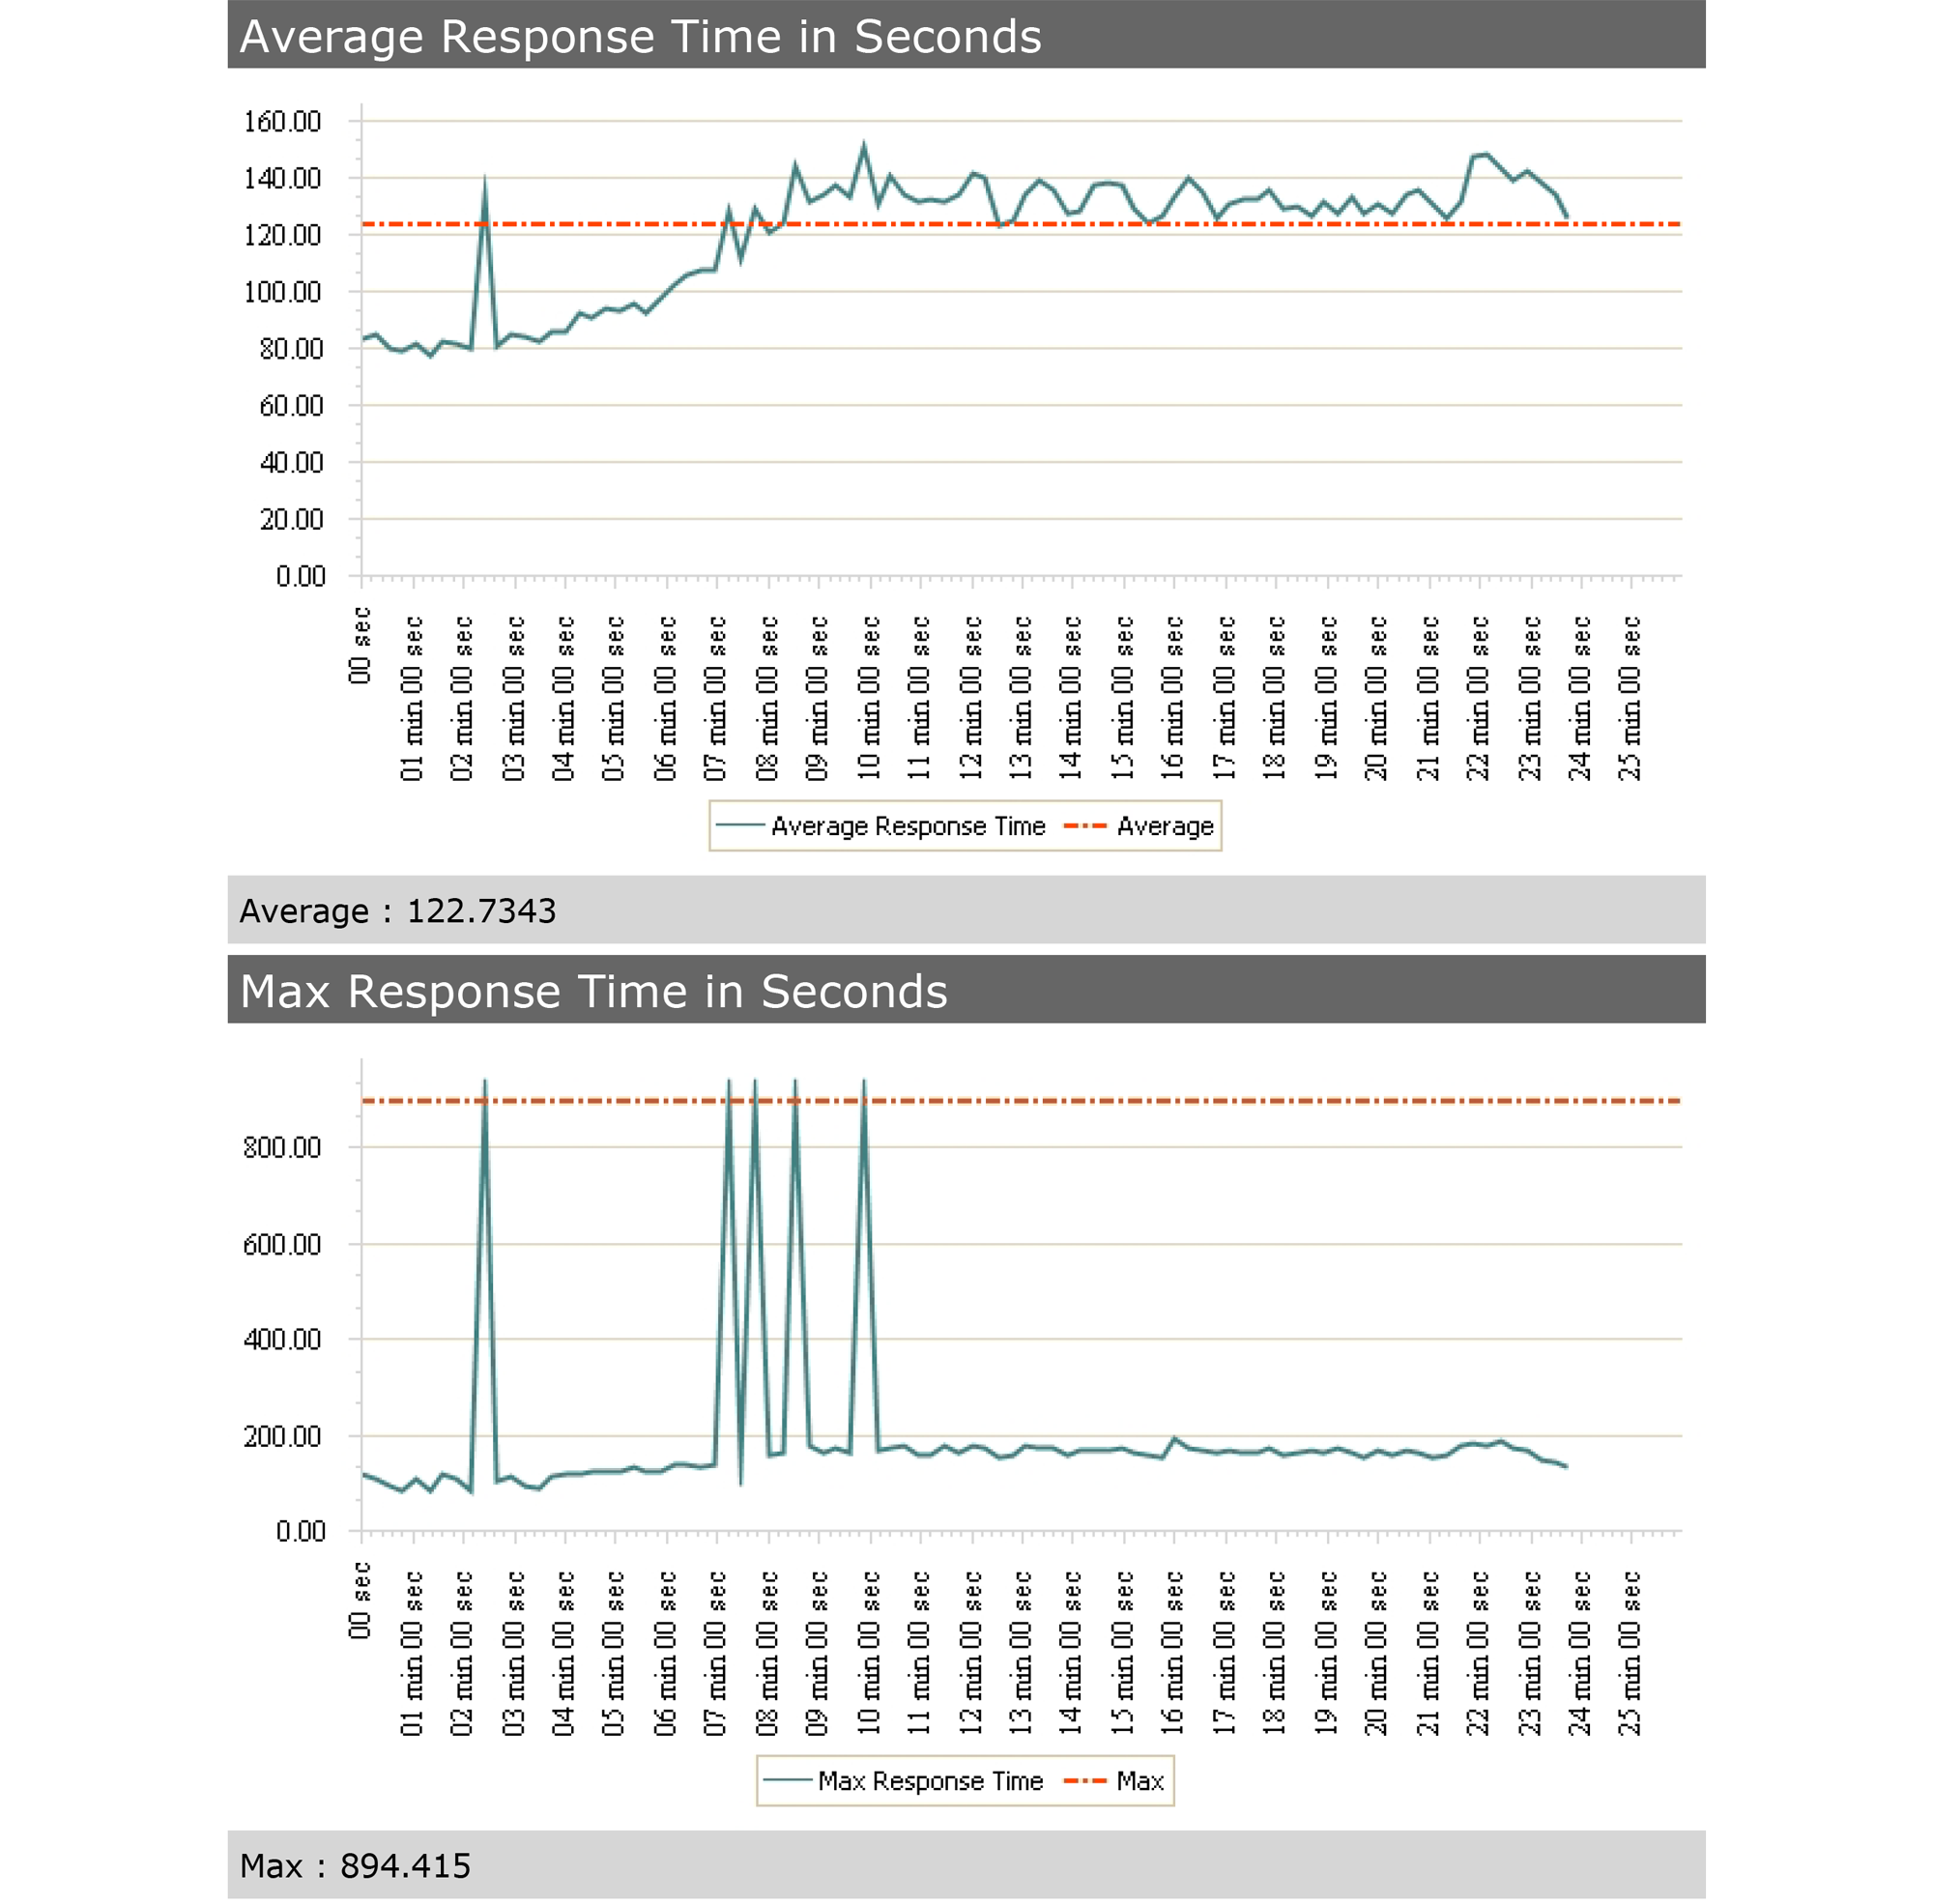
Things get interesting with the next two charts: the Average Response Time and Maximum Response Time.
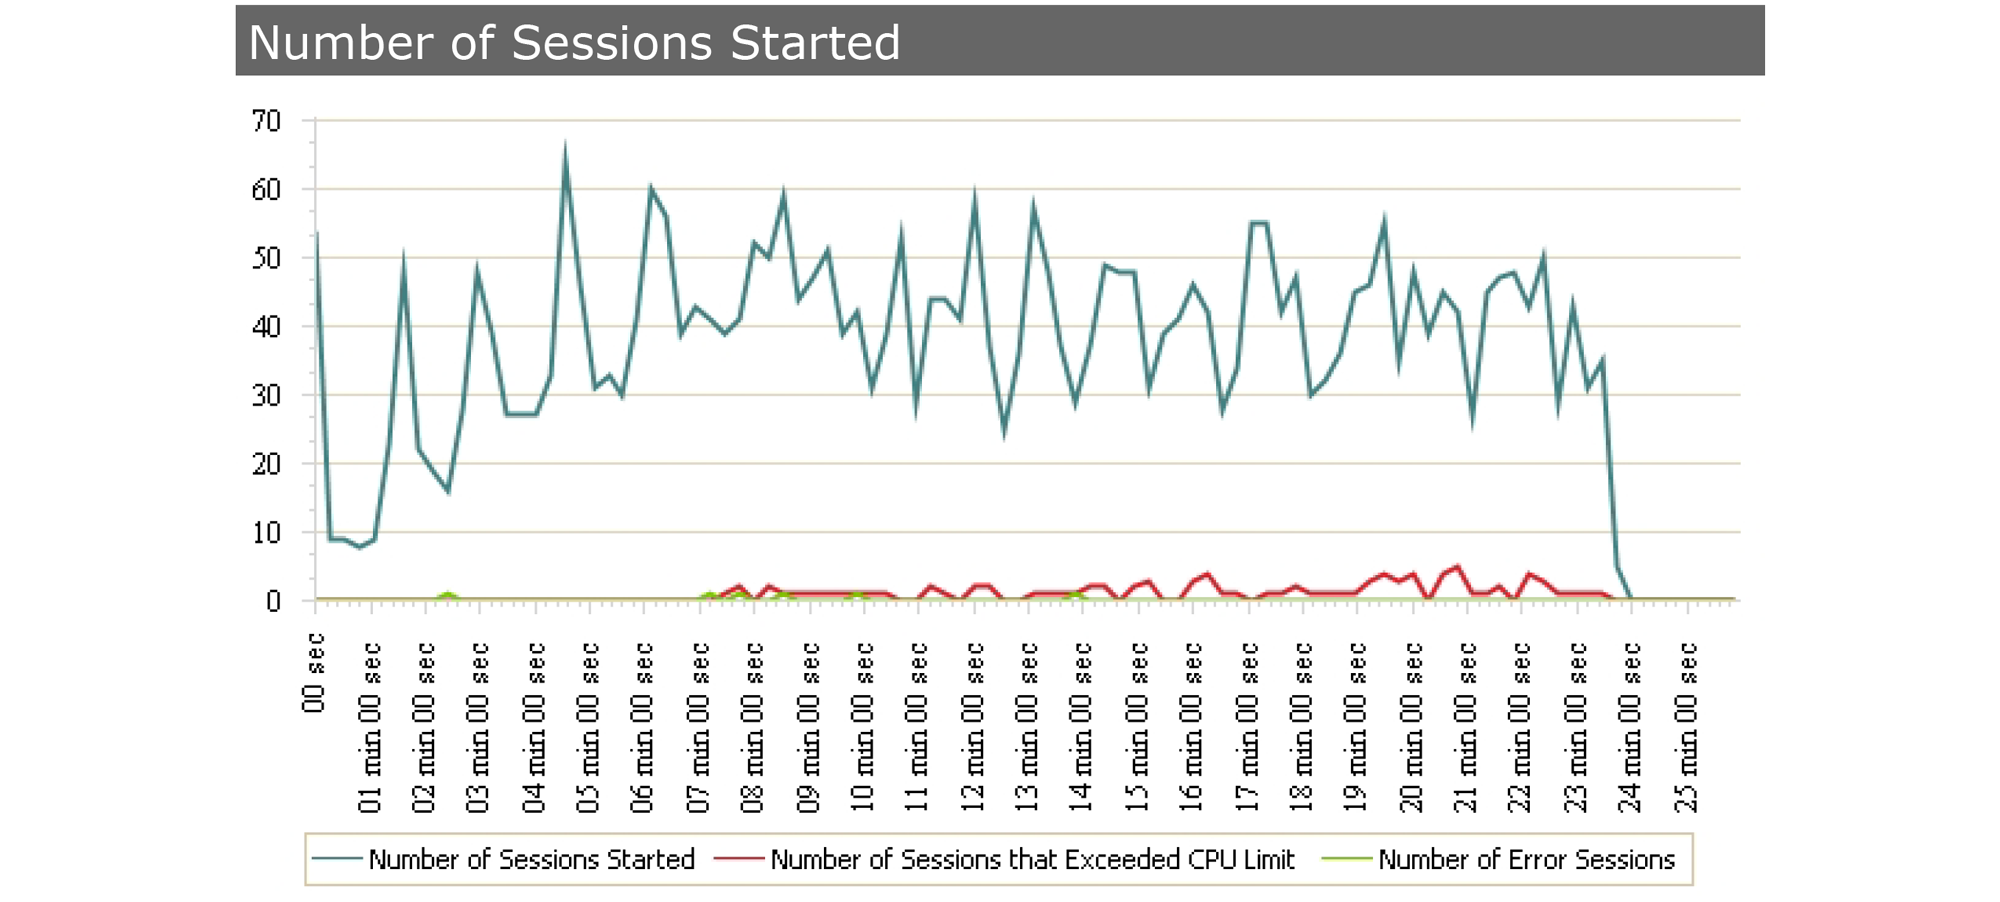
The next graph shows the number of sessions started over the course of the test.
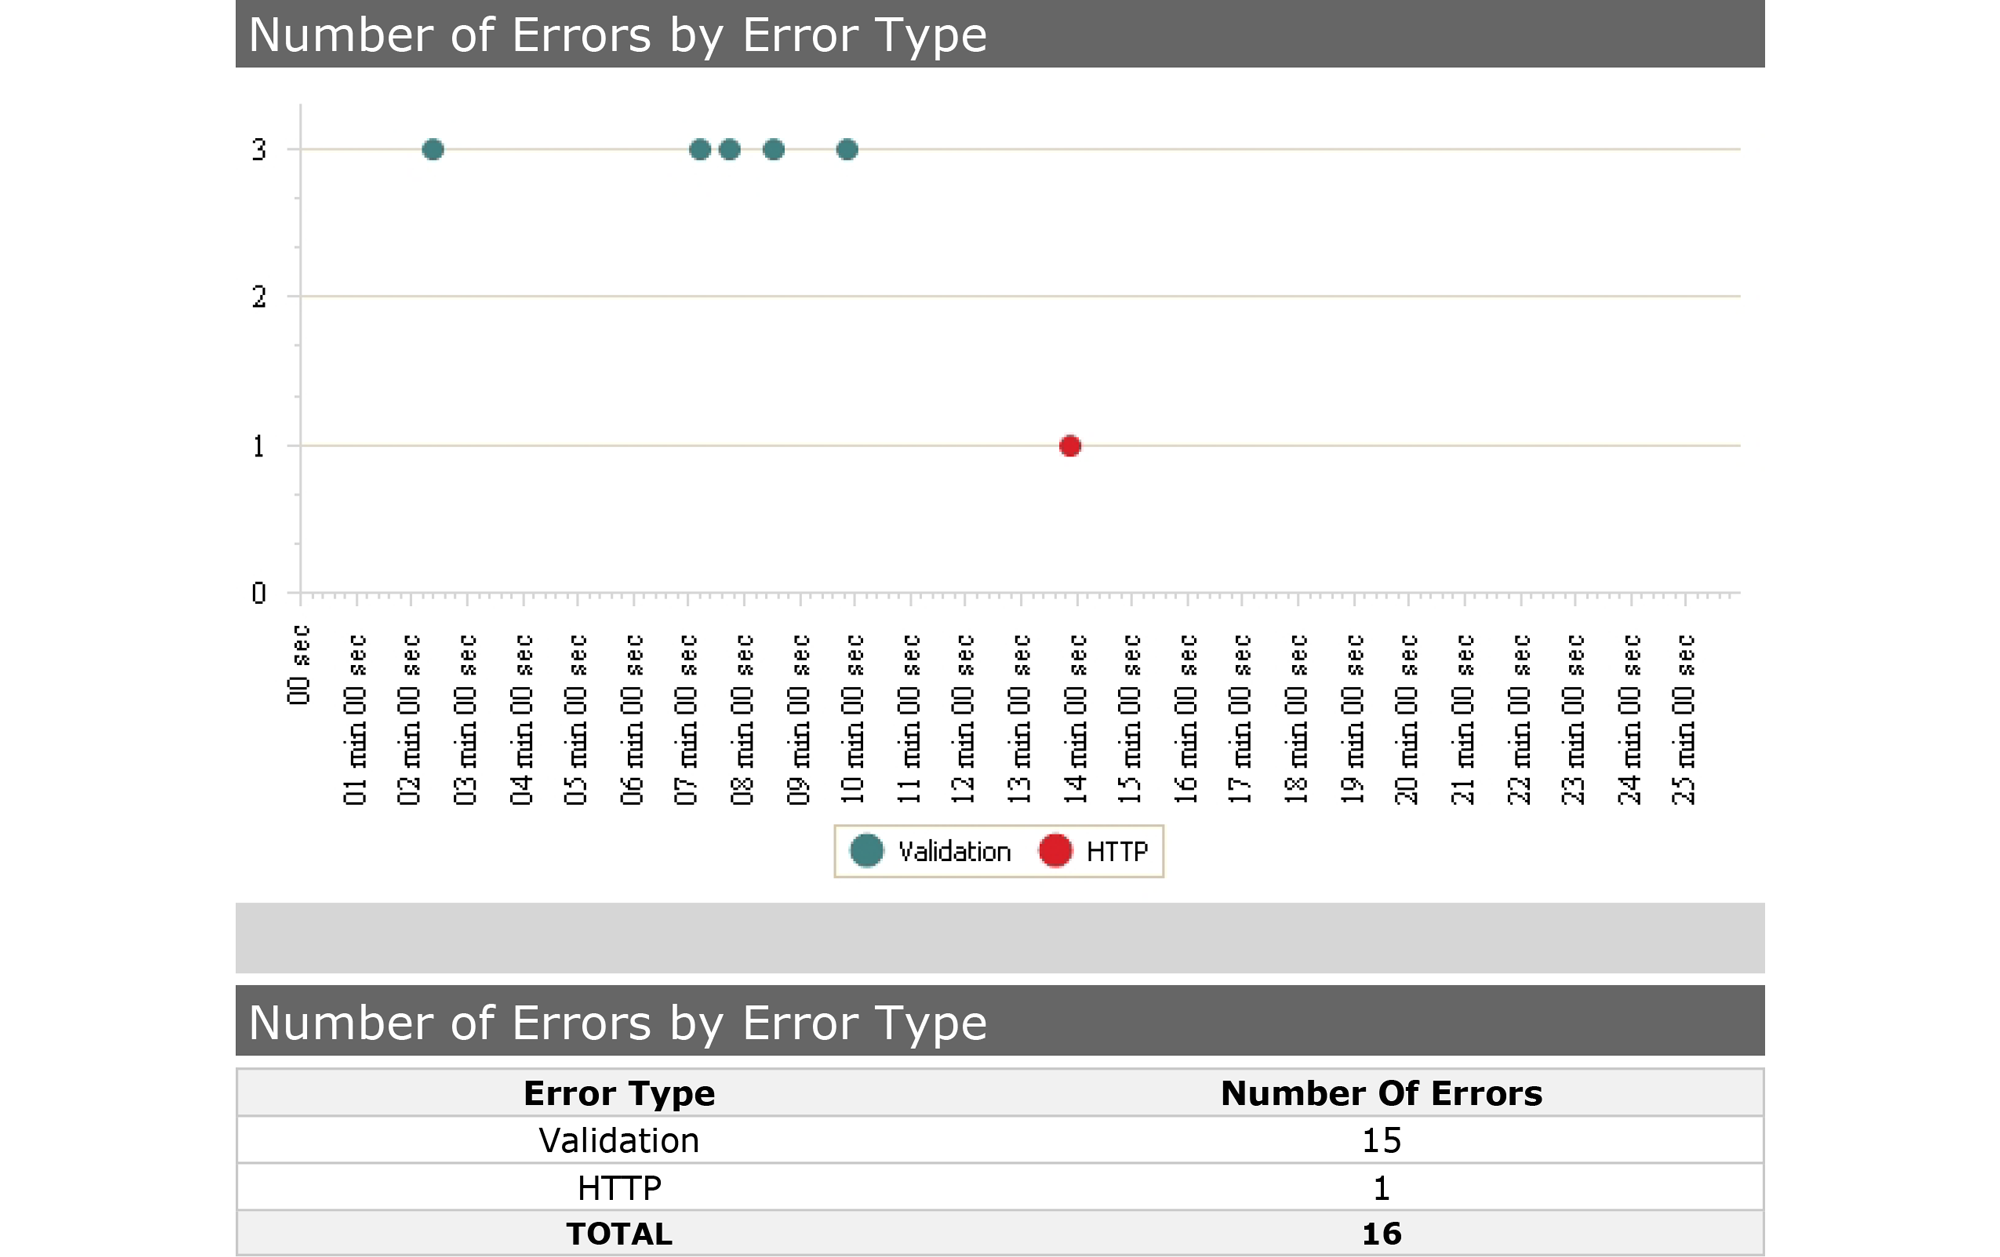
Next up is the number of errors that occurred during the test.
And finally you get the percentage of CPU load used by each virtual server.
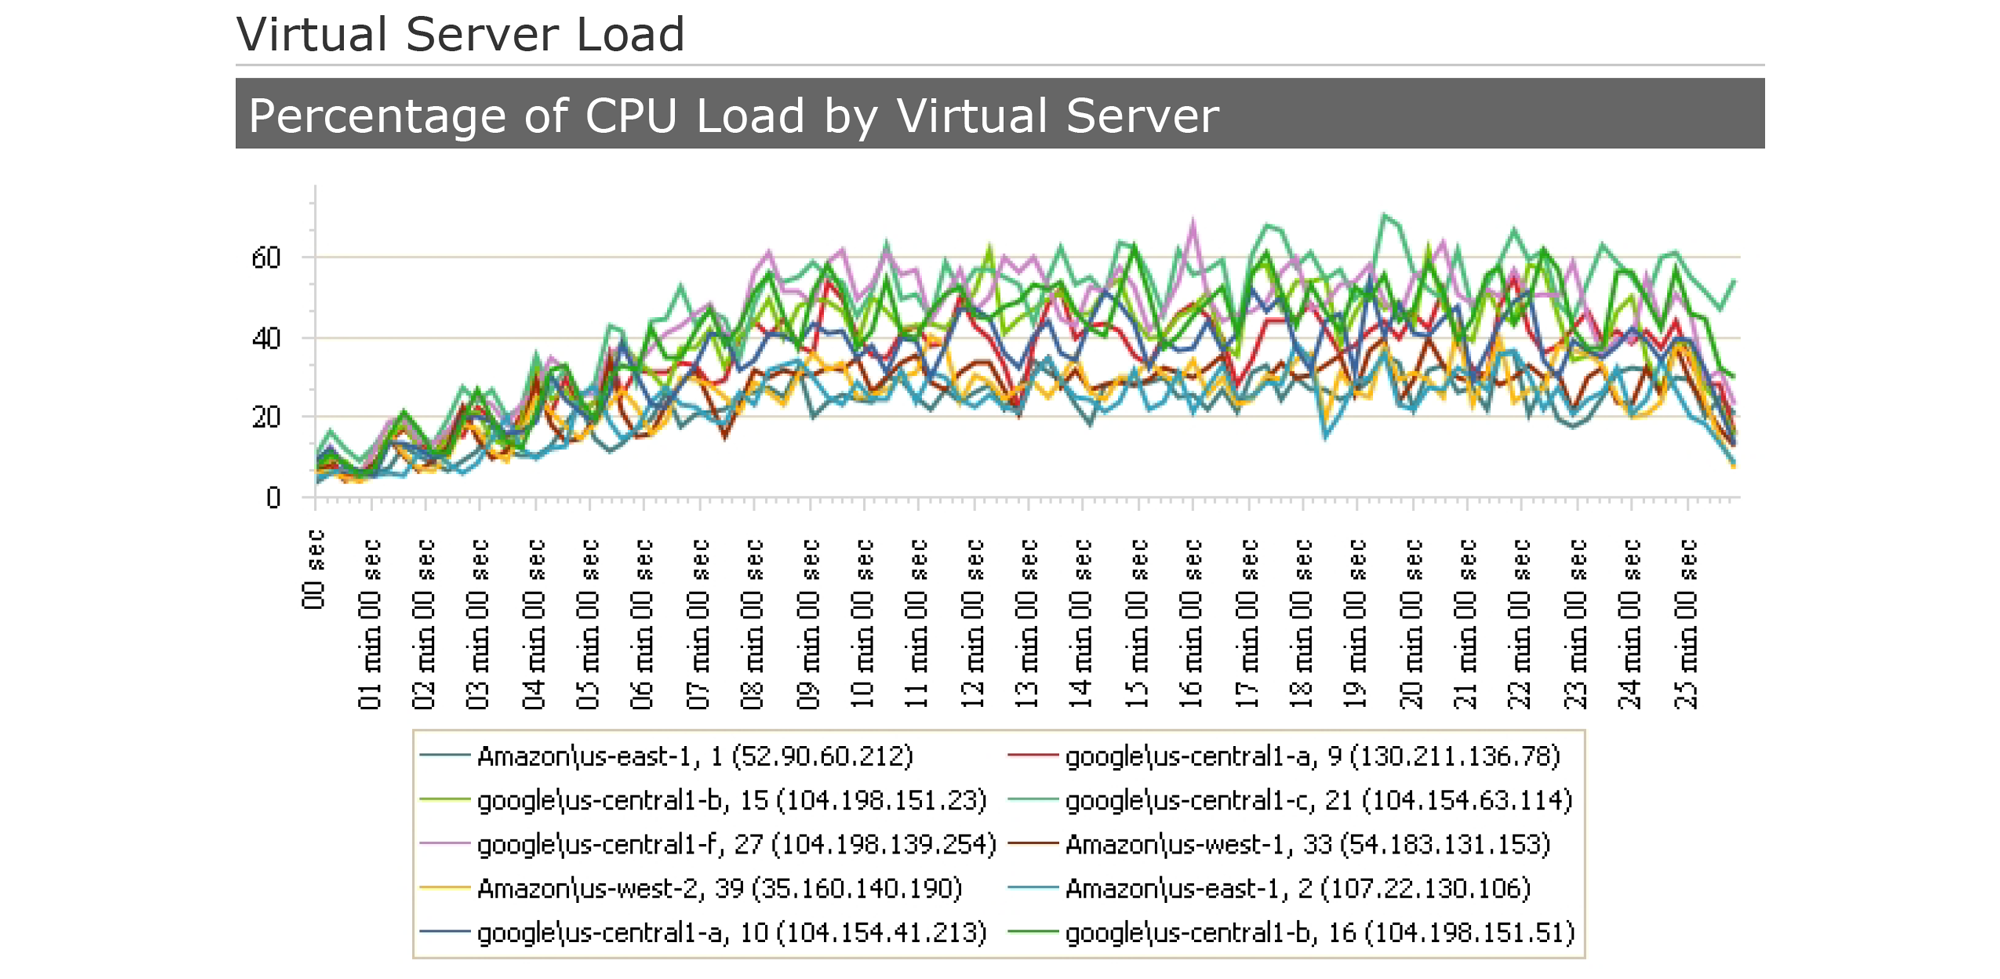
LoadView’s charts are clear and easy to read. The flexibility that comes with slicing and dicing the data in the downloadable CSV is a welcome bonus.
Conclusion
All in all, LoadView makes realistic, meaningful load testing practical and cost-effective. Utilizing the cloud to generate virtual users, and emulating real user behavior via EveryStep scripts are game-changing features. Copious tooltips and intuitive design make for a shallow learning curve.
This load-testing solution is worth a closer look for organizations looking to step up their load testing game. You can get started with a free trial of LoadView here.

