

Your uptime monitor says 100%. Your server dashboards are green. And checkout for a buyer in Frankfurt returns HTTP 200 with a payment error on the page.
Digital experience monitoring (DEM) measures what people get from your website, application or internal tool: if pages load, if logins and checkouts complete, and how long each step takes from where those users are. It tests the task, not just the host or service behind it.
Use this guide to decide which journeys to monitor, which data source fits each failure and what evidence an alert should include. It also shows what each monitoring type misses, because no single data source sees the whole path.
What Is Digital Experience?
Digital experience is everything a person goes through to finish a task on a website, app or internal tool: loading the page, signing in, filling out a form, paying and getting a confirmation.
For a customer, that might be searching a catalog and checking out. For an employee, it might be signing in to Salesforce through Okta and opening a pipeline report.
Users judge the whole sequence. They can’t tell if the slow part was a Cloudflare edge, a Google Tag Manager script or a Stripe API call. Plus, they rarely file a ticket.
DEM tools split into two groups. Customer-facing DEM watches public websites, web apps and the APIs behind them. Employee-facing DEM watches the laptops, Wi-Fi, VPN tunnels and SaaS apps your staff use. Customer paths need browser, API, DNS and third-party checks. Employee paths add device, Wi-Fi, VPN and SaaS visibility. This guide covers both, with more weight on customer journeys.
How Does Digital Experience Monitoring Work?
DEM defines each user task as a short list of checks. The page loads, the button responds, the confirmation text appears, and each step finishes within its time limit. When a check fails, a person gets an alert.
Active monitoring runs scripted tests on a schedule from locations outside your network. Passive monitoring records actual sessions through a JavaScript snippet in your pages or an agent on an employee’s device. Most setups run this loop:
- Collect. Synthetic checks load pages and run journeys such as login or checkout. RUM records live sessions. API checks call the endpoints behind each step.
- Validate. Each result is checked against a definition of success: a load time limit, a confirmation number on the page, an expected value in a JSON response.
- Confirm and alert. A failure is re-checked from another location to rule out local network noise, then sent to the on-call team.
- Diagnose. A waterfall chart, screenshot or session recording shows which request, element or step failed.
- Report. Availability and performance roll up into dashboards and SLA reports.
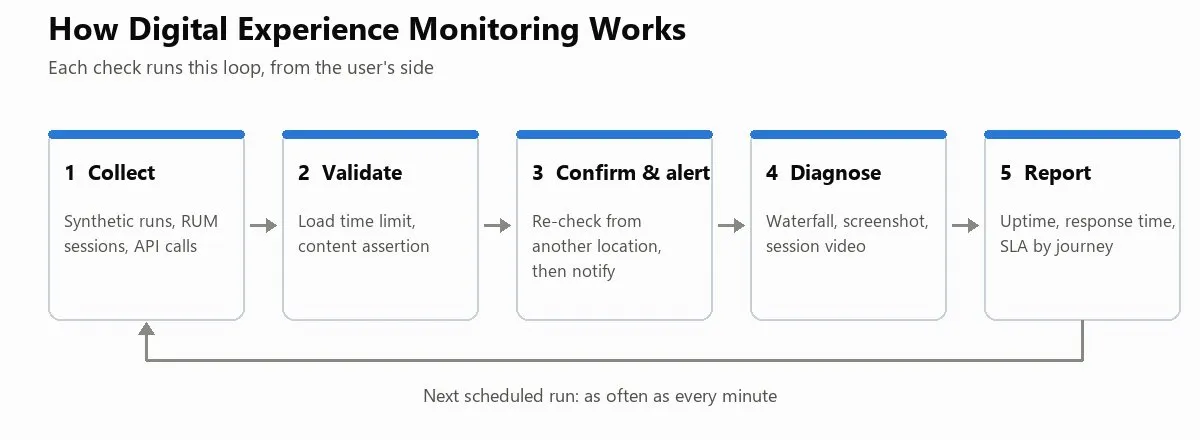
In Dotcom-Monitor, an error is verified from other locations before an incident opens, and the alert carries the waterfall, screenshot and video of that session.
Key Components of Digital Experience Monitoring
DEM programs draw on several monitoring types. Synthetic monitoring, RUM and endpoint monitoring measure the experience directly. API monitoring, APM and network checks explain what’s behind it. Each one watches a different part of the path between the user and your code.
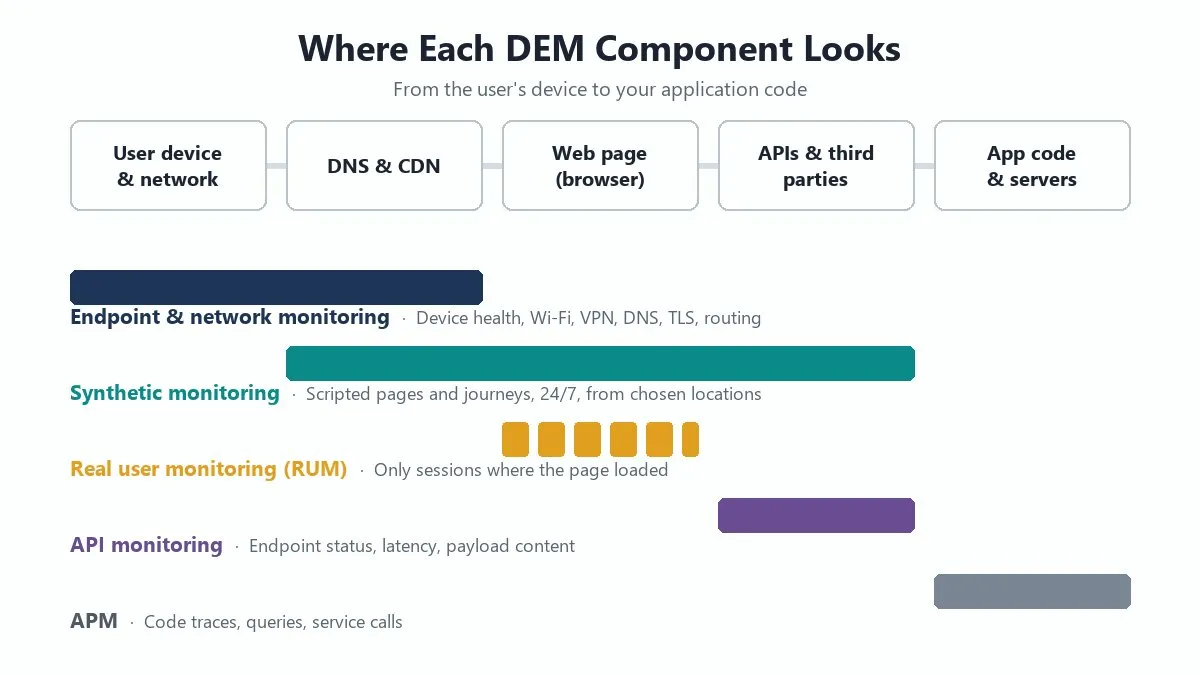
Synthetic Monitoring
Synthetic monitoring runs scripted visits to your site on a fixed schedule, from locations and browsers you choose. A script can load one page or walk through a full journey: search, add to cart, enter a test card, confirm the order.
It doesn’t need traffic, so it catches outages at 3 a.m., on quiet pages and on staging before a release. But it only tests the journeys you script.
Dotcom-Monitor’s web application monitoring runs these journeys in 40+ desktop and mobile browsers, as often as once a minute. You record a journey once in the EveryStep Web Recorder, and each step gets its own timing and content check. This guide to web transaction monitoring covers multi-step scripts in more depth.
Real User Monitoring (RUM)
Real user monitoring collects performance data from your visitors. A JavaScript snippet reports load times, Core Web Vitals, device, browser and location for each session.
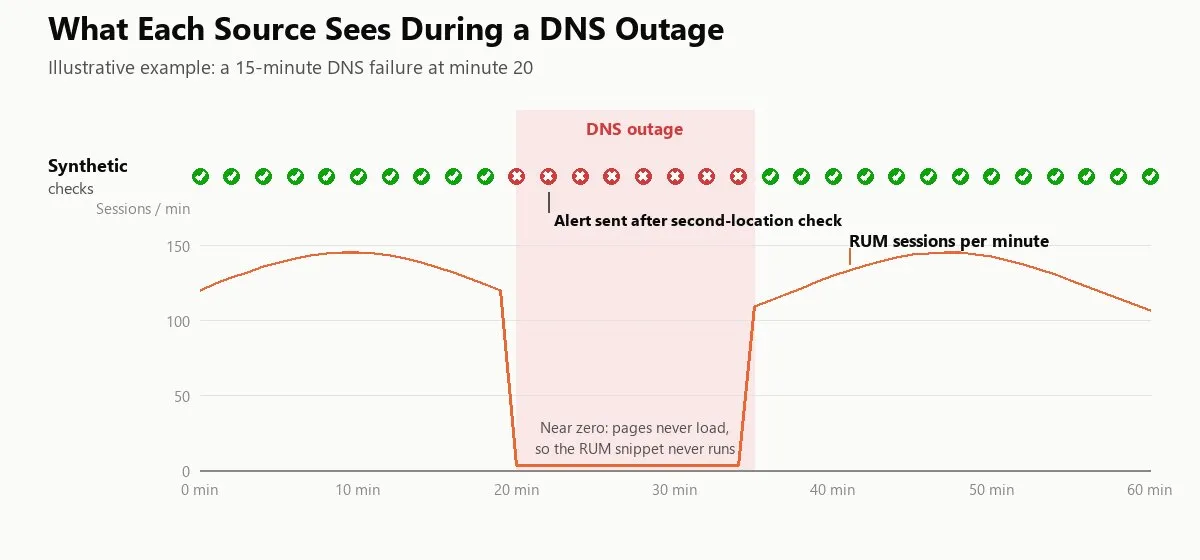
RUM shows the spread of devices and networks your visitors use, including old Android phones and slow hotel Wi-Fi. But it only reports sessions where the page loaded and the snippet ran, and ad blockers, consent settings and sampling remove some of those. A DNS failure, CDN error or expired certificate produces little or no RUM data.
Dotcom-Monitor is a synthetic platform and doesn’t collect RUM data. Run a RUM tool alongside it if you need visitor session analytics.
API Monitoring
Most journeys depend on APIs the user never sees: pricing, inventory, login, shipping rates, payments. API monitoring calls those endpoints directly and checks status, response time and the response content.
A GraphQL API can return HTTP 200 with an error in the body, and a REST endpoint can return an empty product list. A status check passes both.
Dotcom-Monitor’s API monitoring is the Web Services device type. It covers REST, SOAP and GraphQL, imports Postman and Insomnia collections, chains calls that pass tokens between steps, and asserts on payloads with JSONPath or XPath.
Application Performance Monitoring (APM)
APM instruments your code to trace requests through services and databases. Strictly speaking, it’s backend telemetry that explains what DEM detects. When checkout is slow, APM can point to a specific SQL query or service call. Our explainer on application performance management goes deeper.
APM stops at the edge of your infrastructure. It doesn’t see DNS, the CDN, third-party scripts or browser rendering. Dotcom-Monitor isn’t an APM tool. It shows that a step broke and where in the request chain, and your APM shows which code was involved.
Network and Endpoint Monitoring
Network monitoring checks what every request travels through: DNS records, TLS certificates, routing, packet loss and latency. Endpoint monitoring, the core of employee DEM, runs agents on laptops to track CPU, memory, Wi-Fi and VPN performance.
Dotcom-Monitor covers the network side with its Internet Infrastructure device type, including DNS monitoring, SSL certificate monitoring, TCP and ICMP checks. It doesn’t install agents on employee devices.
| Component | What it sees | Where it goes blind | Dotcom-Monitor coverage |
|---|---|---|---|
| Synthetic monitoring | Scripted pages and journeys, around the clock | Journeys and devices nobody scripted | Web Applications, Web Pages |
| Real user monitoring | Instrumented sessions that load, across your device mix | Hard outages, quiet pages, pre-release | Not covered; pair with a RUM tool |
| API monitoring | Endpoint uptime, latency, payload content | Browser rendering | Web Services |
| APM | Code, database queries, service calls | DNS, CDN, third-party scripts, browser | Not covered; pair with an APM tool |
| Network and endpoint | DNS, TLS, routing; laptop and VPN health | Application logic | Network checks via Internet Infrastructure |
Synthetic Monitoring vs. Real User Monitoring in DEM
Synthetic monitoring detects problems on a schedule. RUM describes how your actual audience experiences the site. Most DEM programs use both, for different jobs.
| Question | Synthetic monitoring | Real user monitoring |
|---|---|---|
| Needs traffic? | No, runs day and night | Yes, no visitors means no data |
| Catches hard outages? | Yes, including DNS, CDN and certificate failures | Often not, because the snippet never loads |
| Tests before launch? | Yes, on staging or behind a firewall | No |
| Shows the full device mix? | Only the browsers you configure | Yes |
| Consistent baseline? | Yes, same script, browser and location | No, shifts with traffic mix |
| Best use | Detecting failures and alerting | Prioritizing fixes by audience impact |
Use synthetic monitoring as the alarm, and RUM as the impact report that shows which pages, devices and regions to fix first.
Digital Experience Monitoring Metrics to Track
Pick metrics that answer what an ops lead asks after an incident. Did the journey work? How long did it take? Where did it fail, and which regions saw it?
Availability and Uptime
Availability is the share of checks in which the page or journey worked. A 99.9% monthly target allows about 43 minutes of downtime. A 99.99% target allows about 4 minutes.
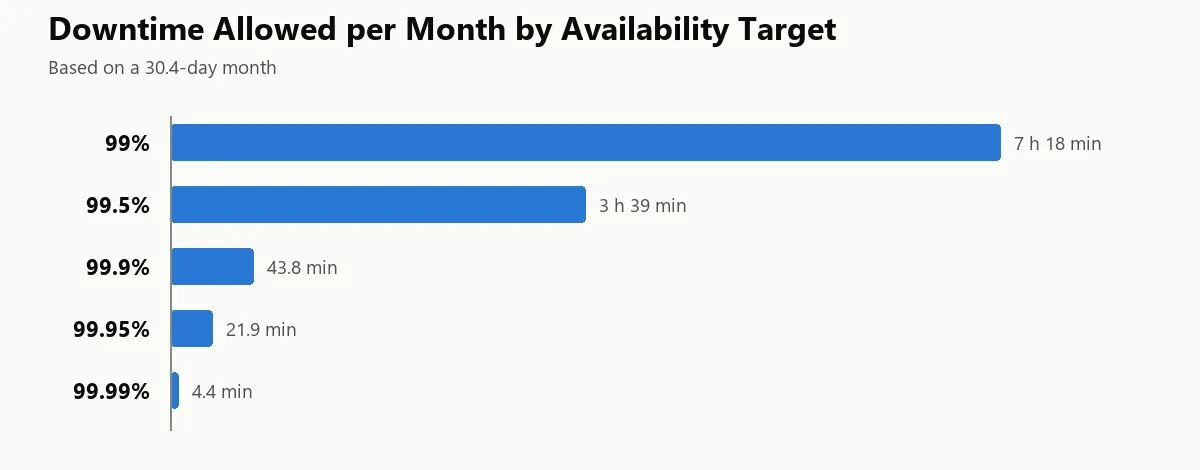
Measure it on the journeys that matter. A homepage can be up while login is down. Dotcom-Monitor confirms a failure from a second location before counting it, so one bad network route doesn’t skew the number.
Response Time and Page Load Speed
Response time covers how fast the server answers (time to first byte) and how long the page or step takes to finish. Track it per step and per location, and watch the 95th percentile. Averages hide the slow runs users remember.
Dotcom-Monitor’s website performance monitoring sets the limit on full page load, network time, a Navigation Timing event or First Meaningful Paint. Each run keeps a waterfall that splits every element into DNS, connect, SSL, first byte and download time. New to waterfalls? Start with this guide to reading waterfall charts.
Core Web Vitals (LCP, INP, CLS)
Core Web Vitals are Google’s three user experience metrics and part of its page experience signals. Google rates a page “good” when the 75th percentile of page loads meets these targets:
- Largest Contentful Paint (LCP): 2.5 seconds or less, for when the main content appears.
- Interaction to Next Paint (INP): 200 milliseconds or less, for how fast the page responds to clicks and taps. INP replaced First Input Delay in March 2024.
- Cumulative Layout Shift (CLS): 0.1 or less, for how much content moves while loading.
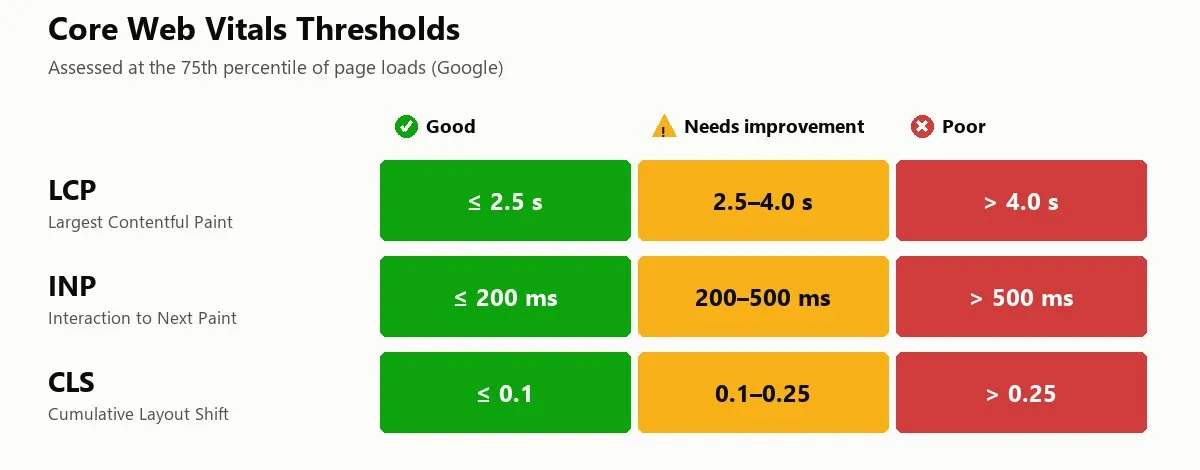
Google’s data comes from eligible Chrome users as a 28-day rolling aggregate, so a regression can take weeks to show in Search Console. A lab test catches it the day it ships. Dotcom-Monitor’s Lighthouse monitoring runs scheduled audits that report LCP, CLS and Total Blocking Time, with an alert on each. INP needs actual user input, so it comes from field data such as RUM or the Chrome UX Report.
Transaction Success Rate
Transaction success rate is the share of journey runs that complete every step. It’s the closest metric to “can users do what they came to do.”
Define success by what’s on the page, not the status code. A checkout run should pass only when the order confirmation number appears. In Dotcom-Monitor, that’s a content assertion on the last EveryStep step, and a time limit on each step fails one slow step even when the journey finishes.
Error Rates
Error rates count HTTP 4xx and 5xx responses, timeouts, scripts and images that never load, and API responses with the wrong content. Group them by page, host and location. A spike on one third-party host points to a vendor. A spike in one region points to DNS or a CDN edge.
Dotcom-Monitor flags each failed element in the session waterfall and groups timing by host, so your origin, CDN and each third party get separate lines.
Why Is Digital Experience Monitoring Important?
DEM matters because users experience your service as one thing, and most monitoring measures it as separate parts.
Server metrics can look normal while users fail. CPU, memory and error logs only measure your infrastructure. But a page request also depends on DNS lookups, CDN edges, tag managers and payment widgets, and failures there never reach your server logs.
Plus, more of the experience runs on systems you don’t own. A checkout page may load scripts from analytics, chat, review and payment vendors, and a login may pass through Okta or Microsoft Entra ID.
And users rarely report problems. A customer who can’t check out often leaves without contacting support, so the first sign may be a revenue dip the next day.
For IT managers, DEM also changes the report to the business. Instead of server uptime, you report if customers could log in, search and pay, by region, against a target everyone understands.
Benefits of Digital Experience Monitoring
Detect Issues Before Users Do
Synthetic checks don’t wait for visitors. A checkout that breaks at 2 a.m. triggers an alert at 2 a.m., not when the first customer complains at 9.
Dotcom-Monitor’s alerting sends confirmed failures to email, SMS, phone, Slack, Microsoft Teams, PagerDuty, ServiceNow or a webhook. Escalation rules notify a second group if the first doesn’t resolve the incident.
Faster Troubleshooting and Root Cause Analysis
An alert that only says “checkout failed” starts the investigation from zero. DEM data narrows it to one layer: DNS, network, an element, an API call or a script step.
Each Dotcom-Monitor error includes a waterfall synced to a video of the browser session, a screenshot, and a traceroute when the problem looks network related. Scrub the video to the moment the page stalled and see which request was still waiting.
Global Performance Visibility
A site can be fast from Virginia and slow from São Paulo. CDN edges, DNS answers and transit routes differ by region, and checks from one cloud region won’t show it.
Dotcom-Monitor runs checks from its global monitoring network of 30+ locations, each reporting its own timings. Pick the locations that match your top traffic regions in analytics.
SLA Tracking and Business Impact
Short outages still count. Dotcom-Monitor platform data shows that about 38% of detected outages resolve within 5 minutes, often from routing issues, restarts or failovers. They count against an SLA, and a 15-minute check interval misses most of them. Longer incidents matter too: 56%+ of alerted outages resolve within 15 minutes of the first Dotcom-Monitor alert, and about 18% last more than an hour.
Dotcom-Monitor’s uptime and SLA reports compare measured availability with your target over 7, 30 or 90 days or a custom range, and export to PDF, CSV or XML. Schedule them monthly so leadership sees the same numbers engineering does. Internal journey targets work best as SLOs, with the contractual SLA set lower to leave room for error.
Digital Experience Monitoring Use Cases
E-Commerce Checkout Flows
Checkout is where slow pages and errors turn into lost orders. Our article on browser monitoring for conversion optimization covers the funnel side.
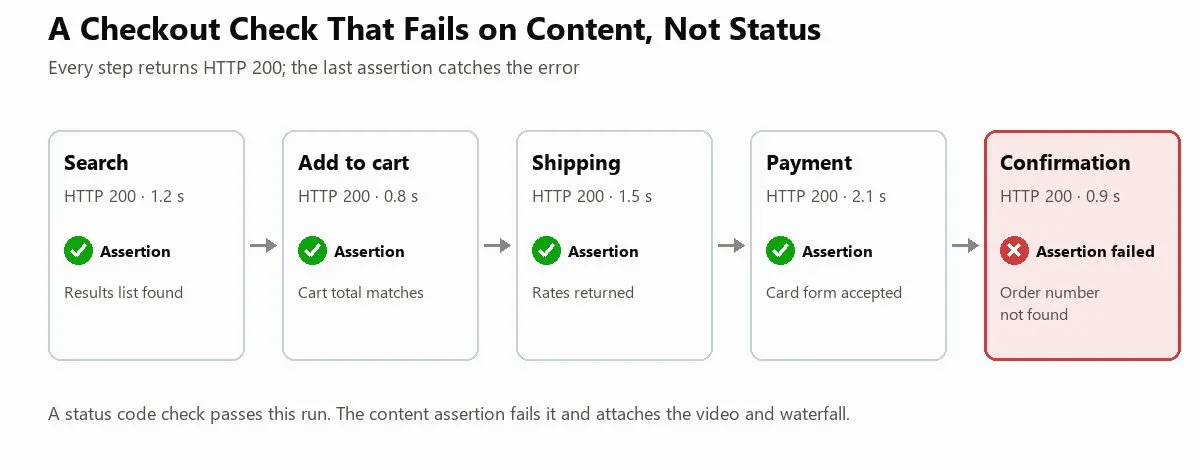
Scenario: Your payment provider, say Stripe or Adyen, changes a field in its API. Your checkout catches the exception, shows “Something went wrong, please try again,” and returns HTTP 200. Every status check passes, and no orders complete.
What catches it: a Web Applications device running an EveryStep checkout script in the payment provider’s test mode, with a test account, an item that doesn’t affect inventory, and a content assertion on the order confirmation number. The step fails on the missing text, and the alert includes video of the error page. See retail and ecommerce monitoring for storefront setups.
SaaS Application Logins
For a SaaS product, every feature sits behind the login. If sign-in fails, customers who need to log in are locked out, even when the rest of the app is healthy.
Scenario: Your identity provider rotates a signing certificate and your SSO configuration isn’t updated. The login page loads fine. Users who sign in through Okta land in a redirect loop.
What catches it: a Web Applications device that signs in with a test account and asserts on an element that only appears on the dashboard, such as the account name. For OIDC sign-in flows, a Web Services check on the token endpoint shows if authentication or the app is at fault. More setups are on the SaaS monitoring page.
Third-Party and API Dependencies
Third-party services fail on their own schedule, and you can’t patch them.
Scenario: A shipping API starts answering in 11 seconds instead of 300 milliseconds. It never returns an error, so error alerts stay quiet. Customers reach the shipping step and wait on a loading spinner, and some abandon the cart.
What catches it: a Web Services device calling the shipping endpoint with a response time limit and a JSONPath assertion on the returned rates. On the page side, the Web Pages device breaks load time down by host, so a slow chat widget shows up as its own line. See third-party content monitoring for vendor scripts.
Employee-Facing Applications
Internal tools affect productivity the way public sites affect revenue.
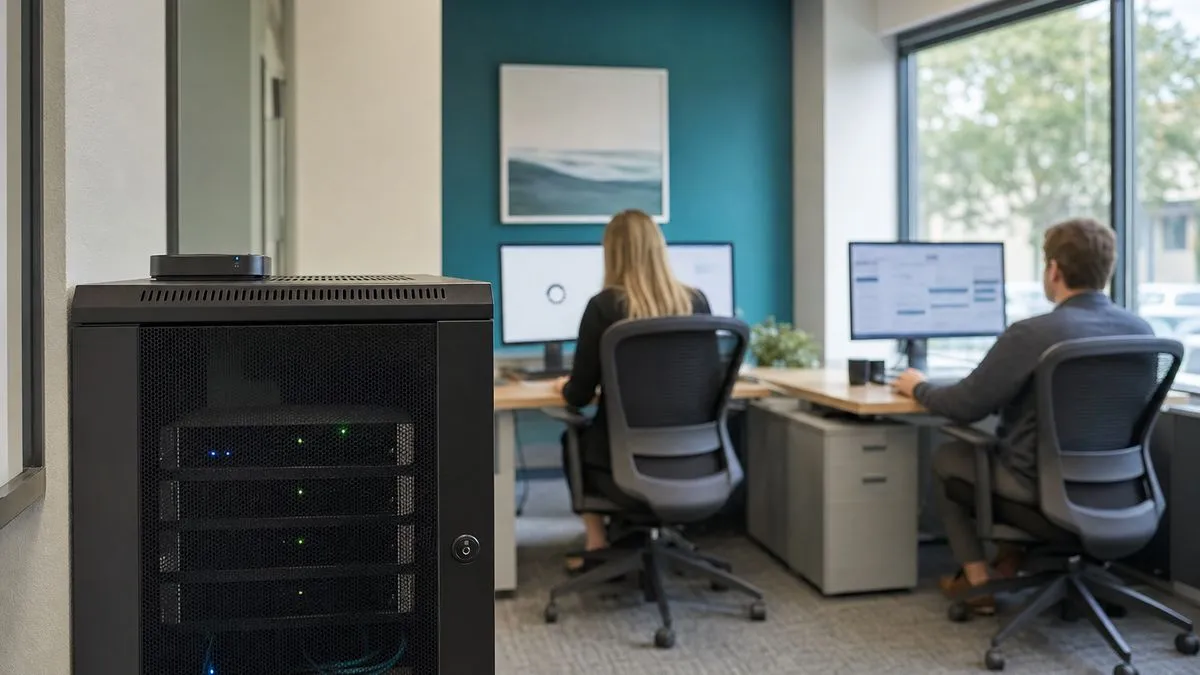
Scenario: A firewall change at one branch office blocks the path to an internal ordering app. Headquarters works fine, so the help desk treats the first reports as user error.
What catches it: private agents in each office run the same EveryStep login and order script from inside the network, including apps that sign in through Microsoft AD FS or Okta. The affected office’s agent fails while the others pass. For laptop and Wi-Fi health, pair it with an endpoint DEM tool.
Conclusion
Digital experience monitoring tells you if users can complete what they came to do, right now, from where they are. Server dashboards can’t answer that.
Start with synthetic monitoring on the three to five journeys that carry revenue or block work, such as login, search and checkout. Give each one a content assertion on the final step, run it every 1 to 5 minutes from your users’ regions, and route confirmed failures to the team that can fix them. Then add API checks on the dependencies behind those journeys. Add RUM when you want to rank fixes by audience impact, and APM when you need traces into your code.
Start with your most important journey
Record it in EveryStep, add an assertion to the confirmation step, and run it from 30+ locations in desktop and mobile browsers. Dotcom-Monitor’s synthetic monitoring comes with a 30-day free trial, and no credit card is required.
