• Blog Home
  • Products
    • Website Monitoring
    • Web Application Monitoring
    • API Monitoring
    • DNS Monitoring
    • SSL Certificate Monitoring
  • Free Tools
    • Website Speed Test
    • Web Server Test
    • Email Server Test
    • Email Blacklist Lookup
    • Network Trace Test
    • DNS Trace Test
    • FTP Server Test
    • Streaming Media Test
    • Network PING Test
  • System Info
    • System Status Updates
    • Dotcom-Monitor Feature Updates
    • Network location IP addresses
    • Support Wiki
  • English
    • Español (Spanish)
    • 简体中文 (Chinese (Simplified))
    • Deutsch (German)
    • Français (French)
    • Português (Portuguese (Brazil))
    • 日本語 (Japanese)
  • Blog Home
  • Products
    • Website Monitoring
    • Web Application Monitoring
    • API Monitoring
    • DNS Monitoring
    • SSL Certificate Monitoring
  • Free Tools
    • Website Speed Test
    • Web Server Test
    • Email Server Test
    • Email Blacklist Lookup
    • Network Trace Test
    • DNS Trace Test
    • FTP Server Test
    • Streaming Media Test
    • Network PING Test
  • System Info
    • System Status Updates
    • Dotcom-Monitor Feature Updates
    • Network location IP addresses
    • Support Wiki
  • English
    • Español (Spanish)
    • 简体中文 (Chinese (Simplified))
    • Deutsch (German)
    • Français (French)
    • Português (Portuguese (Brazil))
    • 日本語 (Japanese)
FREE TRIAL

Dotcom-Monitor Web Performance Blog

External monitoring nodes around the globe checking a financial services application from outside its network perimeter

External Synthetic Monitoring for DORA Operational Resilience

July 24, 2026

How external synthetic monitoring meets DORA’s detection and availability obligations, mapped requirement by requirement.

Read More »
DNS resolution shown as the first step of a monitoring check, before TCP, TLS, and HTTP stages

How Dotcom-Monitor Resolves DNS in Every Check

July 22, 2026

Dotcom-Monitor’s DNS resolve modes control caching, failure detection speed, and real-user timing accuracy—learn which mode fits your monitoring checks.

Read More »
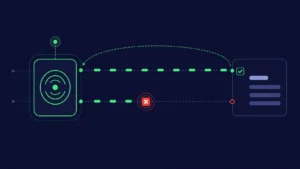
Diagram of a monitoring node testing a website over two separate paths, an IPv4 path shown healthy and an IPv6 path shown broken.

IPv6 Monitoring with Dotcom-Monitor: Find IPv6 Blind Spots

July 20, 2026

IPv6 protocol checks run once a minute from native nodes, isolating faults your IPv4 monitoring will never catch. Here’s how Dotcom-Monitor does it.
Read More »
Editorial illustration of a monitoring probe firing two synthetic checks toward a target site — the top check flows cleanly and returns to the monitor, the bottom check silently breaks mid-path — visualizing the dual-stack blind spot that native IPv6 monitoring closes.

Why You Need Native IPv6 Network Monitoring

July 7, 2026

Ensure 100% uptime across all routing paths. Learn how native IPv6 network monitoring catches hidden DNS, firewall, and gateway configuration errors.

Read More »
Diagram comparing round-robin monitoring rotating through one location per cycle against concurrent monitoring checking all locations every cycle

Concurrent vs Round-Robin Monitoring Explained

June 18, 2026

Round-robin vs concurrent synthetic monitoring: how each schedules checks across locations, the cost trade-off, and when to use which.

Read More »
On-call engineer reviewing a website monitoring alert console showing confirmed outages, escalation tiers, and notification channels at night

Website Monitoring Alerts – Maximize Uptime and Reduce Noise

June 12, 2026

Updated June 2026 · 11-minute read Ask any on-call engineer about their monitoring and they will tell you the same thing: the alerts are not the problem. The noise is.

Read More »
Holographic illustration of application performance monitoring: metrics, traces, and logs flowing from an instrumented application into a unified APM dashboard on a deep navy background.

What is Application Performance Monitoring (APM)?

June 12, 2026

What application performance monitoring (APM) is, how instrumentation, collection, and correlation work, which metrics matter, and the best practices that make APM useful in production

Read More »
Holographic application performance dashboard surrounded by floating monitoring panels — API traces, real-browser checks, global locations, and alerts — on a deep navy background, illustrating the top 8 APM tools of 2026.

Top 8 Application Performance Monitoring Tools (2026 Edition)

June 11, 2026

Compare the top 8 application performance monitoring tools of 2026 on features, alerting, OpenTelemetry, and real pricing, plus the hidden costs to avoid.

Read More »
Website availability monitoring dashboard showing multi-region uptime checks, alert routing, and a live incident status panel.

Website Availability Monitoring: A Practical Guide to Staying Online

June 5, 2026

Learn how to monitor website uptime, compare synthetic vs. real user monitoring, evaluate tools, and audit your setup with a practical checklist.

Read More »
Glowing holographic globe with monitoring nodes and floating performance dashboards on a deep navy background, illustrating global synthetic monitoring as an alternative to Pingdom

Best Pingdom Alternatives in 2026: 7 Top Tools Compared

June 3, 2026

Looking for Pingdom alternatives? Compare top tools like Dotcom-Monitor, UptimeRobot, and Datadog with accurate features, pricing, and API monitoring strengths.

Read More »
Editorial illustration of a stylized browser window on a deep navy background surrounded by six monitoring facet chips — uptime, real-browser, SSL, performance, alerts, and reporting — converging on the site with orange connector threads, visualizing comprehensive website monitoring best practices.

Web Application Performance: Metrics, Process & Best Practices

June 1, 2026

Web application performance is not just a technical concern – it is a business imperative. Google’s research shows that as page load time increases from one second to five seconds,

Read More »
Operations engineer reviewing a global website monitoring dashboard with regional checkpoints, latency timelines, and active alerts

Website Monitoring Best Practices Engineers Actually Use

May 31, 2026

What it is, why it matters, and best practices to choose the best website monitoring service for uptime, performance, and user experience.

Read More »
« Previous Page1 Page2 Page3 … Page13 Next »
  • 1-888-479-0741
  • sales@dotcom-monitor.com
  • Minneapolis, MN, USA
Solutions
  • Website Monitoring
  • Web Application Monitoring
  • API Monitoring
  • DNS Monitoring
  • SSL Certificate Monitoring
  • Website Monitoring
  • Web Application Monitoring
  • API Monitoring
  • DNS Monitoring
  • SSL Certificate Monitoring
Free Tools
  • Website Speed Test
  • China Firewall Test
  • Ping Test
  • All Network Tools
  • Website Speed Test
  • China Firewall Test
  • Ping Test
  • All Network Tools
Features
  • Alerts
  • Monitoring Network
  • Support
  • Private Agents
  • Security
  • Integrations
  • Enterprise Monitoring
  • Alerts
  • Monitoring Network
  • Support
  • Private Agents
  • Security
  • Integrations
  • Enterprise Monitoring
Company
  • About
  • Pricing
  • Contact Us
  • Alternatives
  • Integrations
  • Professional Services
  • Reseller Program
  • Knowledge Base
  • Our Blog
  • About
  • Pricing
  • Contact Us
  • Alternatives
  • Integrations
  • Professional Services
  • Reseller Program
  • Knowledge Base
  • Our Blog
Client Login
Free Trial
Facebook X-twitter Linkedin Youtube
Our Other Platforms
  •  LoadView Testing
  •  Dotcom-Tools
  •  LoadView Testing
  •  Dotcom-Tools
  • English
    • Español (Spanish)
    • 简体中文 (Chinese (Simplified))
    • Deutsch (German)
    • Français (French)
    • Português (Portuguese (Brazil))
    • 日本語 (Japanese)

© 1998-2026 Dotcom-Monitor, Inc. All rights reserved.

  • Privacy Policy
  • Terms of Service
  • Licensed Patents
  • Cookie Policy
  • Sitemap
  • Privacy Policy
  • Terms of Service
  • Licensed Patents
  • Cookie Policy
  • Sitemap