
Your uptime check says the app is fine. The server answered with a 200 in under half a second, the HTML arrived, the check turned green. Meanwhile a user is staring at a spinner, because the JavaScript bundle rendered the app shell and then a slow orders API left the main view empty. Nothing in your monitoring caught it, because nothing in your monitoring runs a browser.
That gap is the defining problem of monitoring modern web applications. Single page apps built with React, Vue, or Angular deliver almost nothing in the initial HTML. The experience users actually get is assembled client-side: JavaScript boots the framework, client-side routing swaps views without a page load, and a dozen API calls fill in the content. Every one of those steps can fail or crawl while an HTTP check reports perfect health.
This guide covers what browser monitoring means for SPA architectures, why traditional checks miss the failures that matter, the metrics worth tracking, and a step-by-step setup for single page app monitoring that catches problems before users report them.
What Browser Monitoring Means for Modern Web Apps
Browser monitoring means testing a web application by loading and driving it in a real browser at regular intervals, from controlled locations, and measuring what actually renders. Instead of asking “did the server respond,” it answers the only question users care about: did the page become usable, and how fast?
The distinction matters because of how the work is split in a modern app. In a server-rendered site, the response the server sends largely is the experience, so checking the response checks the experience. In an SPA, the server mostly hands over a skeleton: a near-empty HTML document plus script tags. Parsing, framework boot, route resolution, data fetching, and rendering all happen in the browser. An HTTP check validates the skeleton. A real-browser check validates the application. That’s the core reason traditional monitoring isn’t enough for modern web applications.
In its synthetic form, browser monitoring drives scripted sessions through the app on a schedule: load the dashboard, log in, run a search, add to cart, check out. Each run captures per-step timings, a waterfall of every request the page made, a record of what failed and where, and errors from the browser console. When a run fails, you know which step broke, which request caused it, and what the user would have seen. The useful assertion is not that a button was clickable. It is that the order confirmation number rendered, that the saved report appeared in the list, that the permission change took effect. Browser monitoring earns its keep when it validates state, not just screens.
Why Single Page Apps Break Traditional Monitoring
Three architectural traits of SPAs cause most monitoring blind spots: an initial payload that contains no content, navigation that never touches the server, and a rendering layer that separates “the request finished” from “the user can see it.” Each one defeats a different assumption traditional tools rely on.
The First Paint Is a Bluff
Load a React or Vue app and the browser fires DOMContentLoaded almost immediately, because the document is tiny. At that moment the user can see roughly nothing. The framework still has to download and execute the bundle, mount the component tree, fetch data, and render. Any metric keyed to document load events declares victory long before the app can accept a click. The distance between “loaded” as the browser defines it and “usable” as a human defines it is exactly where SPA monitoring has to operate. Skeleton loaders make the bluff worse: the gray placeholder boxes can post an excellent Largest Contentful Paint score while the data fetching that makes the view usable has not even started, so the app looks fast and is functionally dead. The better question is not when the browser painted, but when the route had enough user-specific data to be useful.
Client-Side Routing Makes Navigation Invisible
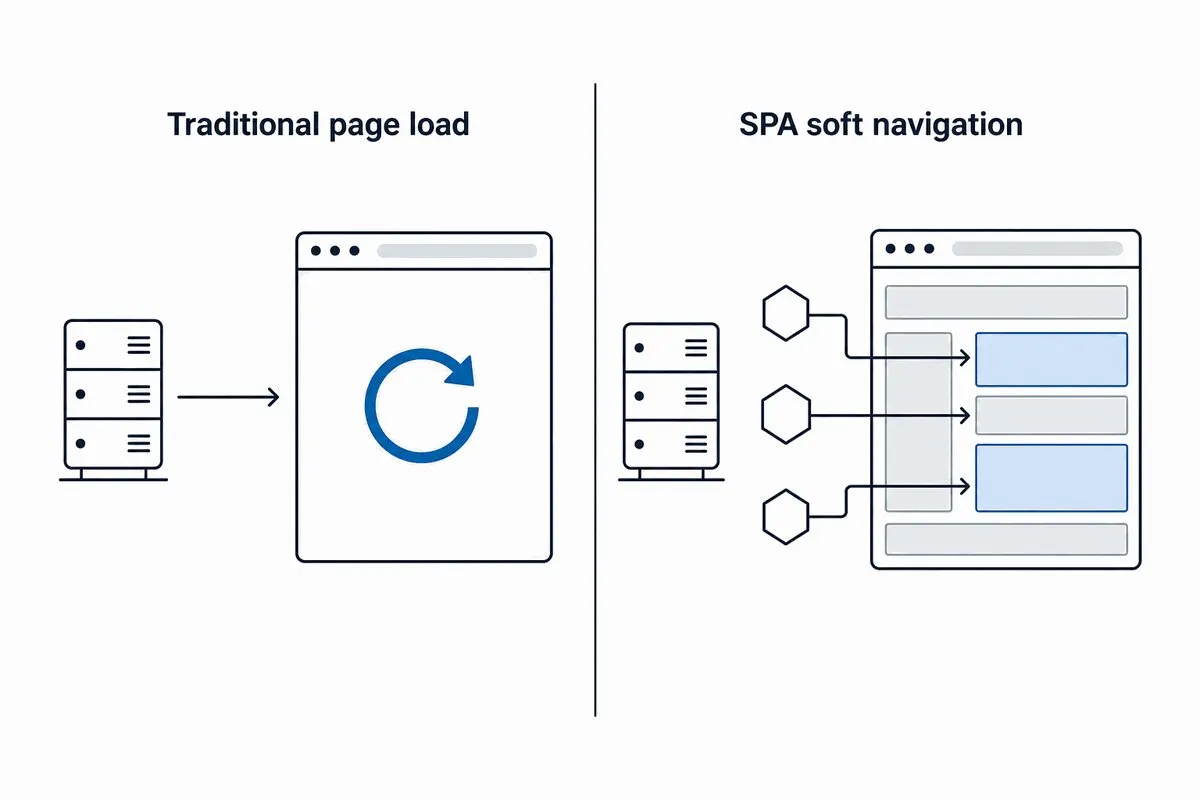
When a user clicks from a product list to a product detail view, no navigation happens in the network sense. The router intercepts the click, rewrites the URL through the History API, and swaps components in place, a pattern known as a soft navigation. The browser records no page load and no navigation timing. Monitoring that counts page loads sees a user who arrived once and did nothing, and it will never notice that the checkout route takes nine seconds to render. The same blindness corrupts analytics: a user who views ten products in an SPA can register as a single-page bounce in any tool that only counts full page loads. Route transitions have to be measured deliberately, from the click that triggered them to the moment the new view’s content is on screen. How you do that varies with the routing and rendering architecture: pure client-side rendering, server-side rendering with hydration, and hybrid setups each shift where the delay hides.
The Render Layer Separates Responses From What Users See
Frameworks put a render layer between a successful response and visible UI: React and Vue reconcile component output before committing DOM updates, while Angular’s change detection decides when bound data reaches the template. Content can appear a beat after the API response lands, or never, if a rendering error gets swallowed by an error boundary. For monitoring, that means a clean API response proves very little: the endpoint can return perfect JSON while the component that displays it quietly fails. Checks have to assert on rendered output, not response codes. The render layer also punishes fragile scripts: CSS-in-JS libraries generate hashed class names that change between builds, so a check that targets them breaks on every deploy. Stable hooks like data-testid attributes or ARIA roles are what keep browser checks maintainable.
Framework-Specific Failure Modes in React, Vue, and Angular
The big three frameworks share those blind spots but fail in their own dialects, and monitoring is more effective when it knows which app it’s pointed at.
- React. Error boundaries are designed to replace a crashed component with fallback UI, which keeps the app alive and also hides the failure: no failed request, no blank page, just a view that silently lost a feature. Lazy-loaded routes add a second trap, since a failed dynamic import can strand a route on its loading state. Content assertions catch both; status codes catch neither. The challenges of monitoring React applications deserve their own checklist.
- Vue. Vue’s reactivity system tracks dependencies automatically, and deeply nested reactive objects or long watcher chains can make one small state change fan out into a cascade of updates. The symptom is sluggish interaction, not an error, which is why monitoring Vue.js applications leans on interaction timing rather than error counts.
- Angular. Zone.js triggers change detection across the component tree after events, so heavy templates or unoptimized bindings make every interaction a little slower rather than making any single request fail. Watch interaction latency trends, not just pass/fail results.
The common thread: framework problems rarely produce failed requests. They produce delay and missing content, which is precisely what real-browser checks measure and HTTP checks cannot see.
The API Dependency Problem
In an SPA, API performance is user experience. A single dashboard view might assemble itself from a handful of endpoints: session, user profile, permissions, primary data, notifications. The slowest blocking call gates the whole view, and users don’t experience “one endpoint is degraded.” They experience an app that feels broken.
A slow token refresh delays every authenticated call queued behind it. The recommendations and cart endpoints time out. The page renders with empty sections, the user reloads, and the reload doubles the load on the very services that were struggling. Each service looked healthy in isolation. Only the browser saw them fail together.
Third-party dependencies raise the stakes further. Payment processors, authentication providers, analytics tags, and chat widgets all load into the same page, and any of them can degrade on a schedule you don’t control. You can’t fix a vendor’s infrastructure, but you can find out before your users do.
The practical answer is to monitor on two levels. Monitor critical endpoints directly with web API monitoring to get clean data on response time, error rate, and payload correctness per endpoint. Then monitor the same endpoints in context with browser checks, because a 300 ms endpoint that blocks rendering hurts users more than an 800 ms one that doesn’t. The waterfall chart is where the two views meet: every request the page made, in order, with timing, so you can see which call actually held the view hostage.
A workable incident rule: if the direct API check is slow and the browser step is slow, start with the service. If the API check is clean but the browser step is slow, look for client-side blocking: bundle execution, hydration, a third-party script, or a request waterfall that serializes calls that should run in parallel. If both are green and users still complain, compare regions and authenticated roles before blaming the monitor.
Browser Monitoring Metrics That Matter
The scoreboard for a modern web app has two halves: the Core Web Vitals Google uses to describe loading experience, and the SPA-specific timings those vitals don’t cover.
| Metric | What it tells you | Good (75th percentile) |
|---|---|---|
| Largest Contentful Paint (LCP) | How quickly the main content becomes visible | ≤ 2.5 s |
| Interaction to Next Paint (INP) | How responsive the page is to clicks, taps, and keys across the whole visit | ≤ 200 ms |
| Cumulative Layout Shift (CLS) | How much content jumps around while loading | ≤ 0.1 |
The thresholds are Google’s published targets, assessed at the 75th percentile of page loads. One deprecation worth flagging: First Input Delay (FID) was retired in March 2024, when INP replaced it as the responsiveness vital. INP is a harder judge, since it measures the latency of interactions throughout the visit rather than only the delay before the first one. If a dashboard still reports FID, it’s describing a metric Google no longer uses.
Core Web Vitals were designed around page loads, so they describe the first impression well and say little about the hours a user spends inside the app afterward, where soft navigations do the work. Round out the picture with SPA-specific measurements:
- Route-change duration. Time from the triggering click to the new view’s content being rendered, tracked per route, since a heavy admin route and a lightweight settings page have no business sharing a threshold.
- Per-step transaction timing. A scripted journey (log in, search, add to cart, pay) with a timing baseline for each step, so a regression points at the step that slipped.
- API response time and error rate per endpoint. Broken out by endpoint, not averaged across the app, because averages hide the one slow call that blocks rendering.
- JavaScript console errors. Uncaught exceptions and failed resource loads during checks are early warnings of features silently degrading.
- Third-party blocking time. How much of the load and interaction path is spent waiting on scripts and services you don’t operate.
How to Monitor a Single Page App (Step by Step)
Here is a setup sequence that puts the pieces above into practice.
Step 1: Start With a Real-Browser Uptime Check
Point a real-browser check at your app’s entry URL on a steady frequency. Unlike an HTTP ping, it downloads the bundle, executes the JavaScript, and renders the page in a real browser, so it fails when the app fails, not just when the server does. This is the baseline layer of web application monitoring: cheap, frequent, and honest about whether the app actually comes up.
Step 2: Script the Journeys That Pay the Bills
Pick the three to five flows that create revenue or retention: sign-in, search, checkout, the core workflow of the product. Record each as a scripted transaction with a tool like EveryStep, which captures real clicks, keystrokes, and waits in a browser session and replays them on schedule. Scripted journeys are the only checks that exercise client-side routing the way users do.
Step 3: Assert on Rendered Content With Stable Selectors
At each step, assert that something meaningful rendered: the order total appears, the search returns a result row, the dashboard chart draws. Assert state, not just presence: check that the submit button becomes enabled once the form is valid and that the loading spinner has left the DOM, not merely that a container exists. Target stable attributes such as data-testid or ARIA roles instead of auto-generated class names, and your scripts survive deploys instead of crying wolf after each one.
Step 4: Add Direct API Checks for the Endpoints Behind It
Give every endpoint your critical views depend on its own check, with response-time thresholds and content validation, third-party services included. When a browser check fails, the endpoint data tells you in seconds whether the fault is the frontend, your API, or a vendor.
Step 5: Run From the Regions Your Users Are In
A bundle that loads fast next to your origin can crawl across an ocean, and CDN or DNS issues are often regional. Run checks from the geographies your traffic actually comes from, so you catch the slowdown your users in Singapore feel rather than the one your data center doesn’t.
Step 6: Alert on Steps, Not Just Sessions
Set thresholds per journey step, not one timeout for the whole script, and alert on sustained degradation rather than a single slow run. A checkout step that drifts from two seconds to six is a problem worth waking someone for, even while the script still technically passes. Well-tuned monitoring alerts are the difference between a system you trust and one you mute.
Synthetic Monitoring vs Real User Monitoring for SPAs
Real user monitoring (RUM) instruments the app with a JavaScript snippet and reports what actual visitors experienced. Its strength is breadth: real devices, real networks, and field data for Core Web Vitals. Its structural limit is that it needs traffic. It cannot see a broken checkout at 3 a.m. before users hit it, cannot test a flow behind a login you’d rather not instrument, and only surfaces a regression after enough users have already suffered it.
Synthetic monitoring inverts the model: controlled, scheduled, scripted checks that catch failures with zero users involved and produce clean baselines you can compare week over week. For SPAs specifically, synthetic browser checks are the layer that exercises routing, rendering, and API dependencies on your schedule instead of your users’. For SPAs, put paging alerts in synthetic and keep RUM as the investigation layer: RUM shows how many real users were hurt and on which devices, while synthetic answers whether login, search, or checkout is broken right now, even when nobody is using it yet. Field data from sources like Google’s Chrome UX Report then complements those checks with the real-world spread of devices and networks.
The Bottom Line
Modern web apps moved the work, and the failures, into the browser. The initial HTML proves nothing, navigation happens without page loads, and every view depends on a chain of API calls that can each quietly fail. Monitoring has to move with them: real-browser checks that assert on rendered content, scripted journeys through the routes that earn revenue, direct checks on the endpoints underneath, and metrics (LCP, INP, CLS, route-change and per-step timing) that describe what users feel rather than what servers report. If your current monitoring can’t tell a rendered page from a blank shell with a 200 behind it, that’s the gap to close first.
Monitor Your Web App in a Real Browser
Run scripted, real-browser synthetic monitoring against your React, Vue, or Angular app from a global network and see every step, request, and render the way your users do. Start a free trial.