Now you can monitor any SNMP capable devices on your network using the Dotcom-Monitor MetricsView product. Simply download and install the MetricsView Agent onto a machine in your network and setup the monitoring parameters in your account.
A Complete Monitoring Solution
Many organizations utilize Dotcom-Monitor solutions to help manage different parts of their networks, websites and servers, but such monitoring only gives you insight into a limited data set regarding your overall environment. You can use https tasks, BrowserView tasks and UserView scripts to monitor the uptime and performance of your website, but do you know how the underlying hardware components of your network are affecting the website performance? With MetricsView, now you can record those variables as well and visualize them side-by-side next to your website performance metrics to see performance correlations and help troubleshoot issues.
Three Types of Monitoring
MetricsView offers three different types of monitoring within your environment: Windows Performance Counters, SNMP monitoring, and custom counter monitoring. These monitors are best utilized in conjunction with the core website monitoring tasks to create a holistic view of web infrastructure performance. Displaying each of these metrics on a line chart on the customizable dashboards gives you the ultimate visibility into the correlation between system metrics and website performance.
Utilizing the MetricsView Agent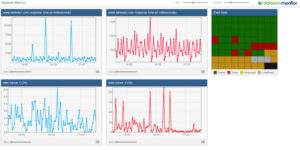
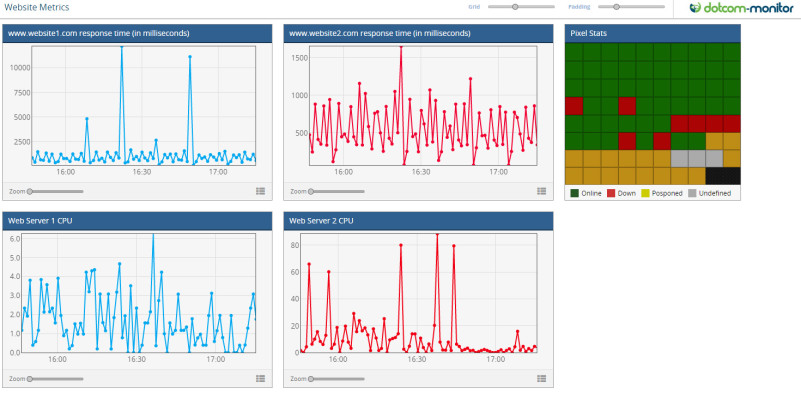
With the MetricsView agent installed on your network you can chose to monitor any number of the vast array of Windows Performance Counters available on your servers as well as SNMP values reported from your networking devices such as firewalls, routers, switches and more. Uploading all of this data to your account in the Dotcom-Monitor cloud retains the history so that you can go back and identify sporadic issues and even view trends where multiple variables could be correlated side-by-side.
SNMP Monitoring: the next logical step
SNMP monitoring is the next logical step in the complete monitoring solution from the Dotcom-Monitor platform. Being able to see website performance, server usage and networking device traffic data all in one place gives you powerful troubleshooting and optimization tools. SNMP monitoring also has the ability to define performance thresholds that will automatically notify you when something is happening outside of normal performance levels.
Monitor Performance Behind Your Firewall
MetricsView is installed as an agent on a machine in your network- behind your firewall, which allows you to monitor performance values that would be unreachable from external-only monitoring. There is no need to install the agent on every machine you wish to monitor, simply make sure the agent has proper permissions on the network and it can monitor all of your devices at once.
Aggregate Windows Performance Counter Data
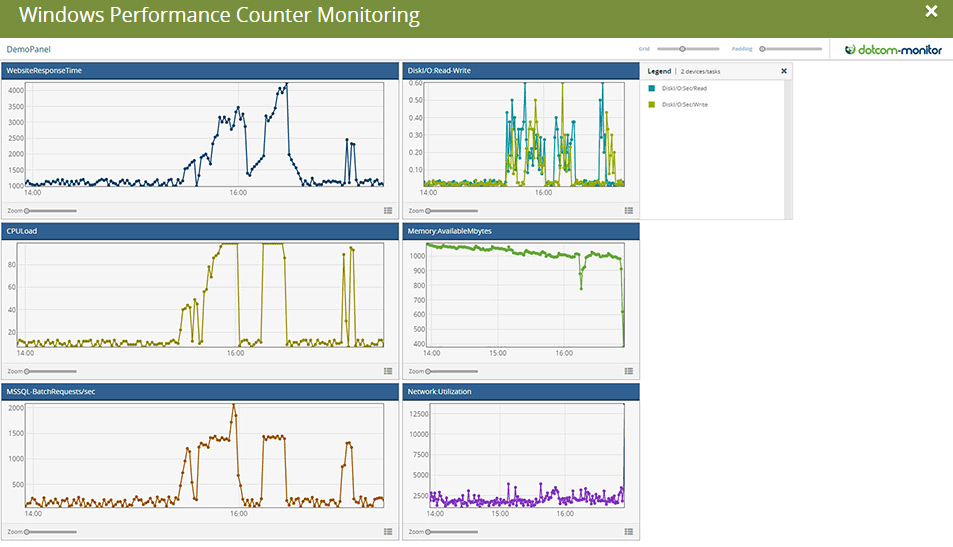
Any data that is reported by Windows Performance Counters can be collected by the MetricsView Agent and aggregated within your account at Dotcom-Monitor. Once the data is uploaded to the cloud, you are able to schedule automated reports on a daily weekly or monthly basis. You can log in to the web portal and run on-demand reports including charts of values over time, like CPU usage and bandwidth utilization, and you can create real-time dashboards displaying recenthistory of your windows server performance.
Upload Custom Metrics to Cloud via API
Custom metrics were designed to allow you to report on any values you can gather on your end. You upload your custom metrics to the Dotcom-Monitor cloud via the easy to use API. Once uploaded, your custom metrics are available for reporting along side of the rest of your metrics. You can even set up custom alert thresholds to send you email, sms text messages, SNMP pushes and phone calls when a threshold has been crossed. While users of the Dotcom-Monitor platform have been able to monitor Windows Performance Counters and Custom Metrics for a while now, the ability to monitor SNMP data was recently added to the capabilities of the MetricsView Monitoring Agent. If you are not currently using the MetricsView Agent, sign up now and start a free trial today. If you are a current client, download the agent and setup your MetricsView trial now by contacting your account representative.