 For many teams, API uptime monitoring still means one simple thing: checking whether an endpoint responds with a 200 OK. If the check passes, the API is marked as “up.” If it fails, an alert is triggered. On paper, that sounds reasonable. In practice, it’s one of the most common reasons API outages go unnoticed until users complain.
The problem is that modern APIs are no longer simple, stateless endpoints. They rely on multiple moving parts, including:
- Authentication and authorization flows
- Databases and background jobs
- Third-party services and external APIs
- Region-specific infrastructure and routing
Because of this complexity, an API can return a successful status code while still failing in meaningful ways. The response might contain incomplete data, outdated values, or logically incorrect results. From a monitoring dashboard, everything looks healthy. From a user’s perspective, the API is effectively down.
This disconnect creates what many teams experience as false uptime. Basic uptime checks are good at answering a narrow technical question:
- API uptime monitoring confirms an API is reachable, fast, and returning correct results.
- “200 OK” alone can hide silent failures (bad payloads, auth failures, partial data).
- Production uptime should include multi-step transactions and multi-region checks.
That’s why API uptime monitoring needs a broader definition. It must account for availability, correctness, and performance from the user’s point of view, not just the server’s ability to respond.
Real downtime isn’t theoretical; it has a measurable financial impact. According to Gartner, the average IT outage costs about $5,600 per minute, or roughly $300,000 per hour for many organizations. And in independent research, more than 90% of mid-size and large firms report hourly downtime costs above $300,000, with 41% saying outages can exceed $1 million per hour. These losses come from missed transactions, lost productivity, SLA penalties, and damage to customer trust, all of which basic checks often fail to detect.
In this guide, we’ll explore what API uptime monitoring really means today, why common approaches fall short, and how teams can design monitoring strategies that reflect real-world usage. So “API up” actually means “API working.”
What API Uptime Monitoring Really Means Today
At its core, API uptime monitoring is meant to answer a simple question: Can consumers rely on this API right now? The problem is that many teams still define “uptime” too narrowly, focusing only on whether an endpoint responds to a request. In modern systems, that definition no longer holds up.
APIs sit at the center of distributed architectures. They authenticate users, orchestrate workflows, and depend on multiple internal and external services. Because of this, uptime is no longer a binary concept. An API can be reachable and still unusable.
The difference between basic uptime checks and modern API uptime monitoring becomes clearer when you look at how monitoring is actually performed. Instead of a single ping from one location, effective monitoring validates real workflows from multiple regions and dependency paths.
A more accurate definition of API uptime includes three equally important dimensions:
- Availability – Can the API be reached from where users are located?
- Correctness – Does the API return the expected data, structure, and values?
- Responsiveness – Does the API respond within acceptable latency thresholds?
If any one of these fails, users experience downtime, even if your monitoring tool reports 100% uptime.
This is where many traditional uptime checks fall short. A single-region HTTP check might confirm that an endpoint returns a 200 OK, but it won’t tell you if authentication is failing, if a downstream dependency is timing out, or if users in another region are seeing degraded performance. From an engineering perspective, everything looks green. From the outside, the API is broken.
To understand uptime properly, API monitoring needs to be aligned with how APIs are actually consumed. That means observing APIs as systems, not just endpoints. It also means connecting uptime monitoring with broader reliability practices such as logging, tracing, and metrics, areas commonly discussed under API observability. While observability provides deep internal insight, uptime monitoring serves a complementary role: validating what real users experience from the outside.
When done correctly, API uptime monitoring acts as an early-warning system. It detects failures before users report them, highlights regional or conditional issues, and surfaces problems that internal metrics alone may miss. Instead of answering “Did the server respond?”, it answers a far more useful question: Is the API reliably delivering value right now?
This shift in definition is the foundation for everything that follows. Once uptime is framed around real usability, the limitations of basic checks become clear, and so does the need for more robust monitoring strategies.
Why Basic Uptime Checks Fail Modern APIs
Basic uptime checks were designed for a simpler era; when an application exposed a small number of predictable endpoints and success could be measured by a single response code. Modern APIs don’t work that way anymore. Yet many monitoring setups still rely on the same outdated assumptions.
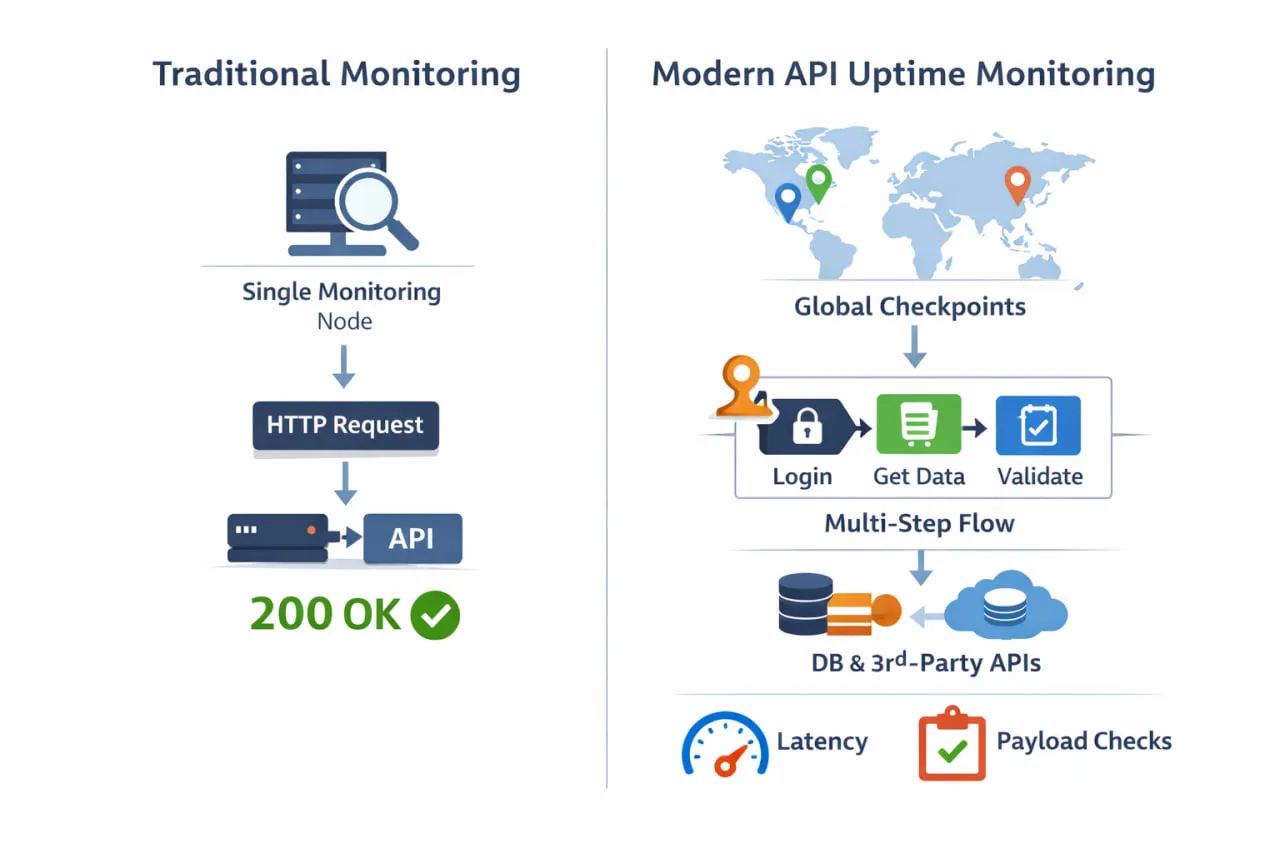
The limitations of basic uptime checks become obvious when you compare them side by side with modern, production-grade API uptime monitoring.
| Capability | Traditional Uptime Checks | Modern API Uptime Monitoring |
| Monitoring location | Single region | Multiple global regions |
| What’s checked | Endpoint reachability | End-to-end API usability |
| Authentication support | Rare or none | Full support (tokens, headers, OAuth) |
| Response validation | Status code only | Payload, schema, values, logic |
| Workflow monitoring | Not supported | Multi-step / transactional flows |
| Dependency awareness | None | Detects downstream failures |
| Performance insight | Basic or average latency | Trends, thresholds, degradation |
| Silent failure detection | ❌ Missed | ✅ Detected early |
| User experience alignment | Low | High |
Traditional uptime pings might tell you a server is technically reachable, but they don’t protect you from costly silent failures. Some industry writeups estimate average downtime costs approaching $14,000 per minute. That’s hundreds of thousands of dollars every hour an API is impaired, even if superficially “up.”
One of the most common failure modes is the “200 OK illusion.” An API may respond successfully at the HTTP level while failing at the business logic level. For example, the response might:
- Return an empty or partial payload
- Contain stale or incorrect data
- Omit required fields or break schema expectations
From a traditional uptime check, this looks like success. For users and downstream systems, it’s a silent failure.
Authentication introduces another major blind spot. APIs often rely on expiring tokens, rotating keys, or role-based access. A basic check that doesn’t fully simulate authentication flows won’t detect issues like expired credentials or misconfigured permissions. The endpoint is reachable, but no real consumer can use it.
Dependencies make the problem worse. Most APIs rely on databases, message queues, and third-party services. If a downstream dependency degrades or fails intermittently, the API might still respond, but with increased latency, partial results, or inconsistent behavior. These are exactly the kinds of issues basic checks are least equipped to catch.
Geography adds yet another layer of complexity. Many uptime checks run from a single location, often close to where the infrastructure is hosted. This hides regional issues caused by routing problems, ISP outages, or CDN misconfigurations. Users in one part of the world may be experiencing timeouts while monitoring dashboards show everything is fine.
These limitations explain why teams often believe they have strong API uptime monitoring, until customers report problems first. What’s missing is visibility into how APIs behave under real-world conditions.
This is why modern uptime strategies combine reachability checks with the ability to validate API response correctness and monitor API latency trends across regions, so issues are detected based on real user impact, not just server availability.
Until monitoring moves beyond basic reachability checks, teams will continue to miss the issues that matter most.
The Core Metrics That Define True API Uptime
Once you move past the idea that uptime simply means “endpoint reachable,” the next question becomes clear: what should API uptime monitoring actually measure? Effective monitoring focuses on a small set of metrics that reflect how APIs behave in the real world—not just on paper.
1. Availability (Reachability)
Availability answers the most basic question: Can the API be reached from a given location?
This metric is still important, but it’s only the starting point. An API that responds to requests but fails in other ways is technically available, yet practically unusable.
2. Latency (Responsiveness)
Latency measures how long the API takes to respond. Even when requests succeed, slow responses feel like downtime to users. Monitoring should track:
- Response times against defined thresholds
- Latency trends over time, not just averages
This helps teams catch gradual performance degradation before it becomes an outage.
3. Response Correctness
This is where many uptime strategies fall short. Correctness focuses on what the API returns, not just that it returns something. In practice, response correctness is validated using assertions.
For example, teams may check that required fields exist using JSONPath, confirm numeric values fall within expected ranges, or verify that the response schema matches an expected structure. These checks ensure a 200 OK truly represents a successful outcome.
Without response validation, monitoring dashboards can show 100% uptime while users experience failures.
4. Regional Consistency
APIs are consumed globally, but failures are often regional. Network routing issues, ISP outages, or localized infrastructure problems can affect one geography while leaving others untouched. Monitoring from multiple locations ensures uptime reflects user reality, not just infrastructure proximity.
5. Error Behavior
Not all failures are equal. Tracking error types adds crucial context to uptime data:
- 401/403 errors often signal authentication issues
- 500-level errors point to server-side failures
- Timeouts usually indicate downstream or performance problems
When these metrics are monitored together, uptime becomes a meaningful reliability signal rather than a vanity number.
This is why true API uptime monitoring naturally overlaps with API performance monitoring. Performance trends, correctness checks, and regional visibility all contribute to understanding whether an API is genuinely usable.
By focusing on these core metrics, teams move from reactive monitoring to proactive reliability, catching issues early, reducing false confidence, and aligning uptime with real user experience.
Mapping API Uptime to SLOs and SLIs
As APIs mature, uptime stops being a vague percentage and becomes a reliability commitment. This is where service-level objectives (SLOs) and service-level indicators (SLIs) come in.
Instead of asking, “Is the API up?”, teams define uptime in terms of measurable user experience:
- Availability SLI – Are requests succeeding?
- Latency SLI – Are responses fast enough?
- Correctness SLI – Are responses accurate and complete?
API uptime monitoring feeds directly into these indicators. Availability checks confirm reachability, latency tracking exposes slowdowns, and response validation ensures the API behaves correctly, not just technically, but functionally.
An SLO then defines the acceptable threshold for each indicator. For example, an API might target:
- 99.9% successful responses
- 95% of requests under 300 ms
- Zero schema or validation failures for critical endpoints
When uptime monitoring is aligned with SLOs, alerts stop being arbitrary. They signal when user-facing reliability is at risk, not just when a server fails to respond. This reframes uptime from a vanity metric into a decision-making tool that guides engineering priorities and incident response.
How to Calculate True API Uptime
True API uptime isn’t just about whether an endpoint responds. It’s calculated based on how many requests actually succeed from a user’s point of view.
Availability is measured as:
Availability SLI = good_requests / total_requests
A good request is one that:
- Returns a 2xx status
- Passes schema and response assertions
- Meets latency thresholds
Uptime should be measured over a defined window (for example, a rolling 28 days) and evaluated against a target SLO. The remaining margin (1 − SLO) becomes your error budget.
This approach ensures uptime reflects real usability, not just reachability.
How to Design an Effective API Uptime Monitoring Strategy
Designing an effective API uptime monitoring strategy isn’t about adding more checks—it’s about choosing the right checks and validating the right outcomes. The goal is to mirror real usage as closely as possible, without creating noise or blind spots.
Start with the APIs that matter most
Not every endpoint deserves the same level of scrutiny. Begin by identifying the APIs that are most critical to users and the business. These typically include:
- Authentication and authorization endpoints
- Core transactional or revenue-driving APIs
- Public or partner-facing APIs with external dependencies
Focusing on these APIs ensures uptime metrics reflect real impact, not just monitoring coverage.
Choose frequency with intent
It’s tempting to check every endpoint every few seconds, but higher frequency doesn’t always produce better insight. Monitoring intervals should be based on:
- How quickly failures need to be detected
- How tolerant users are of short disruptions
- The risk of alert fatigue
For high-impact APIs, frequent checks are justified. For lower-risk services, longer intervals often provide enough signal without unnecessary noise.
Monitor multi-step and transactional flows
Most modern APIs don’t operate in isolation. A single user action often triggers several API calls in sequence. Monitoring only individual endpoints can miss failures that occur between steps.
This is where multi-step API monitoring becomes essential. Instead of checking endpoints independently, teams monitor entire workflows, such as authentication, data creation, retrieval, and validation, as a single transaction. This approach exposes issues that simple uptime checks can’t catch.
Validate more than status codes
True uptime monitoring requires validating responses, not just receiving them. Effective checks assert:
- Response structure and required fields
- Specific values that indicate success
- Business rules that confirm the API is behaving correctly
Without this level of validation, uptime dashboards can show 100% availability while users experience broken functionality.
Include authenticated and private APIs
Many critical APIs sit behind authentication or firewalls. A realistic uptime strategy must support tokens, headers, and credential rotation. Otherwise, teams end up monitoring only the least important parts of their system.
Dotcom-Monitor’s Web API Monitoring and REST API monitoring capabilities support authenticated and private endpoints, allowing teams to monitor the same APIs their applications rely on in production.
Monitor from where users are
Single-location monitoring creates a false sense of reliability. APIs should be monitored from multiple geographic locations that reflect actual user distribution. This helps uncover regional latency spikes, routing issues, and ISP-related outages before they escalate.
Align uptime with reliability goals
Finally, uptime monitoring should align with service-level objectives (SLOs). Instead of asking “Is the API up?”, teams should ask:
- Is it meeting availability targets?
- Is performance within acceptable limits?
- Are error rates exceeding thresholds?
When uptime metrics align with reliability goals, monitoring becomes actionable rather than purely informational.
For teams implementing these strategies, Dotcom-Monitor’s documentation, such as Web API monitoring setup and Add/Edit REST Web API task (with advanced configuration options also covered in Configuring REST Web API tasks), makes it easier to move from basic checks to production-grade API uptime monitoring.
API Uptime Depends on the Consumer
API uptime isn’t one-size-fits-all. Internal APIs may tolerate brief interruptions but require strict correctness to keep workflows running. Public APIs demand consistent global availability and low latency to protect user experience and brand trust.
Partner or revenue-critical APIs carry the highest expectations, where even minor degradation can impact contracts or revenue. Effective API uptime monitoring adapts to these differences by prioritizing the endpoints, validation depth, and alert thresholds that reflect how the API is actually consumed.
Common API Uptime Monitoring Mistakes (and How to Avoid Them)
Even teams with mature monitoring stacks often fall into the same API uptime monitoring traps. These mistakes don’t usually come from negligence, they come from relying on oversimplified assumptions about how APIs fail in production.
1. Treating uptime as a status code check
One of the most common mistakes is equating uptime with a successful HTTP response. A 200 OK only confirms that the server responded, not that the API worked correctly. Without validating payloads, schemas, or business logic, teams end up measuring reachability, not usability.
How to avoid it:
Move beyond status codes by validating response content and expected values as part of your uptime checks.
2. Monitoring only from a single location
Running uptime checks from one geographic location—often close to your infrastructure—creates a false sense of reliability. Regional routing issues, ISP outages, or DNS problems can affect users in specific areas without triggering alerts.
How to avoid it:
Monitor APIs from multiple global locations that reflect where your users actually are.
3. Ignoring authenticated endpoints
Many teams avoid monitoring authenticated APIs because setup feels complex. As a result, the most critical APIs—those that require tokens, headers, or permissions—go unmonitored.
How to avoid it:
Use monitoring tools that support authentication, headers, and credential rotation so uptime reflects real application behavior.
4. Alerting on every failure
Alerting on every failed check leads to noise, alert fatigue, and eventually ignored notifications. Temporary network hiccups or single-region issues don’t always warrant immediate escalation.
How to avoid it:
Design alerting logic that verifies failures across locations or multiple checks before triggering alerts.
5. Treating uptime as a vanity metric
High uptime percentages look good in reports but often hide underlying issues. An API can meet its uptime target while still delivering poor user experience.
How to avoid it:
Tie uptime monitoring to reliability goals such as error rates, latency thresholds, and service-level objectives.
These mistakes explain why teams often feel confident in their monitoring, until users report issues first. Avoiding them requires a shift in mindset: uptime monitoring isn’t about proving systems are online, it’s about proving they’re usable.
This is also where broader practices like API monitoring tools and API health monitoring help fill the gaps left by basic checks, providing a more realistic view of API reliability.
When Native or Developer-Only Tools Stop Being Enough
Native and developer-focused tools are valuable early on. CI/CD checks, unit tests, and platform-level monitors help catch obvious issues before code reaches production. But as APIs scale and become customer-facing, these tools start to show clear limitations.
One major issue is environment bias. Developer-only tools typically run inside the same cloud, network, or pipeline as the API itself. That makes them effective for deployment validation, but weak at detecting problems users experience outside your environment, such as routing issues or regional outages.
Another limitation is scope and continuity. Most native checks are designed for short-lived executions, not continuous monitoring. They often miss issues that develop over time, including:
- Gradual latency increases
- Intermittent dependency failures
- Region-specific performance degradation
There’s also the problem of alert confidence. When alerts originate from inside your own infrastructure, teams often question whether an issue is real or just an internal anomaly. This uncertainty slows response times and leads to unnecessary investigations.
As APIs mature, teams need monitoring that provides an independent point of view, one that reflects how users actually experience the API. External uptime monitoring adds that missing perspective by validating availability and performance from outside your environment.
This is where REST API monitoring becomes essential. Instead of relying solely on internal checks, teams can continuously monitor APIs from multiple global locations, validate real responses, and confirm whether failures are widespread or isolated.
The shift away from developer-only tools usually isn’t theoretical. It’s triggered by missed incidents, delayed alerts, or customers reporting problems first. Recognizing these warning signs early helps teams evolve their monitoring strategy before reliability issues turn into business risks.
It’s also important to recognize the limits of synthetic uptime monitoring. While it confirms user-facing availability and impact, it doesn’t replace logs, traces, or metrics for deep root-cause analysis. Those tools work best together.
How Dotcom-Monitor Approaches API Uptime Monitoring
Dotcom-Monitor uses external synthetic monitoring from independent global checkpoints to validate availability, correctness, and performance as users experience it.
At the core of this approach is external, synthetic monitoring. APIs are tested from outside your infrastructure, using independent global checkpoints. This removes internal bias and ensures uptime data reflects what users experience, not what your own systems report.
Key capabilities that support this approach include:
- Global monitoring locations that reveal regional failures and latency issues
- Advanced response validation, so a 200 OK isn’t mistaken for a successful outcome
- Multi-step API monitoring that validates complete workflows, not just single calls
- Support for authenticated and private APIs, including headers, tokens, and custom logic
This makes it possible to detect silent failures that basic uptime checks miss, such as incorrect payloads, broken authentication flows, or partial dependency failures.
Another critical element is alert reliability. Dotcom-Monitor can be configured to reduce false positives using false-positive checks and alert rules based on error duration and the number of failing locations.. Alerts become signals, not noise.
Because monitoring is continuous, teams can also analyze trends over time. Latency spikes, regional degradation, and intermittent errors surface before they escalate into full outages. This shifts uptime monitoring from a reactive activity to a proactive reliability practice.
All of this is delivered through Dotcom-Monitor’s Web API Monitoring, which is designed specifically for production environments. Instead of monitoring what’s easiest to check, it focuses on what matters most: availability, correctness, and performance as experienced by real users.
For teams ready to move beyond basic checks, explore our production-grade Web API monitoring tool
