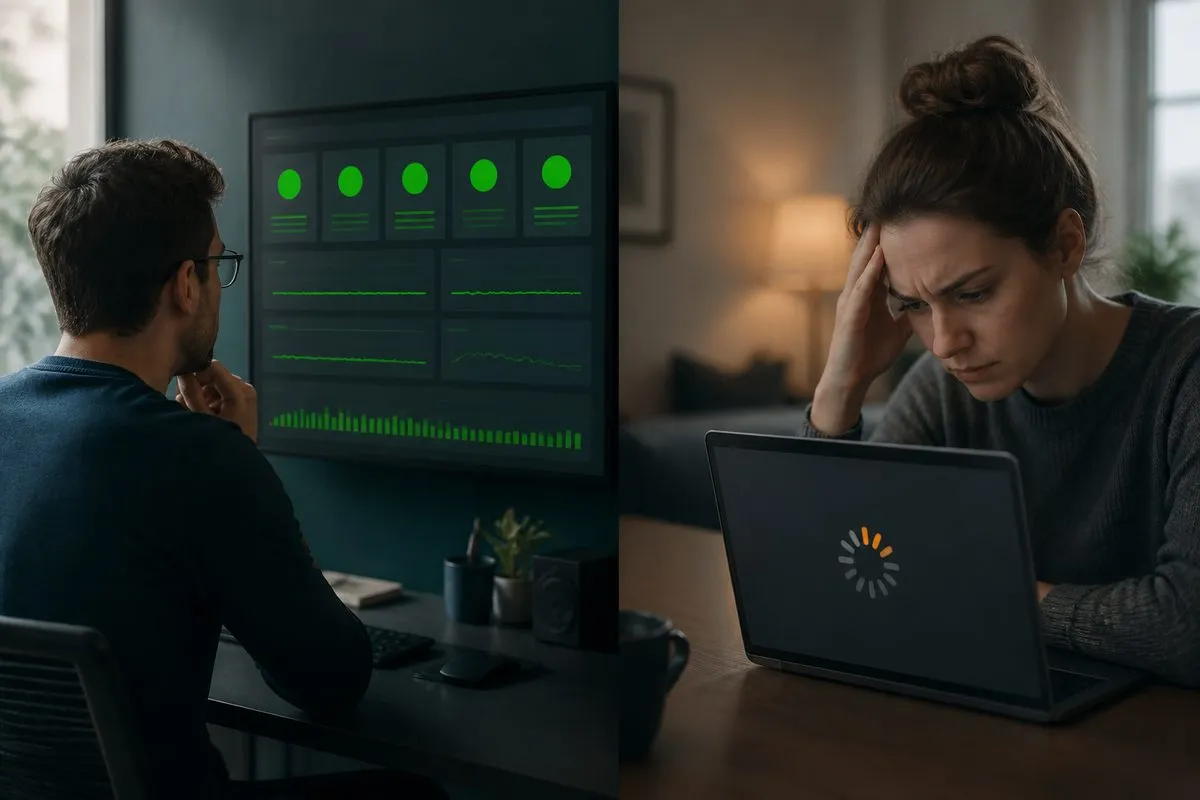
A shopper in Frankfurt clicks Pay and watches a spinner for ten seconds before giving up. Your APM dashboard stays green the whole time. No exception fired, no stack trace was captured, because nothing in your code failed. The payment provider’s script hung, the page never finished rendering, and the order walked. Your backend never even saw the final checkout request, so there is no failed transaction to inspect: from the application’s point of view, nothing happened. From the user’s point of view, the only step that mattered failed.
That is the blind spot this article is about. Stack trace monitoring is genuinely good at what it does: when your code throws, it hands developers the file, the line, and the chain of calls that led there. The problem is what it structurally cannot see. A whole class of user-facing failures happens before a request reaches your code, after your response leaves it, or without any error firing at all.
Here is what stack trace monitoring catches well, the five gaps it leaves in measuring the user experience, and how synthetic real-browser monitoring covers the territory it cannot.
What Is Stack Trace Monitoring?
A stack trace is a snapshot of the call stack at the moment an error occurs: which functions were executing, in which files, at which line numbers, and in what order they were called. If you have ever seen a console error listing a cascade of methods and file paths, you have read one.
Stack trace monitoring, as practiced by application performance monitoring (APM) tools, captures these traces automatically, groups them, and tracks how often each exception recurs. When a NullPointerException starts firing in the checkout service, the APM platform tells developers exactly where to look and how widespread the problem is. Exceptions that would otherwise vanish into a log file become ranked, trended, assignable work.
Notice the trigger condition, because everything else in this article follows from it: a stack trace exists only when code executes and raises an error. Both halves of that condition matter. If your code never runs, or runs without throwing, there is no trace, no matter what the user just experienced.
A practical way to hold that in your head: code ran and threw, you get a trace. Code ran slowly without throwing, no trace. The browser failed before reaching your code, no trace. Something outside your code blocked the journey after your response left, no trace. One state in four produces evidence, and users live in all four.
What Stack Trace Monitoring Catches Well
None of what follows is an argument against APM. For failures that originate in your code, stack traces are the fastest route from symptom to fix:
- Fast root-cause identification. A trace points at the failing line and the call path that reached it, cutting out most of the guesswork that manual debugging requires.
- Deep error context. Good traces carry method arguments, variable state, and request metadata, so developers see not just where the code broke but the conditions under which it broke.
- A shared language for engineering teams. A trace is precise and reproducible. Pasting one into a ticket communicates more than paragraphs of description could.
- Code quality trends. Tracking which exceptions recur, and where, exposes fragile modules and bad patterns worth refactoring before they cause an outage.
Keep your APM tool. The question is not whether stack traces are useful. It is whether they describe what your users are experiencing. They do not, and the gaps fall into five distinct categories.
The Gaps: What Stack Traces Miss About the User Experience
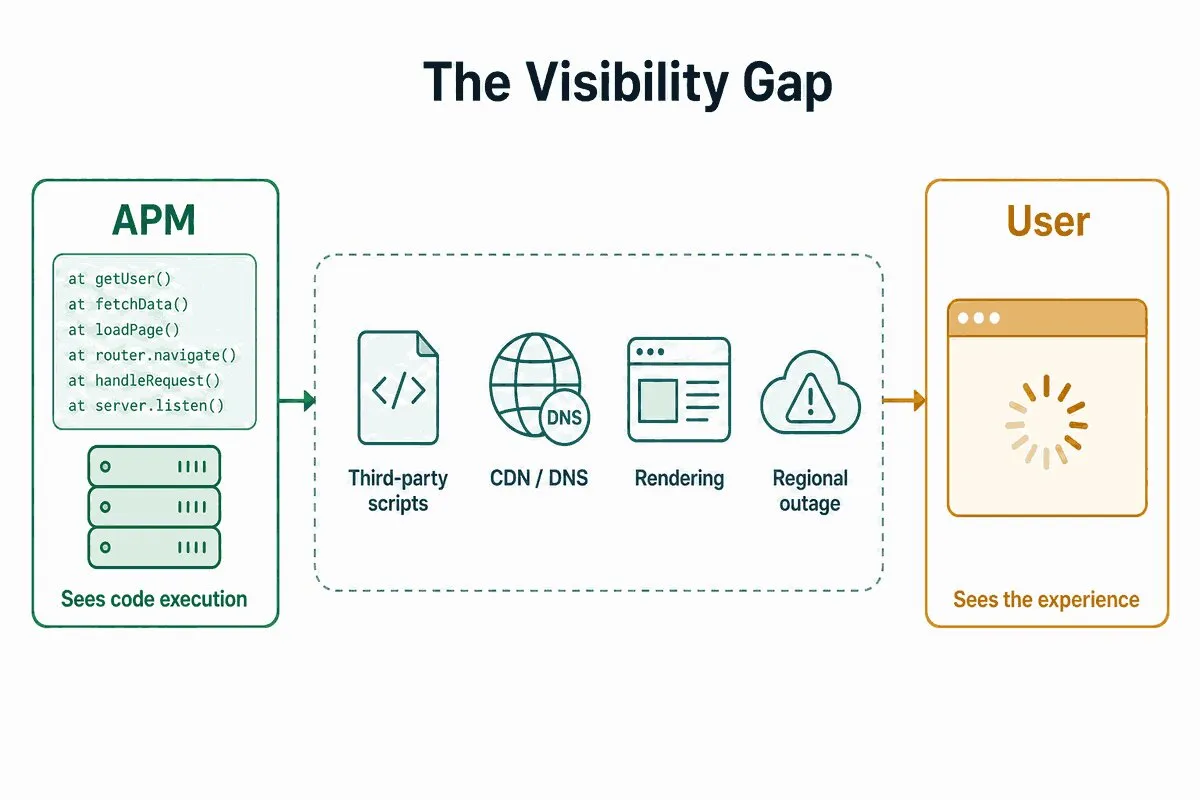
These five gaps are not random blind spots. They are boundary problems: borrowed code, pre-application infrastructure, browser execution, geography, and time. Stack traces are strong inside the application boundary and weak everywhere the user journey crosses out of it.
Third-Party Scripts and External APIs
A typical page today pulls in payment widgets, tag managers, chat, analytics, and ad scripts from other companies’ servers. When one of those dependencies hangs or slows, the page stalls for the user, but the failing code is not yours, so your instrumentation raises nothing. There is often no explicit exception anywhere: the third-party endpoint responds, just slowly enough to block rendering. Third-party content is the classic case where users suffer while every internal dashboard stays green.
DNS, TLS, and CDN Failures
Before a request ever reaches your application, it must resolve your domain, negotiate a TLS handshake, and often pass through a CDN edge. A misconfigured DNS record, an expired certificate, or a failing edge node stops users at the front door. Your code never executes for those visitors, which means the failure cannot generate a stack trace by definition. From inside your infrastructure, the most visible symptom is silence: traffic dips, and nothing explains why. The DNS, TCP, TLS, and HTTP layers each fail in ways only an outside-in check can observe.
Frontend Rendering and UI Failures
Server-side APM confirms your backend returned a valid response in good time. It says nothing about what the browser did with it. A JavaScript bundle that breaks in one browser version, a layout that collapses on mobile, a button whose click handler never binds: each leaves users staring at a broken page while the server logs a clean 200. Client-side exceptions can be collected separately, but slow rendering, layout shifts, and unresponsive controls mostly do not throw. They just quietly lose users. A hydration failure in a Next.js app is the modern classic: the server sends a perfect 200 with fully formed HTML, the client-side JavaScript fails, and users get a page that looks right and does nothing. The event worth monitoring is not whether JavaScript threw but whether the milestone completed: button clickable, form submitted, confirmation shown. Stack traces record exceptions; users experience missing milestones.
Regional Outages
Your instrumentation lives inside your infrastructure and reports aggregates. If a carrier route degrades between one region and your servers, or a CDN point of presence starts failing in one geography, users there face timeouts while your averages barely move. A stack trace has no concept of where the user was; it only knows which code was executing. Regional failures are invisible by construction to a code-centric view.
Slow Is Not an Exception
The subtlest gap: performance decay never throws. A page that drifts from two seconds to eight seconds generates zero errors while steadily driving users away. It is usually marketing that notices first, in a sagging funnel metric, long before an engineer’s pager goes off, because from the code’s perspective nothing is broken. Stack trace monitoring is also reactive by design, since it reports after an error has already occurred, and its output reads only to people who know the codebase. A stack trace itself tracks no response times, no page load speeds, no user-facing performance metric at all. An application can be slow enough to be unusable and, from a stack trace perspective, perfectly healthy.
| Failure | What the User Experiences | What Stack Trace APM Shows |
|---|---|---|
| Third-party script hangs | Page stalls mid-load, checkout blocked | Green — no exception in your code |
| A/B test script misfires | Half of users get a broken page variant | Green — the experiment is not your code |
| DNS record misconfigured | Site unreachable | Green — requests never arrive |
| TLS certificate expires | Browser security warning, user leaves | Green — handshake fails before your code runs |
| JS bundle breaks in one browser | Dead buttons, broken layout | Clean 200s server-side |
| CDN edge degrades in one region | Ten-second loads in that geography | Normal aggregate response times |
| Gradual performance decay | Slower pages, rising abandonment | No errors, nothing to report |
How Synthetic Monitoring Fills the Gaps
Synthetic monitoring approaches the problem from the opposite direction. Instead of instrumenting your code and waiting for it to throw, it runs scheduled, scripted checks against your application from real browsers at locations around the world, measuring exactly what a user at that place and moment would get. That inversion covers each gap directly:
- It loads the whole page, not just your code. A real-browser check executes every third-party script the page carries. If the tag manager hangs or a payment widget slows the load, the check catches it, and a waterfall chart shows which resource stalled and for how long.
- It starts where the user starts. Every check resolves DNS, negotiates TLS, and traverses the CDN from outside your network. An expired certificate or dead edge node fails the check within one monitoring cycle, instead of surfacing as an unexplained traffic dip hours later.
- It renders in a real browser. Because the check drives an actual browser engine, broken scripts, unresponsive elements, and rendering failures surface as failed steps, not as invisible client-side problems.
- It runs from many geographies. Checks from a global network of locations isolate regional failures: when Frankfurt fails while Dallas passes, you know the problem’s scope before users tweet about it.
- It measures speed on every run, error or not. Each check records load and per-step timing, so an eight-second page raises an alert on a threshold you set, long before anything technically breaks.
The triage rule that falls out of this: a check that fails before the first byte points at DNS, TLS, or CDN ownership. A waterfall stalled on a third-party domain means the vendor owner gets the first call, not the application team. A scripted step that reaches your backend while APM shows an exception goes to engineering with the trace already attached.
Multi-step flows get the same treatment. With EveryStep scripting, a check can log in, search, add to cart, and pay on a schedule, around the clock, so the paths that earn revenue are verified continuously rather than assumed healthy.
To be clear about what synthetic monitoring is not: it does not see inside your code. When a check fails because your backend threw an exception, the stack trace, not the browser, tells the developer which line to fix. That is precisely why the two belong together.
APM and Synthetic Monitoring: Better Together
This is not an either/or decision, and treating it as one is how teams end up blindsided. APM with stack traces monitors from the inside out and answers why did the code fail? Synthetic monitoring watches from the outside in and answers can users actually do the things that matter, right now, from where they are? Each covers the other’s blind spots.
When selecting your monitoring stack, compare application performance monitoring tools for APM coverage and web application monitoring tools for browser-based checks and user journeys.
The dangerous failures are the ones each tool alone would miss: for APM, a checkout blocked by a vendor’s script; for synthetic checks alone, an exception that only fires under rare inputs. Run both and neither class hides.
In practice the two form a pipeline. A synthetic check fails a checkout flow from Frankfurt. The waterfall isolates the failing layer: DNS, CDN, a third-party call, or your own backend. If the trail ends at your application, the stack trace in your APM tool takes over and names the function that threw. Detection from the outside, diagnosis on the inside, and no gap between what your dashboards say and what your users see. It also ends the standoff every responder knows, where one team insists APM is green and another insists users are complaining: running APM alone is security cameras inside the vault with none on the front door, a perfect recording of the theft discovered after the vault is empty.
Dotcom-Monitor sits on the synthetic side of that pairing. It is not an APM platform and does not replace tools like New Relic or Datadog; it complements them with real-browser synthetic monitoring from a global location network, with per-step timing, waterfall detail, and alerting when a flow slows or breaks.
The Bottom Line
Stack trace monitoring earns its place: when your code throws, nothing gets a developer to the failing line faster. But its trigger condition, code that executes and errors, defines exactly what it can never show you. Third-party scripts, DNS and CDN failures, frontend rendering breaks, regional outages, and slow-but-error-free degradation all hit users without leaving a trace, in the literal sense.
Synthetic real-browser monitoring closes those gaps by testing the full path users travel, from every geography you care about, on a schedule that catches problems before support tickets do. Keep the stack traces for diagnosis. Add outside-in checks for detection. Your users experience the whole path, so your monitoring should cover the whole path too.
See What Your APM Can’t
Run real-browser synthetic monitoring on your critical user flows from a global network, and catch the failures that never throw an exception. Start a free trial.