
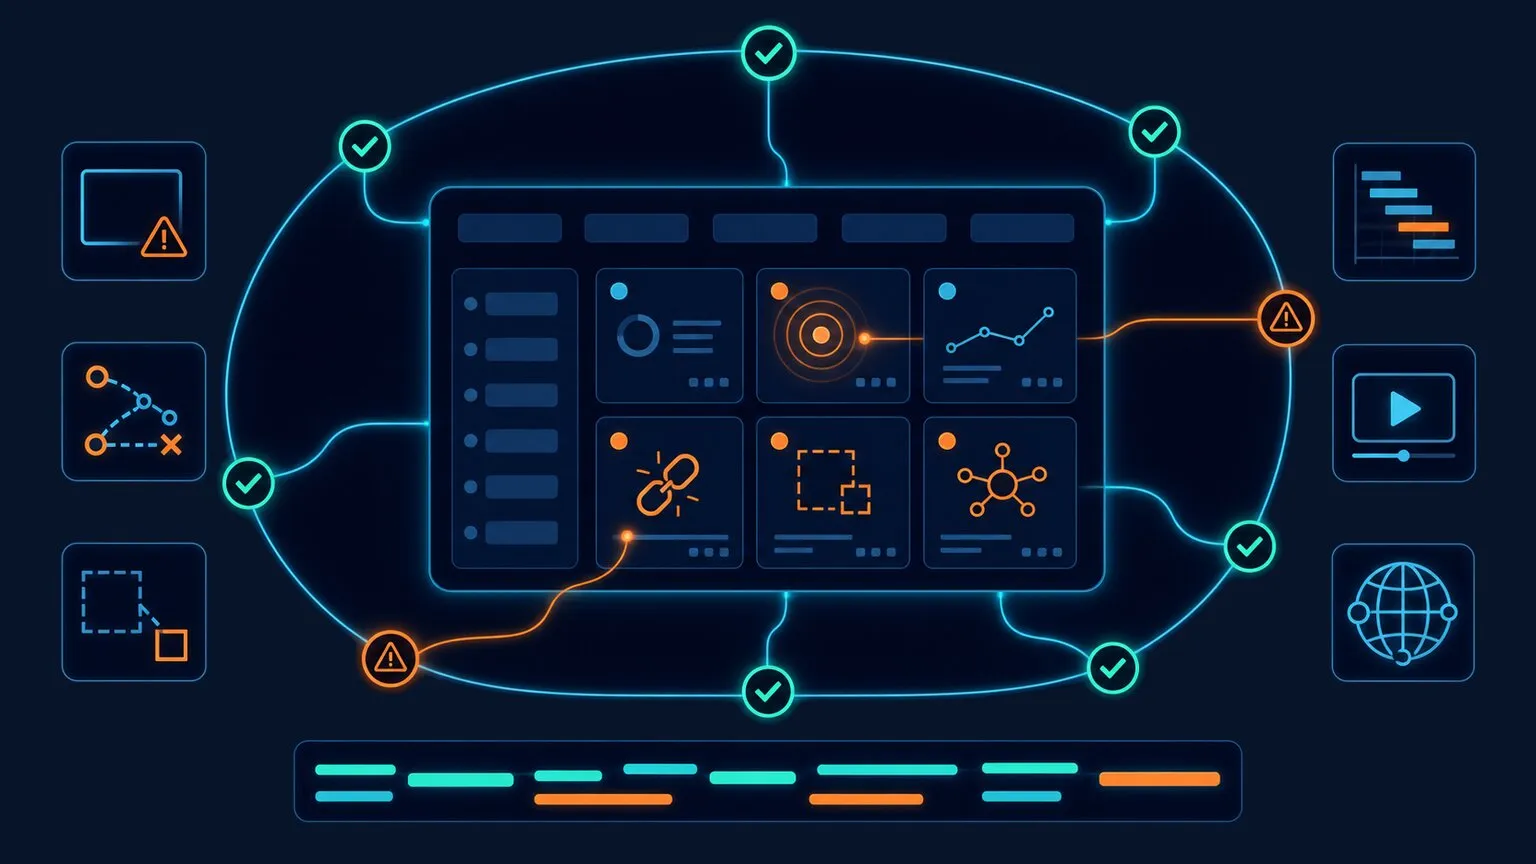
ReactJS has transformed web development, powering fast, dynamic applications that feel more like desktop software than websites. But the very things that make React apps feel fast — client-side rendering, virtual DOM updates, single-page navigation — are what make them hard to monitor. Traditional uptime checks and page-load metrics were built for server-rendered websites, and they routinely miss what actually breaks in a React app.
This guide walks through the most common ReactJS applications monitoring challenges, the built-in tools React gives you during development, and how Dotcom-Monitor’s synthetic monitoring catches problems in production before your users do.
Why Monitoring ReactJS Applications Is Different
With a traditional server-rendered website, the server responds to an HTTP request with a complete HTML document. Monitoring is straightforward: measure how long the server takes to respond, confirm the HTML arrived, and you have a reasonable picture of what the user saw.
React flips that model. The server often delivers a nearly empty HTML shell, and the real work — fetching data, building the DOM, attaching event handlers — happens in the user’s browser. A monitoring tool that only checks the HTTP response will report “200 OK, page loaded in 300ms” while your users stare at a blank white screen because a JavaScript bundle failed to load.
That gap between what the server sent and what the user experienced is the root of nearly every React monitoring challenge.
Dotcom-Monitor emulates real user interactions across more than 40 desktop and mobile browsers, so it measures what the user actually sees — rendered content and load times — rather than just the HTTP response. See how in Web Application Monitoring.
The 7 Biggest ReactJS Monitoring Challenges
1. Client-Side Rendering Hides Real Load Times
In a client-side rendered (CSR) React app, “page loaded” is ambiguous. The HTML document may arrive in milliseconds, but the meaningful content doesn’t appear until React downloads, parses, and executes the JavaScript bundle, fetches data from APIs, and renders components. Metrics like Time to First Byte (TTFB) look great while Largest Contentful Paint (LCP) — the metric users and Google actually care about — suffers.
What to measure instead: Core Web Vitals (LCP, FID, CLS) captured in a real browser, not raw HTTP timings.
Dotcom-Monitor’s Single Web Page monitoring loads your page in a real browser to capture true load times, and its Lighthouse Report monitoring continuously tracks Core Web Vitals, performance, SEO, and accessibility — so CSR slowness surfaces before users feel it. See Selecting the Right Web Monitoring Type.
2. Single-Page Application Route Changes Are Invisible to Traditional Tools
React Router and similar libraries update the URL and re-render content without a full page load. To a conventional monitoring tool, a user who navigates through ten screens of your app generated exactly one pageview — and if screen seven is broken, no page-load metric will ever show it.
These “soft navigations” need to be measured explicitly: how long does the checkout step take to render after the user clicks “Continue”? Only a monitoring approach that executes real user flows can answer that.
The EveryStep Web Recorder records multi-step journeys across HTML5, AJAX, and WebSocket, and Dotcom-Monitor’s Multiple Step Process monitoring replays them in real browsers — validating every soft navigation step by step instead of collapsing them into one pageview.
3. JavaScript Errors Fail Silently
When a React component throws an error without an error boundary, part (or all) of the UI can unmount — the infamous white screen of death. The server never sees it. The HTTP status is still 200. Unless you’re monitoring the rendered result in an actual browser, these failures are invisible until customers complain.
Because Dotcom-Monitor runs in real browsers, it catches browser-level and JavaScript errors that HTTP checks miss. Its video capture records every test synced with the waterfall chart, so you can watch exactly what the user saw when a script failed — turning a silent white screen into a diagnosable event.
4. Hydration and SSR Add a New Failure Mode
Many production React apps now use server-side rendering or static generation (Next.js, Remix) to improve initial load and SEO. This helps, but it introduces hydration: the client-side JavaScript must “attach” to the server-rendered HTML. Hydration delays and underlying markup mismatches create an “uncanny valley”—a page that looks fully loaded but suffers from frozen, delayed interactivity because the main thread is choked or forcing a full client-side re-render. It is one of the most frustrating user experiences you can ship, and one that simple HTTP availability checks will never detect.
Multiple Step Process scripts don’t just load the page — they click, type, and assert on the result, with step-by-step validation and video playback. A page that visually renders but fails to process user interactions in a timely manner fails the test immediately, catching hydration bottlenecks a standard load check would completely pass.
5. Third-Party Dependencies You Don’t Control
React apps typically lean on third-party scripts and APIs — payment gateways, maps, analytics, authentication providers, CDNs serving your bundles. A slow or failing dependency degrades your app even when your own infrastructure is healthy. Without monitoring that inspects every network request a real browser makes, you can’t tell whether the slowdown is your code or someone else’s.
Every browser-based session includes a Waterfall Chart that shows each element’s DNS resolution, connection time, and load speed — so you can pinpoint exactly which third-party request slowed the page. Details in the Waterfall Chart knowledge base article.
6. Bundle Size and Code Splitting Regressions
Every new feature and npm package grows your JavaScript bundle, and bundle size directly drives load time on real-world devices and networks. Code splitting helps, but lazy-loaded chunks introduce their own risk: a failed chunk request breaks navigation mid-session. Monitoring needs to catch both gradual bundle bloat and hard chunk-load failures.
Dotcom-Monitor’s historical data tracking surfaces gradual load-time regressions over time, while the waterfall exposes a failed lazy-loaded chunk as a broken request. Content verification confirms expected elements actually rendered — so a broken code-split screen doesn’t pass silently.
7. Performance Varies Wildly by Device, Network, and Location
Because React shifts work to the client, performance depends heavily on the user’s device and connection. Your app may be snappy on your office fiber connection and unusable on a mid-range phone in another region. Server-side metrics are identical in both cases — only testing from multiple geographic locations in real browsers reveals the difference.
Dotcom-Monitor runs your scripted journeys from a global network of locations across 40+ desktop and mobile browsers, as often as once per minute — revealing CDN, latency, and regional issues local testing hides. For apps behind a firewall, a private agent monitors internal journeys, including SSO systems like Azure ADFS and OKTA.
React’s Built-In Tools for Development-Time Monitoring
React ships with useful profiling tools. They’re valuable during development — just understand their limits in production.
The Profiler Component
The <Profiler> API (stable since React 16.9 — don’t use the old unstable_Profiler import) measures how long a component subtree takes to render:
import { Profiler } from "react";
function onRender(id, phase, actualDuration, baseDuration, startTime, commitTime) {
console.log({ id, phase, actualDuration, baseDuration, startTime, commitTime });
}
<Profiler id="Checkout" onRender={onRender}>
<Checkout />
</Profiler>
- id — identifies which Profiler tree is reporting
- phase — “mount”, “update”, or “nested-update”
- actualDuration — time spent rendering this update
- baseDuration — estimated render time without memoization
- startTime / commitTime — when React began rendering and committed the update
This is excellent for pinpointing slow components, but it only measures render time — not data fetching, network latency, or what the user actually sees.
React Developer Tools Profiler
The React DevTools browser extension includes a Profiler tab with flame graphs and a “Highlight updates when components render” option that visually flags re-rendering components. It’s the fastest way to find wasted re-renders during development — the modern replacement for the long-removed React.addons.Perf API (deprecated in React 15, removed in React 16).
Why Development Tools Aren’t Enough
These tools require a developer at a keyboard. They can’t tell you that your checkout flow broke at 2 a.m., that a CDN region is slow, or that a third-party API is timing out for users in Europe. Production monitoring requires an approach that runs continuously, from the outside, in real browsers.
Dotcom-Monitor complements React’s dev tools with continuous, outside-in monitoring: scheduled checks run 24/7 from real browsers and send real-time alerts the moment a flow breaks or slows — no developer needed at the keyboard.
How Synthetic Monitoring Solves ReactJS Monitoring Challenges
Synthetic monitoring proactively simulates real user actions in real browsers on a fixed schedule — no waiting for users to hit a problem first. It’s particularly well suited to React applications, and it maps directly onto the challenges above:
Executes real user paths. Scripted journeys — log in, search, add to cart, check out — exercise SPA route changes and dynamic interactions that traditional page checks can’t reach. If a soft navigation breaks, you know within minutes.
Measures what users see. Because tests run in real browsers, they capture rendered content, Core Web Vitals, and element-level load times — not just server response codes. A white screen of death fails the test even when the server returns 200.
Catches hydration and interactivity failures. Synthetic scripts click, type, and assert on results. A page that renders but doesn’t respond fails immediately.
Watches third-party dependencies. Waterfall analysis of every network request shows exactly which script, API, or CDN slowed the page — yours or a vendor’s.
Tests from multiple global locations. Running the same journey from different regions exposes CDN, latency, and regional infrastructure problems your local testing never will.
Detects issues before users do. Scheduled checks run 24/7, so a broken deploy or failing dependency triggers an alert at 2 a.m. — not a support ticket at 9.
Dotcom-Monitor is a synthetic monitoring platform built for exactly this: EveryStep scripting, real-browser tests with video capture and waterfall charts, a global testing network, SLA thresholds, and a push/pull API for your own dashboards.
Synthetic Monitoring vs. Real User Monitoring (RUM)
The two are complementary. RUM passively collects performance data from actual visitors, giving you the true distribution of user experience. Synthetic monitoring gives you consistent, controlled baselines and — critically — coverage even when no users are on the site (nights, low-traffic flows, pre-release environments). For availability alerting and regression detection in React apps, synthetic is the foundation; RUM adds real-world context on top.
How Dotcom-Monitor Solves Each ReactJS Monitoring Challenge
Dotcom-Monitor’s web application monitoring platform offers several monitoring types you can combine to cover every failure mode above. A practical starting configuration for a React app:
- Multiple Step Process on your critical flows (signup, login, checkout) — your primary safety net, with video capture and step validation.
- Single Web Page + Lighthouse on top landing pages for Core Web Vitals tracking.
- API / Web Services checks on the endpoints your components depend on.
- Global locations + alerting enabled so failures surface immediately, everywhere.
Conclusion
ReactJS applications deliver a fantastic user experience, but they break the assumptions traditional monitoring was built on. Client-side rendering, SPA navigation, hydration, and third-party dependencies all create failure modes that server-side checks simply can’t see. React’s built-in Profiler and DevTools are great during development — but production demands continuous, browser-based, outside-in monitoring.
