Ensure Seamless Web Application Performance

Your web applications are the backbone of your business. Any downtime, performance lag, or technical issue can cost you revenue, reputation, and customer trust. Dotcom Monitor’s Web Application Monitoring software provides continuous visibility, real-time alerts, and actionable insights - helping you deliver a flawless user experience, 24/7.
A web application monitoring dashboard displays a sneaker purchase process alongside code and performance data.
Trusted by 10,000+ Organizations Worldwide​
aflac logo
Dell Logo
comcast logo
dish logo
citrix logo
Website monitoring leader since 1998

Proactive Monitoring to Solve Your Web Application Challenges

A video player shows a user session recording dashboard with monitoring waterfall charts. A notification at the bottom reads - Playback User Session Recording - 02:14

See Exactly What Went Wrong With Video Recordings

Diagnosing issues becomes much more manageable when you can visualize what the user experienced rather than relying solely on text logs. With Dotcom Monitor’s video capture feature, you can record sessions during every monitoring test. These videos are synced with waterfall charts, showing exactly what went wrong during a failure. Watch the user’s journey to pinpoint issues like slow loading, broken elements, or script failures, allowing for quick resolution.

Stop Losing Sales Due to Transaction Failures

When your customers can’t complete a purchase or sign up due to broken transactions or slow page loads, you risk losing valuable leads and revenue. Dotcom Monitor ensures your e-commerce checkout process, user logins, and sign-ups are constantly monitored. If anything goes wrong, you receive real-time alerts, so you can address issues before they affect users, ensuring a smooth and reliable transaction experience every time.

A payment form shows a card number, expiration date, and a green Pay $175.00 button. An alert says Transaction Error Detected - Alert Sent, and below is a red Payment Failed message.
A screenshot of the performance data of a website alongside a waterfall chart showing various performance data

Improve Website Performance and User Experience

Slow load times and performance lags are frustrating for users and can increase bounce rates and lower engagement. With Dotcom Monitor’s Synthetic Monitoring, you gain insights into the real-time performance of your site. Track page load times, identify bottlenecks, and take immediate action to optimize the user experience across your entire site, improving satisfaction and reducing abandonment.

Proactively Identify Issues Before Users Report Them

By the time you hear about a problem, it’s already negatively impacting your users, and customer trust may already be compromised. With synthetic monitoring, Dotcom Monitor continuously tests your web applications by simulating user actions such as logins, purchases, and form submissions. Instant alerts notify you of any issues, allowing you to resolve them before they impact the user experience.

A graphic shows a user journey with buttons labeled Login, Add to Cart, and Checkout connected by a dotted arrow. A bell icon signals an alert on the Checkout step.
Four browser windows display Success or Error detected messages, with Chrome, Safari, Firefox, and Edge icons.

Deliver Consistent Performance Across Browsers

Dotcom Monitor continuously emulates real user interactions across more than 40 desktop and mobile browsers, identifying performance slowdowns, errors, and load issues before they affect your customers. This ensures your users enjoy consistent, reliable performance everywhere they access your site.

Protect Internal Applications from Downtime

When your internal applications or intranet tools go down, it disrupts employee productivity and workflow. Detecting these issues can be challenging, especially if they’re hidden behind firewalls. Dotcom Monitor offers intranet monitoring for your internal applications, ensuring they are always up and running. Receive immediate alerts about performance issues or downtime in your employee-facing tools to prevent operational disruptions.

Diagram showing a firewall, switch, and workstations connected to internal apps. A private agent monitors the apps and sends a downtime alert to dotcom-monitor.com when an internal app is detected as down.
A website graphic shows charts and graphs illustrating historical data tracking, with a green label reading Historical Data Tracking – Verified Content.

Ensure Content Integrity with Historical Data Tracking

Tracking performance over time and ensuring content remains accurate can be difficult, leading to missing content going unnoticed. Dotcom Monitor’s historical data tracking lets you monitor key performance metrics over time, helping you identify long-term trends and issues before they negatively impact your business. Our content verification feature also ensures that the text, images, and links on your site are always correct and up to date.

SLA Monitoring for Internal and External Applications

Meeting performance expectations for both internal tools and customer-facing applications can be challenging. With Dotcom Monitor, you can set internal SLAs (Service Level Agreements) to ensure that your applications consistently meet the necessary performance metrics, whether it’s for e-commerce or employee tools. Receive instant alerts when your applications fail to meet these critical performance thresholds, ensuring that you are always delivering on your service commitments.

A dashboard displays SLA targets and performance data in a table with green, yellow, and red highlights. A red alert shows 97.8%. A notification at the bottom reads, SLA Breach Detected - Notification Sent.
A world map showing three locations—US (1.2s), Spain (1.5s), and Brazil (1.8s)—connected by lines, illustrating web application monitoring response times from different regions.

Deliver Consistency with Digital Experience Monitoring

With Dotcom Monitor’s Web Application Monitoring, you can ensure seamless access for remote employees to internal applications and consistent performance for global customers. Dotcom Monitor helps you to track user interactions from a global network to ensure your website loads properly around the world, from different datacenters and networks, enabling you to identify and resolve latency or network-related issues quickly.

Get Started with Dotcom Monitor’s Web Application Monitoring Today

Are you ready to proactively monitor your web applications and eliminate the risk of downtime or poor performance?

Start your free 30-day trial today – no credit card required – and experience the difference Dotcom Monitor can make to your web application’s performance and reliability.

Key Features That Ensure Web Application Performance

Illustration of a website and mobile device with a notification saying Page Load Delay Detected — Alert Sent.

Real-Time Alerts

Dotcom Monitor’s real-time alerts help you stay ahead of issues by notifying you of performance problems such as slow load times, broken transactions, or failed user interactions before they impact your users.

EveryStep Web Recorder

The EveryStep Web Recorder simulates real user interactions across HTML5, AJAX, WebSocket, and other web technologies. It ensures comprehensive testing of your application across multiple platforms, enabling you to evaluate performance under real-world conditions.

Screenshot of the EveryStep Web Recorder interface, showing a webpage being recorded with options like Hover, Click, and Submit.
Three dashboard cards for New York, London, and Tokyo display web application monitoring stats, such as assigned devices, checks, errors, and success rates, over a world map background.

Get a Global Perspective

Monitor your web applications from multiple global locations with pre-recorded steps executed up to once per minute. This gives you real-time insights into performance from different regions, helping you maintain a consistent user experience worldwide.

Video Capture Synced with Waterfall Charts

Record video sessions during monitoring tests, synced with waterfall charts to visualize performance issues in real-time. This allows for quicker diagnosis and resolution of slow loading times, broken elements, or network failures.

A graphic showing a video recording icon and syncing video capture with waterfall charts to diagnose performance issues, alongside a screenshot of waterfall charts and highlighted load delay at 37 seconds.
A diagram shows an internal network with four workstations connected to a switch, which links to a monitoring agent.

Securely Monitor Internal Applications

Monitor web applications inside your firewall that aren’t accessible externally. Using a locally installed agent, you can track full local user journey paths, including applications that integrate with external identity management and single sign-on systems like Azure ADFS and OKTA.

Why Choose Dotcom Monitor’s Web Application Monitoring?

Proven Performance

Trusted by businesses worldwide to ensure uptime and optimize website performance.

Comprehensive Monitoring

From external user journeys to internal employee-facing tools, monitor your digital infrastructure

Customizable Alerts

Set thresholds and criteria based on your business needs, focusing on your highest-priority areas.

Actionable Insights

Receive detailed reports and actionable insights, so you always know exactly where to look.

capterra
star rating
get-app
star rating

Trusted by Businesses Around the World

Our customers rely on Dotcom-Monitor to ensure an exceptional experience for their users, helping to retain a high level of trust and loyalty. That’s why we’re committed to ensuring that Dotcom-Monitor exceeds your expectations.

Start Monitoring Your Web Applications Today with Dotcom Monitor

Don’t wait for problems to affect your business. Dotcom Monitor helps you stay ahead of issues, ensuring your website and web applications are always performing at their best.

Get answers

Frequently Asked Questions

Modern web application monitoring is a synthetic monitoring solution that continuously checks response time, content, and overall performance of web applications. Today’s applications are dynamic, often built with Rich Internet Applications (RIAs) like Java, Ruby, HTML5, Flash, and modern JavaScript frameworks such as React, Vue, Angular, and Knockout, powering Single-Page Applications (SPAs) that rely on client-side interactions.

While developers have powerful tools to build these applications, monitoring how they behave in production for real users is more challenging. Dotcom-Monitor provides a comprehensive solution that supports all dynamic web technologies and enables scripting of business-critical user transactions, giving DevOps teams the flexibility and features needed to ensure optimal application performance and reliability.

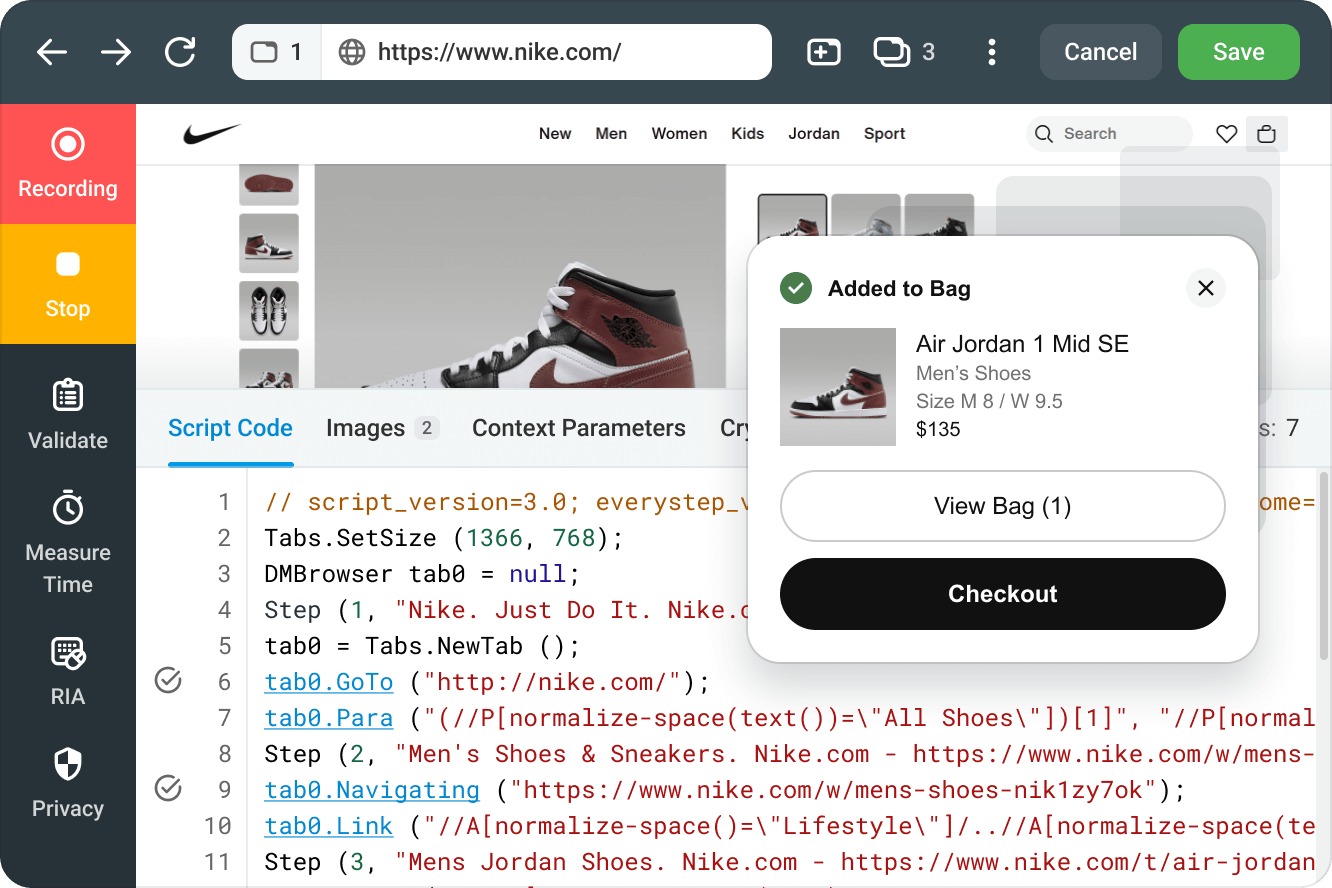
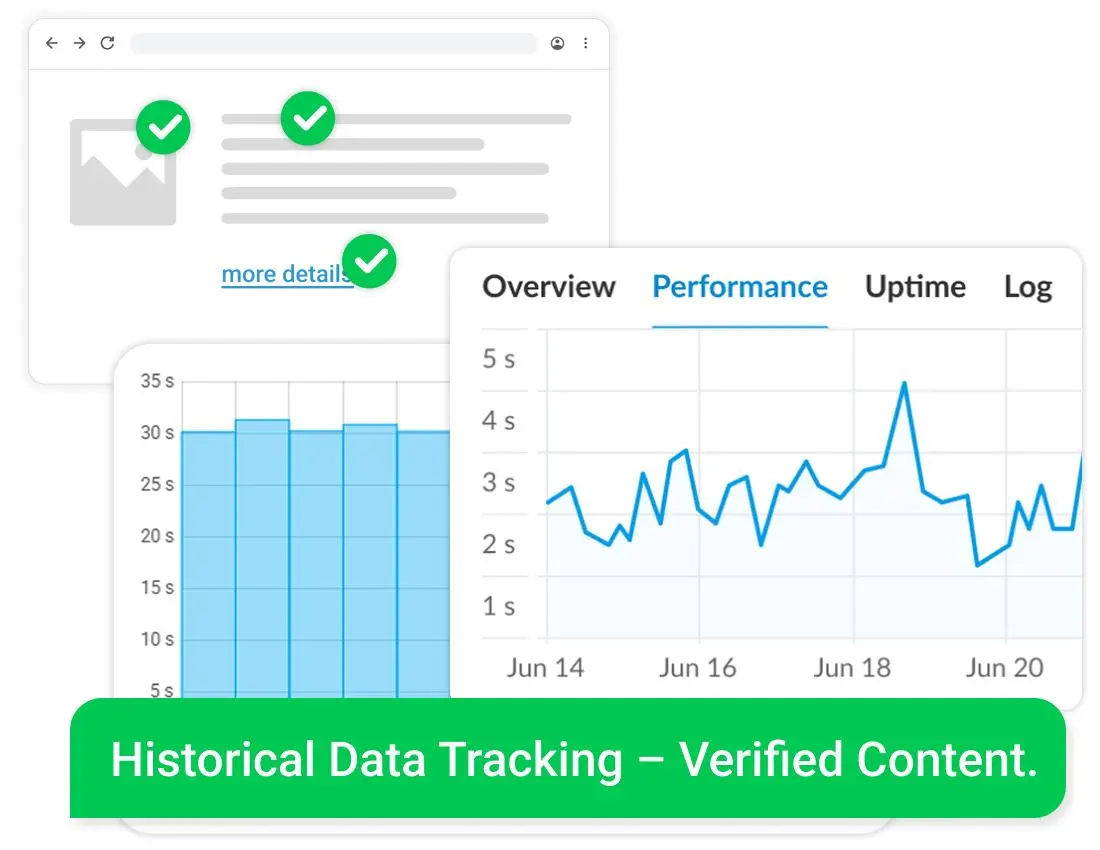
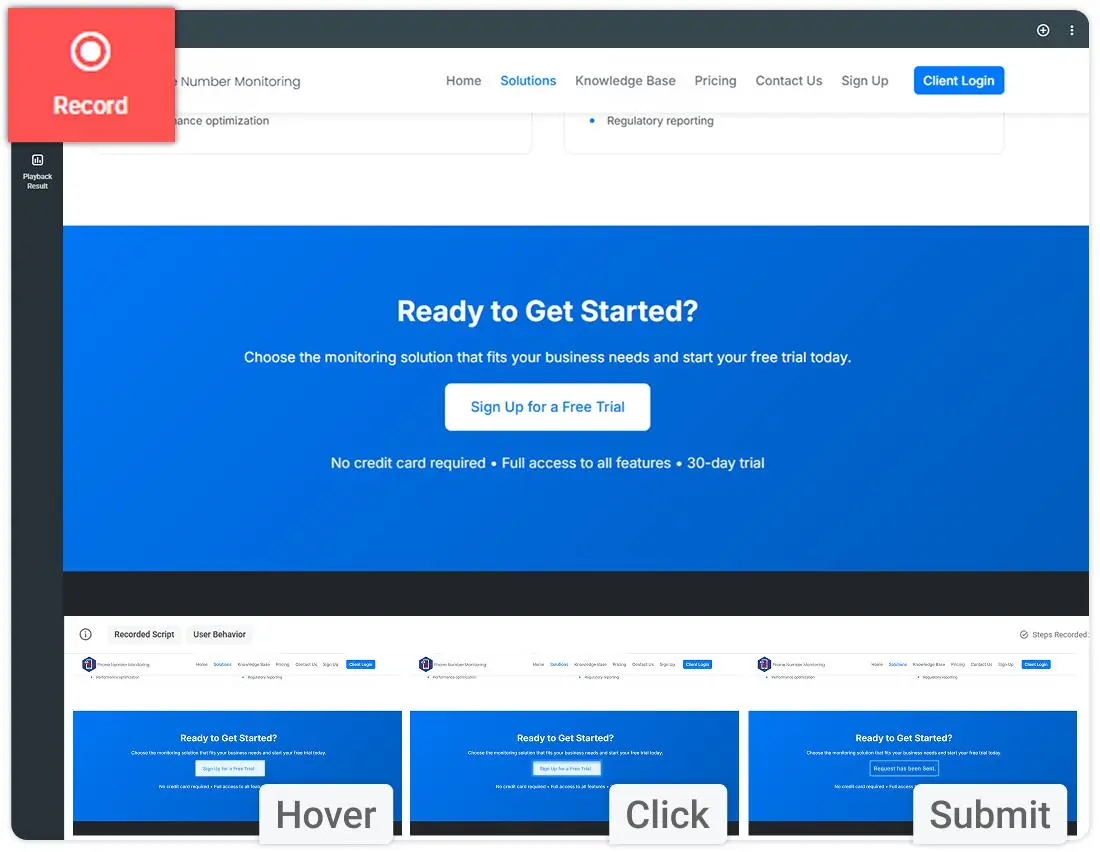
Dotcom-Monitor’s web application monitoring can track virtually anything rendered in a browser. Using the EveryStep Web Recorder, you can record and playback any user actions – clicks, hovers, form submissions, image/content verification, and more – regardless of the underlying technology. Scripts can be automated, saved, and run continuously for reliable monitoring.

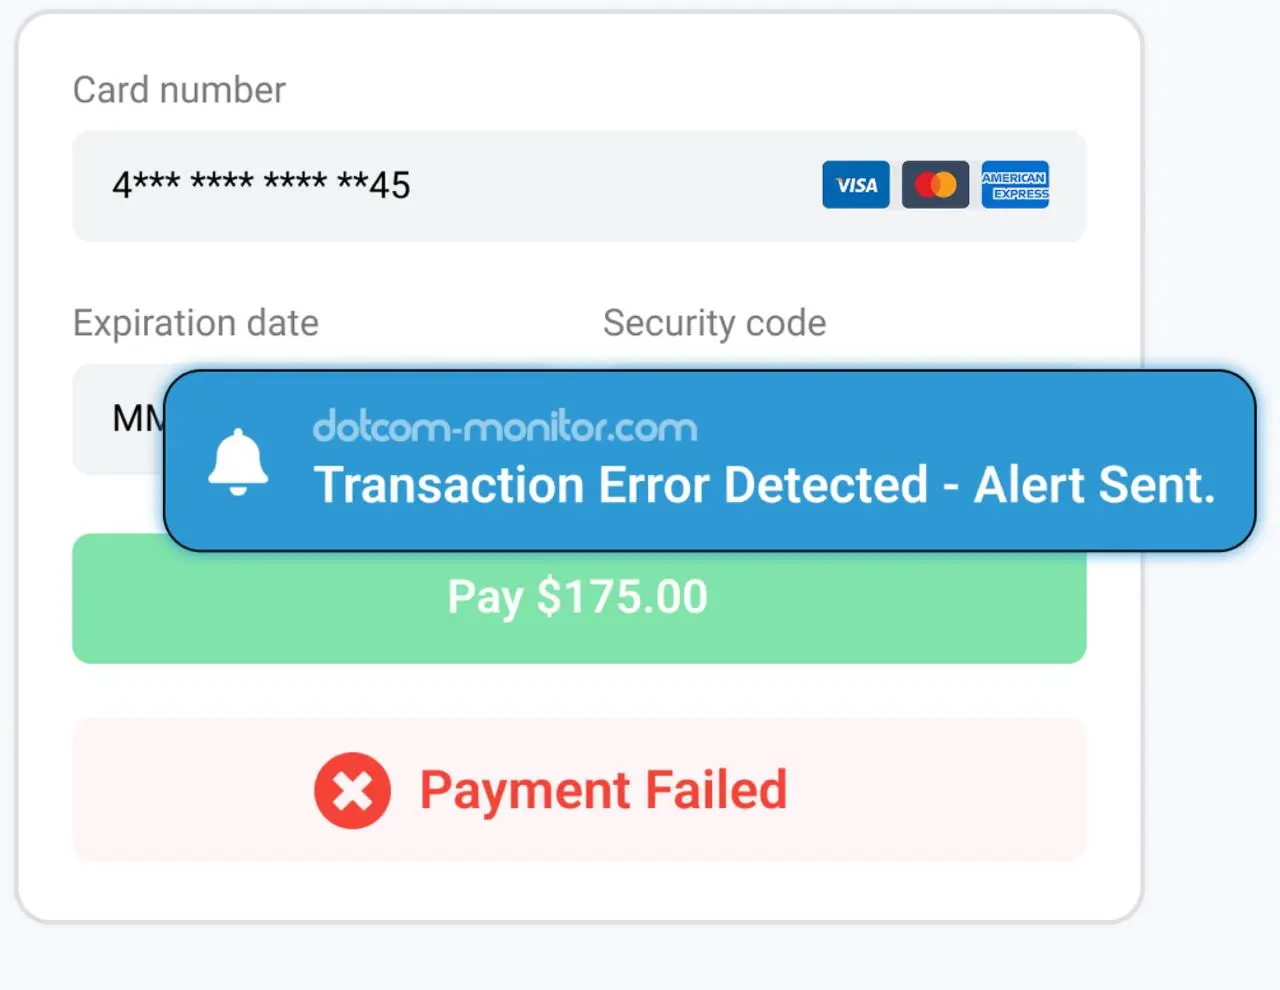
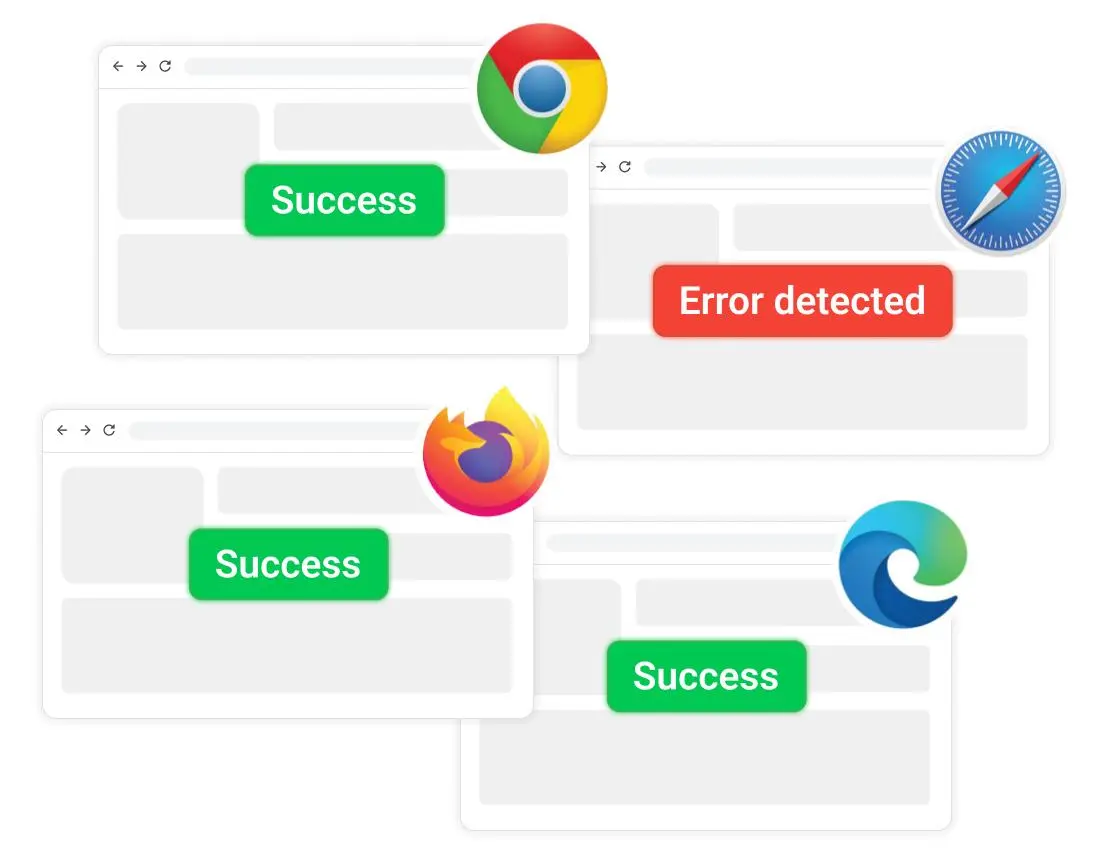
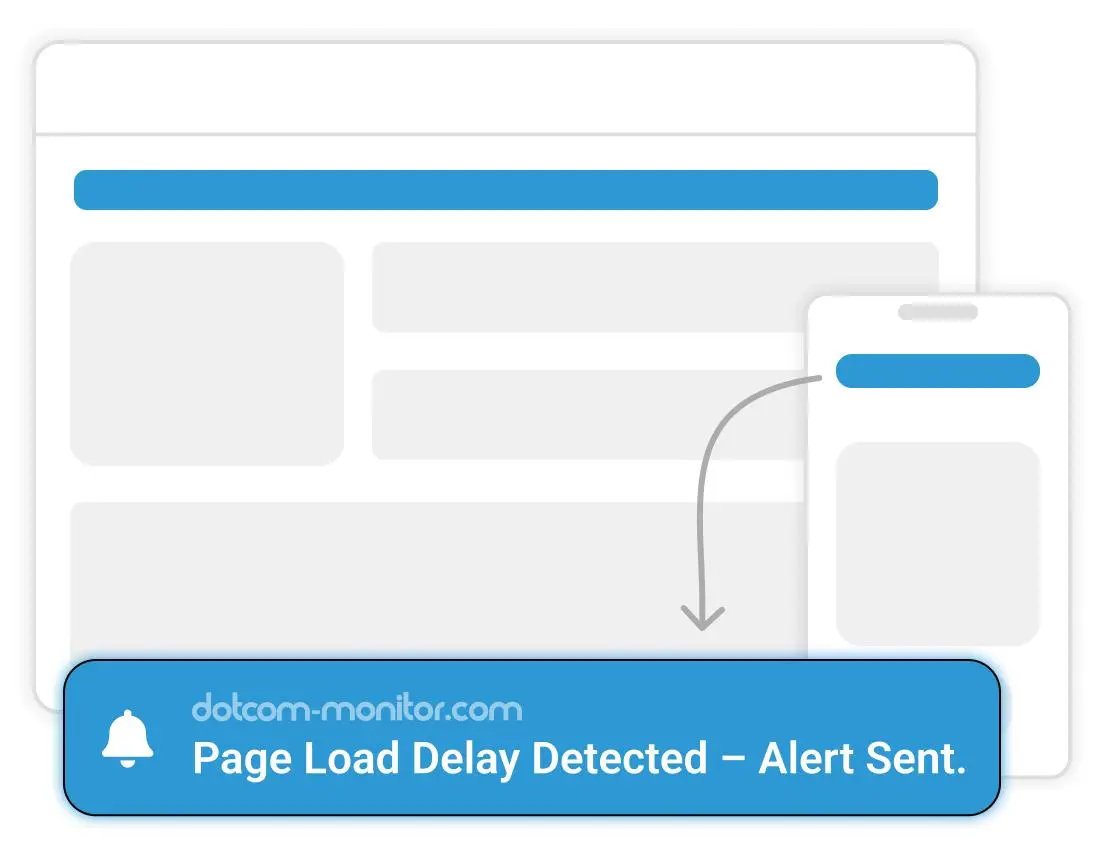
Unlike traditional protocol-based tools, EveryStep validates the layout, content, and functionality of everything visible in the browser across 40+ desktop and mobile browsers and devices. Monitoring checks can run from every minute to every three hours, with seamless integration to collaboration and alerting tools like Slack, and PagerDuty. Additionally, Azure AD enables secure single sign-on (SSO) and centralized user management within your organization.

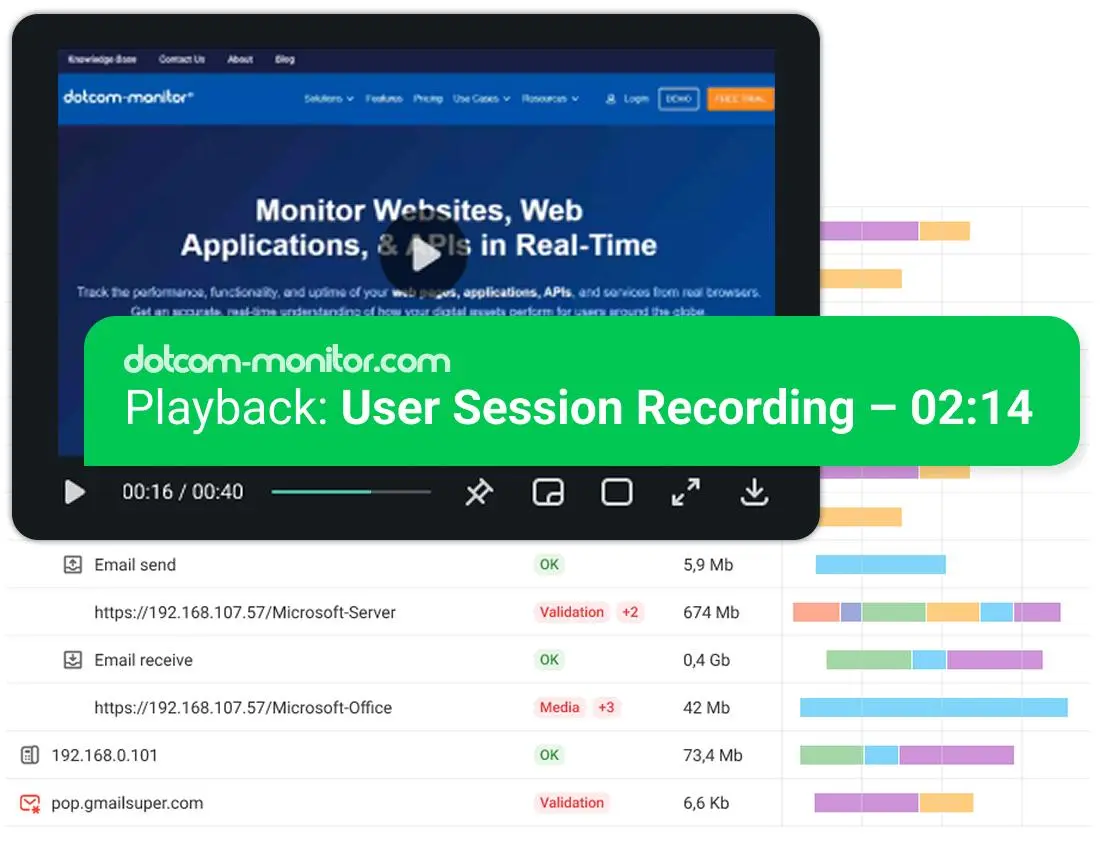
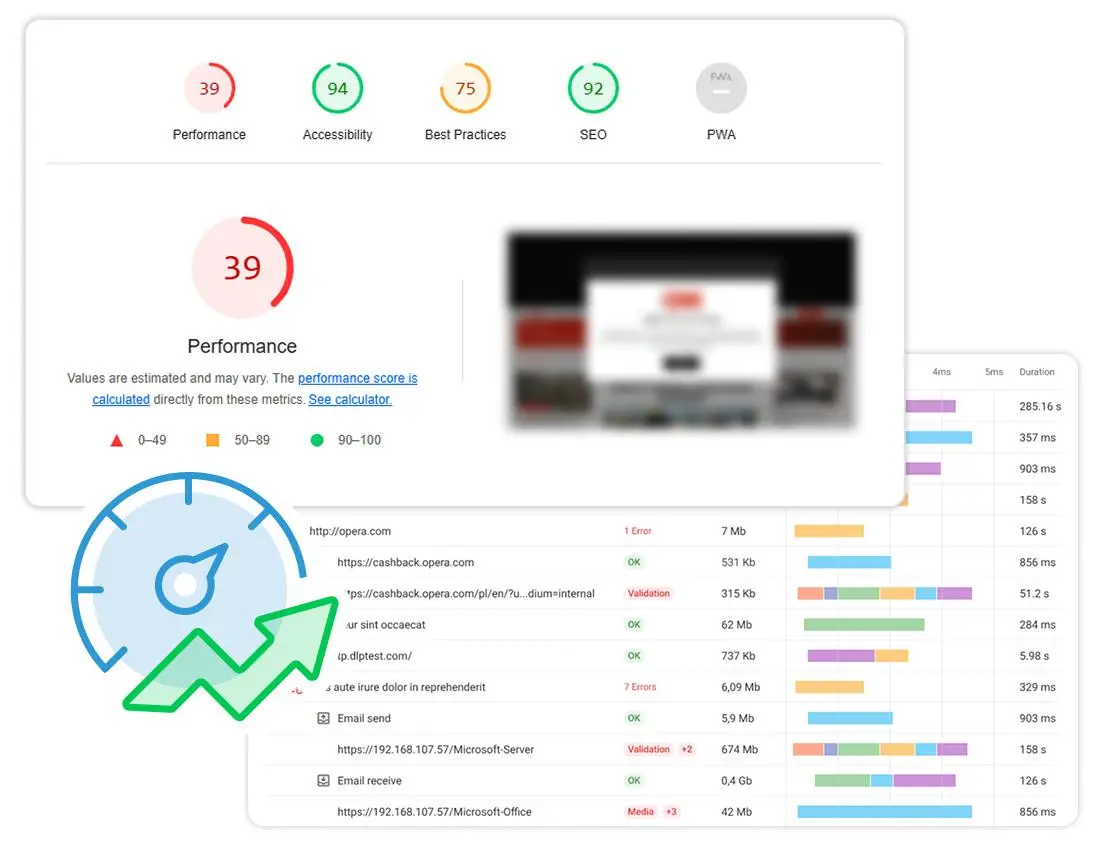
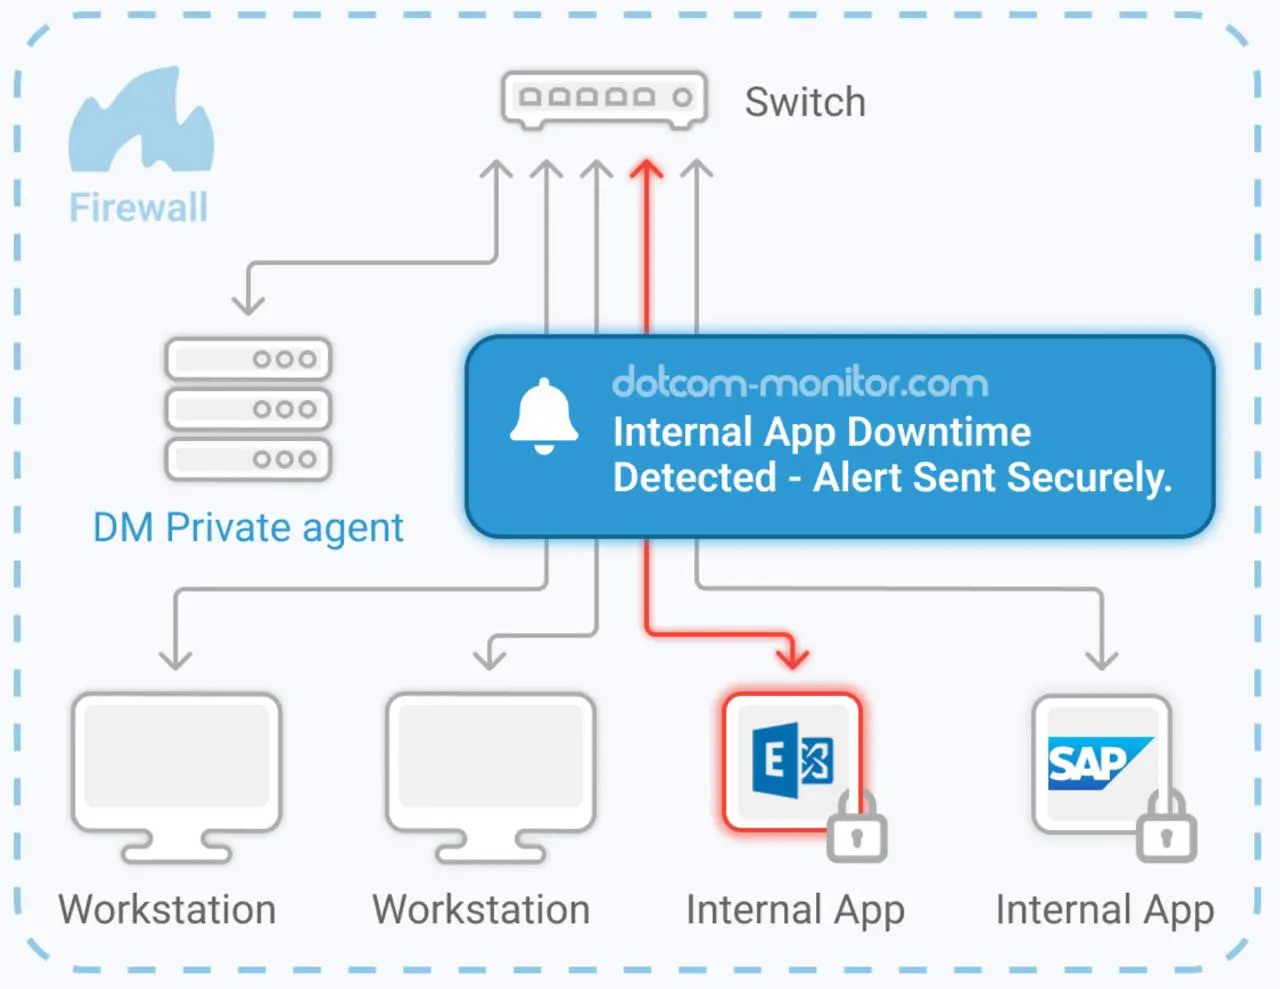
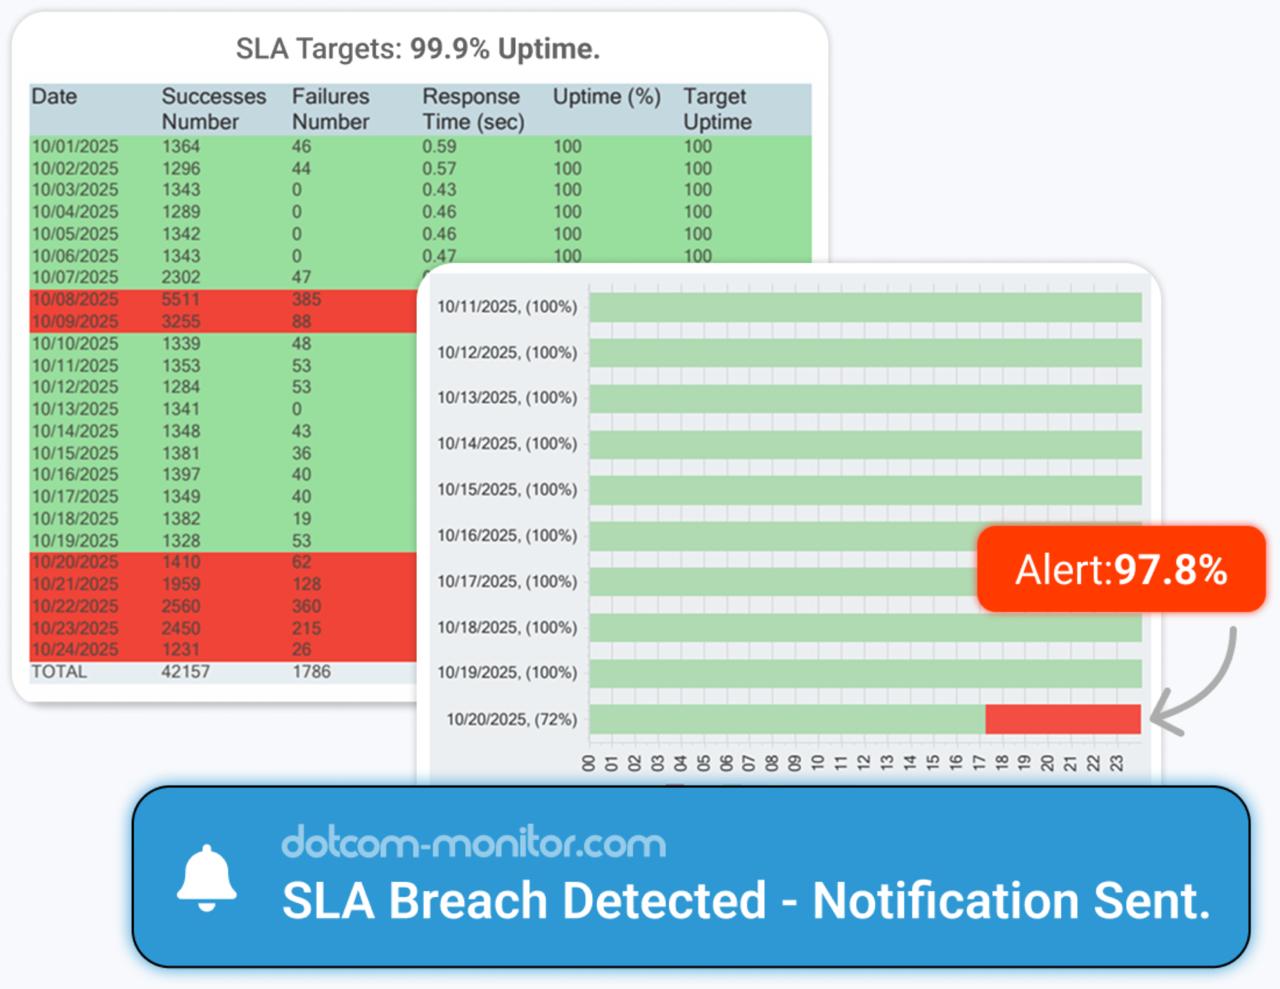
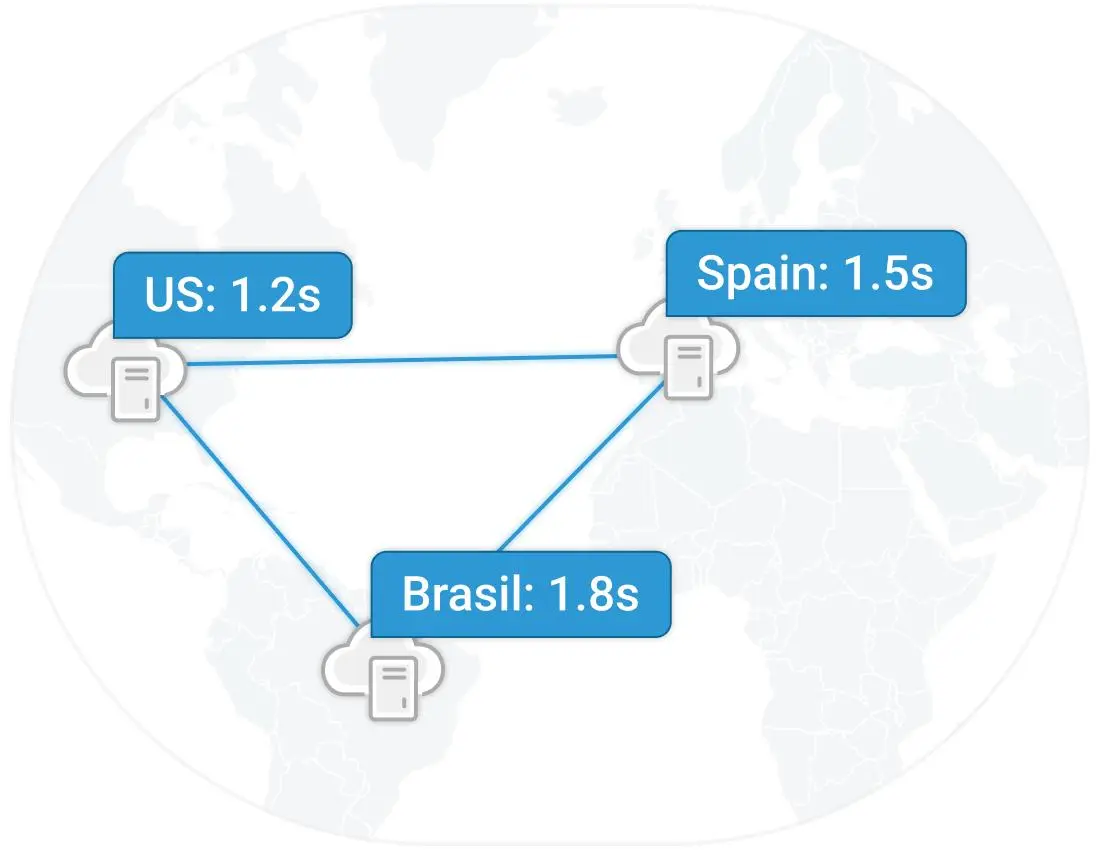
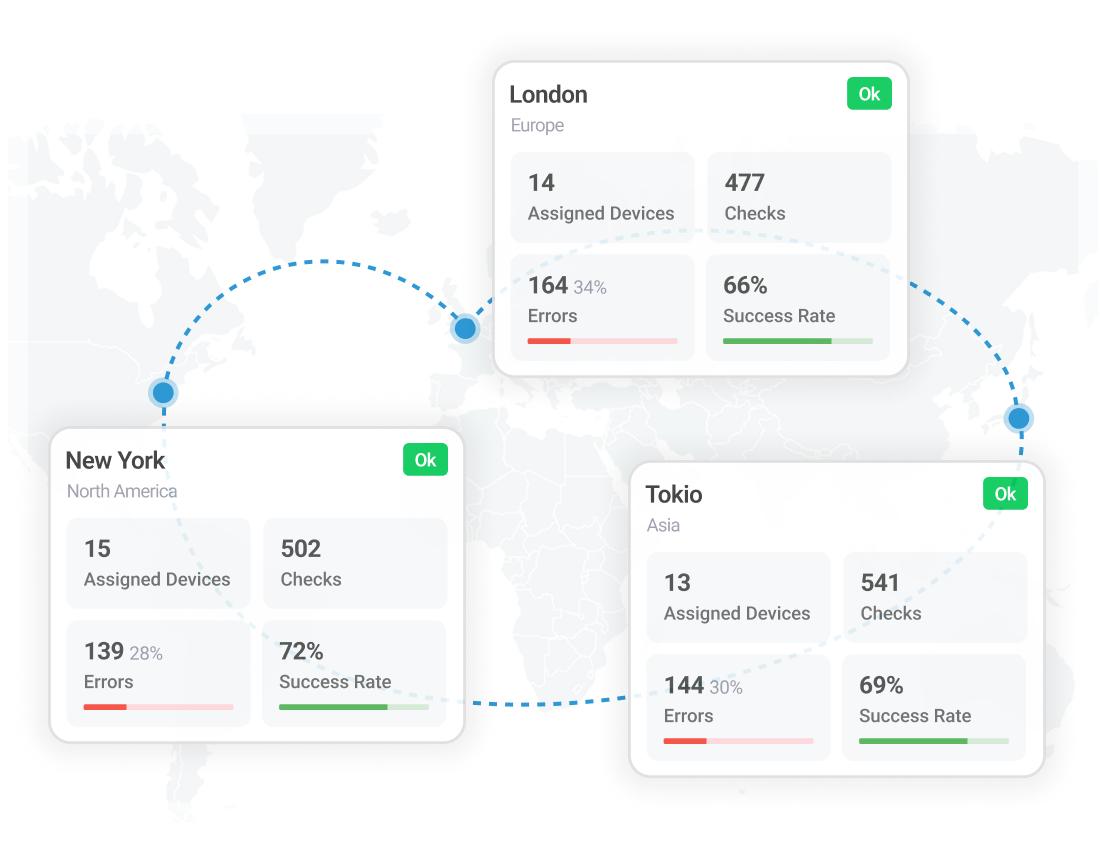
Dotcom-Monitor provides global monitoring with real-time alerts through an intuitive interface, making team coordination easy – ideal for advanced DevOps workflows. Beyond uptime, the platform delivers actionable data to maximize performance, optimize user experience, and maintain smooth operations.

Access monitoring results anywhere via the mobile app, or schedule a one-on-one demo and start a free 30-day trial to see why DevOps teams worldwide trust Dotcom-Monitor for comprehensive web application monitoring.

You can set up the system so it sends an alert immediately after an issue is detected, or after certain filters are triggered, whether it’s a failed transaction, slow page load, or content error.

Dotcom-Monitor allows you to customize the frequency of your monitoring checks according to your needs. You can set up checks to run as frequently as every minute or space them out to every three hours. This level of customization gives you the control to focus on critical periods or conduct broader, less frequent assessments. The platform also integrates seamlessly with popular third-party tools like Slack and PagerDuty, providing real-time alerts to ensure your team stays coordinated and proactive.

Yes, Dotcom Monitor supports intranet monitoring, allowing you to track the performance and availability of internal applications securely within your network.

Try it Free for 30 Days

Start Monitoring Your Web Applications’ Performance