Your cloud console is green. Your alerts are quiet. And the support queue is filling up with customers who can’t log in.
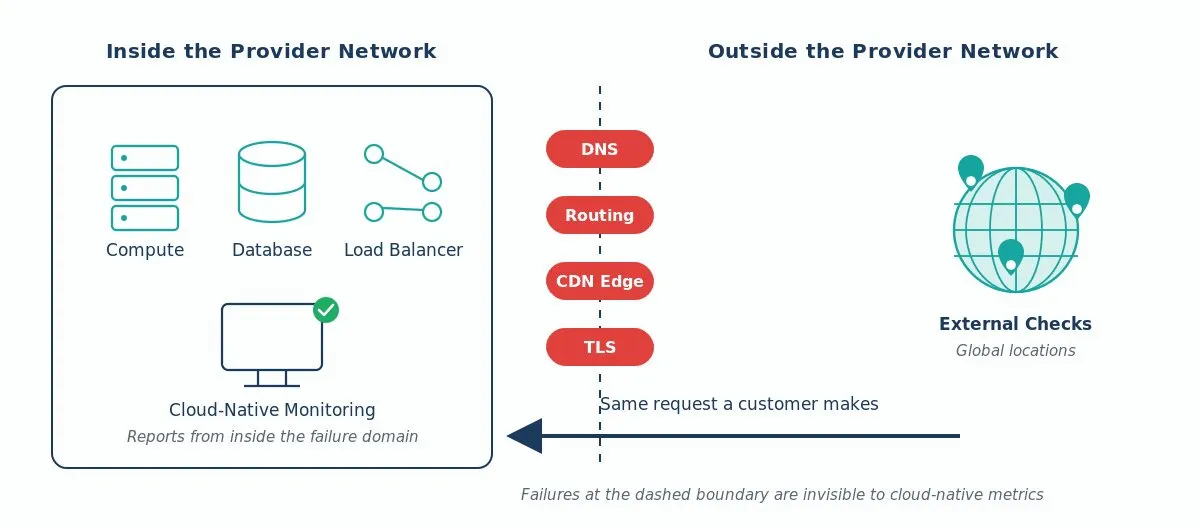
That combination is more common than most teams admit, and it usually isn’t a misconfiguration. Cloud-native monitoring runs inside the same infrastructure it reports on—so when that infrastructure has a bad day, its own telemetry is the last place to look for an independent answer.
If you’re comparing cloud infrastructure monitoring tools right now, that gap should drive your shortlist more than any feature matrix. Below: what your provider’s monitoring can and can’t see, how to test a vendor against the failures you actually have, and which pricing terms surprise teams about six months in.
What’s In This Guide
- Why Your Cloud Provider’s Monitoring Can’t See the Outage
- What Cloud-Native Monitoring Actually Measures
- Three Failures That Show Up Green on a Cloud Dashboard
- How to Evaluate a Cloud Infrastructure Monitoring Tool
- Which Metrics Belong in Your Shortlist Test
- Where Cloud Monitoring Pricing Catches Teams Out
- Questions to Ask on Every Vendor Call
- The Bottom Line on Cloud Infrastructure Monitoring
- Frequently Asked Questions
Why Your Cloud Provider’s Monitoring Can’t See the Outage
Every monitoring system has a vantage point. Your provider’s vantage point is inside its own network.
One definition first, because it decides the rest of the argument. Cloud-native monitoring here means the default resource metrics and alarms you get with the platform—Amazon CloudWatch, Azure Monitor, Google Cloud Monitoring—not every availability feature the provider sells alongside them.
Those defaults are useful. CloudWatch will tell you an instance is pinned at 100% CPU, that an Auto Scaling group added capacity, that database connections are exhausted. Real signals, and you should keep collecting them.
But the check runs on the provider’s control plane, over the provider’s network, against the provider’s API. If the control plane degrades, the metric pipeline degrades along with it. And delayed metrics look exactly like healthy metrics on a dashboard: no alarm fires, because no data arrived that would trip one.
The second limit matters more for anything customer-facing. Those default metrics measure your resources, not the path between a user in São Paulo and your load balancer in us-east-1. DNS resolution, BGP routing, CDN edge behavior, TLS negotiation, third-party scripts, WAF rules—all of it sits outside that boundary, and any of it can take your service down while CPU and memory stay flat.
A monitoring system that lives inside the failure domain is the last one to tell you that domain is broken.
But Doesn’t CloudWatch Synthetics Already Do This?
Partly, and this objection is worth taking seriously. Every major provider sells something here: CloudWatch Synthetics canaries, Route 53 health checks, Azure Monitor availability tests, Google Cloud uptime checks. They run real requests against your endpoints and they work.
The catch is where they run from. Those checks execute on the same provider’s infrastructure and post results to the same console, coverage outside that provider’s regions is thin, and a broad regional event can hit the checks and the workload together. Useful tools—but not independent ones.
Independence is the real requirement, and it’s fair to turn that back on any vendor. Plenty of third-party monitoring services also run on a major cloud. So ask where the check locations sit: a network spanning multiple providers and carrier-operated nodes, or three rented regions of the cloud you’re already using. Dotcom-Monitor runs its own global monitoring network rather than renting regions, which is what makes the check meaningful.
You can build a version of this. Prometheus Blackbox Exporter probes endpoints, and for one or two vantage points that’s a reasonable answer. The cost shows up when you need dozens of geographies, real-browser rendering, and someone on call for the probes themselves.
Either way, run the check from outside the system you’re checking. Synthetic monitoring sends requests over the public internet on a schedule you set. If one fails, you hear it from the check rather than from a customer.
What Cloud-Native Monitoring Actually Measures
Here’s the split, layer by layer. Map your current coverage against it before you talk to any vendor.
| Layer | Default Cloud Metrics | Independent External Checks |
|---|---|---|
| CPU, memory, disk on your instances | Yes, and in detail | No |
| Managed database and queue health | Yes | Indirectly, via app behavior |
| Autoscaling and deployment events | Yes | No |
| Public DNS resolution | Partial, from inside the VPC | Yes, from real resolvers worldwide |
| TLS certificate validity at the edge | Partial | Yes |
| Network path and routing to users | No | Yes |
| CDN and edge cache behavior | No | Yes |
| Full login or checkout journey | No | Yes |
| Third-party API and script failures | No | Yes |
Neither column replaces the other. Your provider’s tooling is the better root-cause instrument once you know something is wrong. External checks are what tell you something is wrong in the first place—and they keep reporting when the provider’s own pipeline stalls. Our post on what infrastructure monitoring covers goes deeper on the resource-level side.
Run both. Budget for both.

Three Failures That Show Up Green on a Cloud Dashboard
These are patterns, not case studies. Run production workloads on AWS, Azure, or Google Cloud for a couple of years and at least one will look familiar.
A DNS Record That Broke for Half Your Users
Someone updates a record during a migration. The change is correct at the authoritative nameserver, so every internal check passes. But the old endpoint was decommissioned before the previous TTL expired, so recursive resolvers around the world keep handing out the old address until their cached copy times out. A slice of your traffic keeps hitting something that no longer answers.
Your instances are healthy. Your load balancer sees less traffic and reports nothing unusual. Catching this means resolving the name from outside, from multiple geographies, the way a real client would. That’s what DNS monitoring does, and it’s why resolver location matters in an evaluation.
A Certificate That Expired on a Load Balancer
Renewal is automated now, which is exactly why it fails quietly. A job breaks, nobody notices, and the cert on one listener or one CDN edge property runs out.
The instances behind it are fine. CPU is fine. Application logs show a drop in requests, not an error. Browsers, meanwhile, are throwing an interstitial warning at every visitor. SSL certificate monitoring that walks the chain from outside catches this weeks ahead.
A Region Marked Operating Normally
Provider status pages usually wait on internal confirmation before anything changes color. That’s a reasonable way to avoid false alarms across millions of customers, and it also means the page tends to lag the incident. Teams routinely see errors before the dashboard turns yellow.
If your incident response waits on the status page, you’ve handed detection time to someone else’s review process. Independent checks give you your own timeline—during the incident, and afterward when you reconcile against an SLA. That’s the data that makes uptime and SLA reports worth anything in a credit dispute.
How to Evaluate a Cloud Infrastructure Monitoring Tool
Most vendor comparisons rank features. That tells you very little—the feature lists have converged, and half of them describe the same capability under different branding. Test against your own failures instead.
Step 1: Write down the last five incidents you actually had. Pull them from your ticket system, not from memory, and note how you found out about each one. If more than one came from a customer, you have a detection problem, not a dashboard problem.
Step 2: Check where the vendor runs its checks from. Ask for the location list, not a count, and ask who owns those locations. Thirty locations clustered in North America and Western Europe say nothing about users in Southeast Asia. Locations rented from the cloud you already run on say nothing during a regional event.
Step 3: Test a multi-step journey, not a homepage ping. A 200 on your root URL proves almost nothing. Script a login, a search, an add-to-cart, an API call authenticated with a scoped test credential. Status-code checks pass every test you give them and still miss the outage that costs you money. EveryStep scripting handles the recorded-journey case.
Step 4: Break something on purpose during the trial. Point a check at a staging hostname you control, then pull the DNS record or return a hard 500. Time the alert and read what it says. This is the most useful hour you’ll spend in any trial.
Step 5: Read the alert as if it woke you up. Does it name the failing step, the location, the error class, the response time? Or does it say “site down”? That difference decides whether your on-call engineer starts fixing at 2:04am or starts investigating. Check how alerting routes into what you already use—PagerDuty, Slack, Teams, a webhook.
Step 6: Confirm it reaches your internal systems too. Plenty of what you run isn’t public: admin panels, internal APIs, staging, anything behind a VPN. A tool that only sees the open internet leaves you buying a second one. Private agents run checks from inside your network and report to the same console.
Step 7: Model the bill at next year’s scale. Double your current check count, apply the interval you actually want rather than the one that fits the demo, and ask for that number in writing.
Which Metrics Belong in Your Shortlist Test
Availability percentage ends up in the board deck, and it’s the least useful number during an evaluation—uptime figures round away exactly the failures you care about. Ask for these instead:
- Time to detect. Minutes between the failure starting and the alert arriving. This is the number that justifies the purchase.
- Response time by location. A p95 per region, not a global average that hides your slow markets.
- Error breakdown by layer. DNS, TCP, TLS, HTTP, content assertion. A tool that reports “failed” without naming the layer has moved the debugging back to you.
- Failure confirmation behavior. How many locations must agree before an alert fires, and how fast. Too loose and you get noise; too strict and you get delay.
- Retention on raw check data. Summaries are fine for reporting. Post-incident review needs the individual checks.
Distributed backends complicate this—dependencies fail partially and the symptoms move. Our guide on monitoring distributed systems covers that case.
Where Cloud Monitoring Pricing Catches Teams Out
Monitoring bills tend to grow faster than the infrastructure they watch. Where that happens:
Per-host pricing in an autoscaling environment. If you’re billed per monitored host and your fleet scales with traffic, so does the bill. Ask how ephemeral instances are counted and over what window.
Custom metrics and high-cardinality tags. Cloud-native monitoring often charges per custom metric per month. Add a high-cardinality tag—a customer ID, a container ID—and the count multiplies without anyone deciding to spend more.
Ingest, retention, seats, and SMS. Log volume rarely goes down, so check what happens at each tier boundary and whether retention is priced apart from ingest. Some platforms also bill per user, which turns “give support read access” into a budget conversation, and meter SMS and voice alerts separately.
Check frequency. With vendors that bill per execution, going from a five-minute interval to one minute multiplies that monitor’s cost by five. Others bundle executions or cap frequency by plan tier, so the shape varies—but it’s rarely free, and it decides whether you catch a short outage or miss it. Price the frequency you’ll actually run, per service. Dotcom-Monitor’s pricing works per check and per interval, so that math is easy to do up front.
Set the total against the cost of downtime for your own service. For most teams the monitoring line item is small next to a single bad hour—but have that comparison written down before the renewal conversation.
Questions to Ask on Every Vendor Call
Bring these to the demo. The answers separate tools quickly:
- Who owns your check locations—your own nodes, carrier facilities, or regions rented from AWS, Azure, or Google Cloud?
- Does the check use a real browser or an HTTP client, and what does that change about what it catches?
- How do you monitor an endpoint that requires OAuth or SSO?
- How many locations have to fail before you alert, and is that tunable?
- How long do you keep raw check results, and can I export them?
- What does the bill look like if I double my checks and halve my interval?
For the wider selection process—vendor stability, support, contract terms—we’ve written that up separately in our guidelines for choosing a monitoring platform.
The Bottom Line on Cloud Infrastructure Monitoring
Keep your provider’s monitoring. It’s the best instrument you have for resource-level diagnosis, it’s already deployed, and the basic metrics come with the compute. Watch the bill on custom metrics, logs, and retention, but keep it.
Just don’t make it your outage detector. It reports from inside the system it’s watching, and the default metrics can’t see the network path, public DNS resolution, the edge certificate, or the login flow your customers depend on. Those are the failures that reach your support queue first.
The evaluation that works is short: list your real incidents, test candidates against those failures, break something during the trial, price the configuration you’ll actually run. A tool that would have caught your last five outages five minutes earlier has paid for itself.
See What External Checks Catch
Dotcom-Monitor runs real-browser and protocol checks against your cloud infrastructure from a global network of locations, plus private agents for anything behind your firewall. Start a free trial and point a check at the service you’re least sure about.
Explore infrastructure monitoring or web application monitoring.