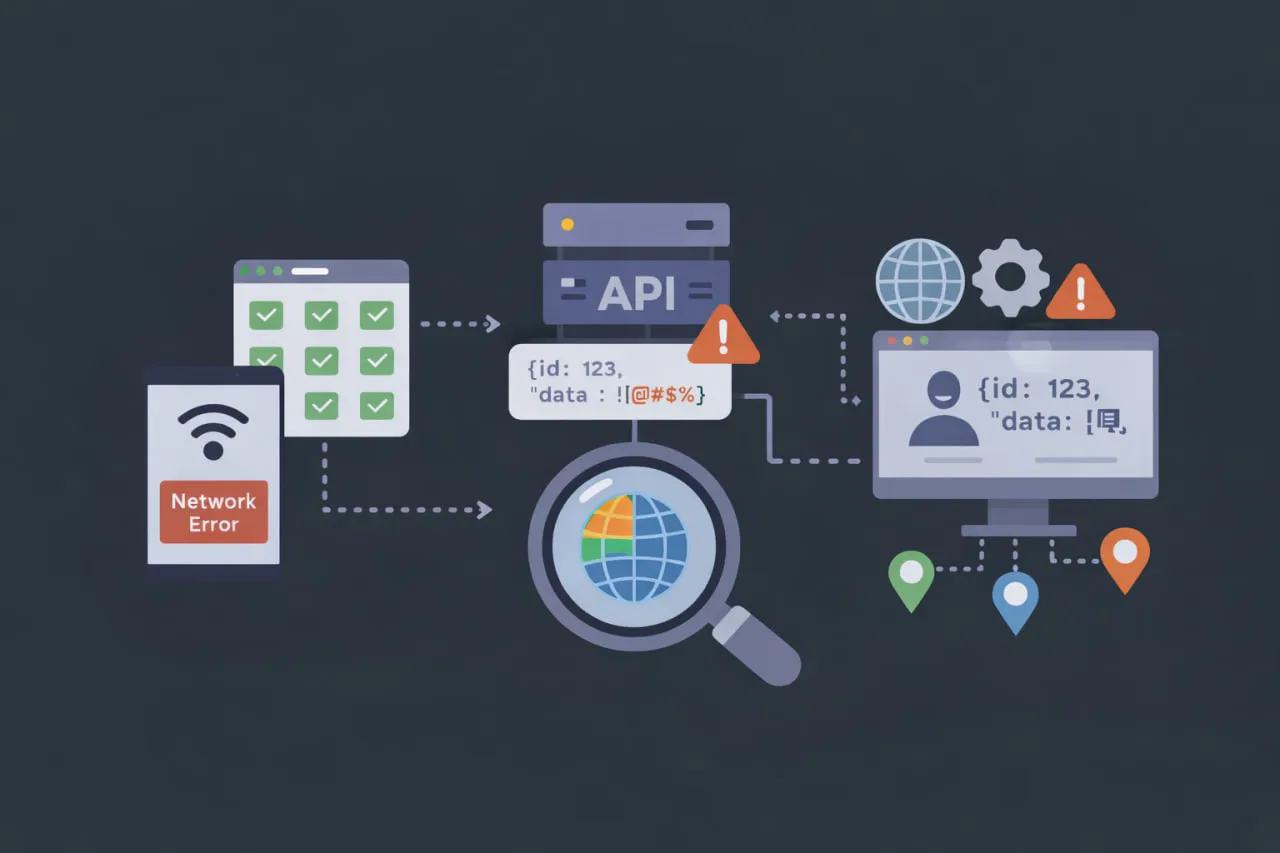
 Consider this scenario: Your mobile app shows “Network Error” to 30% of users. Your dashboard shows that all of your servers are green. Your support team is quite busy. After four hours of feverish searching, you discover an issue. One of your 47 microservices is responding with a 200 OK status but returning malformed JSON that crashes client applications.
This isn’t just a hypothetical situation; it’s what happens every day for businesses that don’t have effective synthetic API monitoring, or the right tools to track APIs across complex, distributed microservices environments.
Your frontend might look perfect, but your APIs—the invisible backbone of every modern application—may be failing without you knowing it, costing you money, reputation, and reliability. Recent studies show that API-related challenges cause 63% of all digital service outages, while only 22% of businesses have full API monitoring in place. The absence of monitoring is one of the biggest problems in today’s microservices-based designs.
Synthetic API monitoring addresses this critical gap by continuously monitoring and validating your API network in real time. By simulating real requests and checking responses from multiple locations, it helps teams keep APIs running reliably, ensuring every endpoint behaves correctly 24/7, even when failures don’t surface as obvious downtime.
How can you extend your monitoring strategy beyond APIs?
Learn how comprehensive web synthetic monitoring completes your digital experience visibility: Why Your Web Performance Strategy Needs Web Synthetic Monitoring
What is Synthetic API Monitoring? (Beyond Simple Uptime Checks)
API monitoring is one of four core check types in synthetic monitoring — for the full taxonomy, start with our guide on what is synthetic monitoring. For synthetic API monitoring to be effective, make API requests from various regions of the world to monitor for availability, performance, and accuracy, helping teams ensure healthy APIs before issues impact real users. Traditional monitoring waits for real traffic to detect problems, while synthetic monitoring looks at your API infrastructure ahead to find problems before they affect real users.
Traditional API Monitoring vs. Synthetic API Monitoring
| Traditional Monitoring | Synthetic API Monitoring |
|---|---|
| Reactive (after failure occurs) | Proactive (prevents failures) |
| Tests if endpoint responds | Tests if endpoint works correctly |
| Single geographic location | Global geographic coverage |
| Simple status code checks | Complete response validation |
| Manual or infrequent testing | Automated, continuous testing |
| Limited to production | Covers dev, staging, production |
The 3 Pillars of Comprehensive Synthetic API Monitoring
Availability & Uptime Validation
- HTTP status code verification (200, 201, and 204 vs. 4xx/5xx errors)
- Connection success rates from multiple geographic regions
- DNS resolution validation for API endpoints
- SSL/TLS certificate monitoring and expiration alerts
For a real-world application of these three pillars on a complex, permission-heavy API platform, see how Salesforce API monitoring with synthetic tests handles governor limits and connected app authentication.
Performance & Latency Measurement
- Response time tracking (p50, p95, and p99 percentiles)
- Time to First Byte (TTFB) analysis
- Payload size monitoring and optimization alerts
- Concurrent connection performance under load
Functional & Data Validation
- Response schema validation (JSON Schema, OpenAPI/Swagger)
- Data integrity checks (field presence, data types, value ranges)
- Business logic validation (calculations, transformations, aggregations)
- Authentication & authorization testing (tokens, API keys, OAuth flows)
The Critical Gaps in API Monitoring That Synthetic Monitoring Fills
Gap 1: The “200 OK” Deception
Your API returns HTTP 200, but:
- The JSON is malformed.
- Required fields are missing
- Data values are incorrect
- Rate limiting headers are misconfigured.
Traditional monitoring: “Everything’s fine!”
Synthetic API monitoring: “Your /users endpoint is returning invalid birthdate formats from our Tokyo location.”
These gaps are especially pronounced with GraphQL, where a single endpoint can return partial data without any error code — our dedicated guide on synthetic monitoring for GraphQL endpoints covers query-level validation strategies.
Gap 2: Geographic Performance Disparities
Your API performs well in your primary region, but:
- European users experience 4x latency.
- Asian responses fail SSL handshakes
- South American requests time out intermittently
Traditional monitoring: “Average response time: 120 ms”
Synthetic API monitoring: “API latency exceeds 2 seconds in 3 of 8 regions during peak hours.”
Gap 3: Dependency Chain Failures
Your primary API works, but:
- Third-party integrations fail silently
- Database connection pools exhaust
- Cache layers return stale data
- Message queues backup
Synthetic API monitoring: “Payment processing failing due to external gateway timeouts affecting checkout completion.”
Gap 4: Progressive Degradation
Performance slowly deteriorates:
- Response times creep up 20% weekly
- Error rates increase gradually
- Cache hit ratios decline
- Memory usage grows unnoticed
Synthetic API monitoring: “API performance trending 15% worse week-over-week; predicted failure in 9 days.”
The 5 Essential Components of Effective Synthetic API Monitoring
Component 1: Multi-Step API Transaction Monitoring
Modern applications rarely use single API calls—they execute complex sequences:
E-commerce Order Flow:
- POST /auth/token → Validate token response
- GET /products/search → Validate search results structure.
- POST /cart/items → Verify item additions.s..
- POST /checkout → Validate payment initiation.
- GET /orders/{id} → Confirm order creation…
SaaS Application Flow:
- OAuth authentication → Token acquisition
- Data retrieval → Pagination validation
- Data processing → Business logic verification
- Webhook triggering → External system notification
- Audit logging → Compliance validation
Component 2: Real-Time Performance Analytics
Real-time synthetic monitoring provides immediate insights:
Key Performance Indicators:
- Response time percentiles (not just averages)
- Error rate tracking by endpoint and region
- Throughput monitoring (requests per second)
- Payload efficiency (response size optimization)
- Concurrency performance under varying loads
Advanced Analytics:
- Anomaly detection using machine learning
- Seasonal pattern recognition (daily/weekly cycles)
- Correlation analysis with infrastructure metrics
- Predictive forecasting of performance trends
Component 3: Comprehensive Validation Frameworks
{
  "validation_rules": {
    "required_fields": ["id", "name", "price"],
    "data_types": {"price": "number", "in_stock": "boolean"},
    "value_ranges": {"price": {"min": 0, "max": 10000}},
    "response_time": {"max_ms": 500},
    "status_codes": [200, 201]
  }
}
Business Logic Validation:
- Discount calculations are accurate.
- Tax computations correct by jurisdiction
- Inventory updates reflect sales
- User permissions enforced correctly
Component 4: Geographic Intelligence & Global Testing
- Cloud region testing (AWS, Azure, GCP regions)
- Last-mile network testing (ISP-specific performance)
- Regulatory compliance testing (GDPR, CCPA data handling)
- Peak traffic simulation from key markets
Component 5: Advanced Alerting & Incident Response
- Multi-location failure confirmation (reduce false positives)
- Progressive alerting (warning → critical escalation)
- Enriched diagnostics (full request/response capture)
Automated remediation (failover, cache clearing, restart)
Ready to implement enterprise-grade synthetic API monitoring?
Explore Dotcom-Monitor’s platform featuring global API testing, comprehensive validation frameworks, and real-time analytics:
Discover Our Synthetic Monitoring Features
Implementation Roadmap: 30 Days to API Monitoring Excellence
Phase 1: Week 1-2 – Foundation & Critical APIs
- Inventory critical APIs (prioritize by business impact)
- Implement basic synthetic monitoring for top 5 endpoints
- Configure geographic testing from 3 key regions
- Establish performance baselines and thresholds
- Set up basic alerting for availability issues
Phase 2: Weeks 3-4 – Expansion & Validation
- Add multi-step transaction monitoring for key user flows
- Implement comprehensive validation (schema, data, logic)
- Expand geographic coverage to all major markets
- Integrate with CI/CD pipelines for pre-production testing
- Create performance dashboards for stakeholder visibility
For teams looking to connect this roadmap to their release cycle, our guide on using synthetic monitoring in CI/CD pipelines shows how to make API checks a standard post-deploy validation gate.
Phase 3: Month 2 – Optimization & Advanced Features
- Implement AI-powered anomaly detection
- Add dependency chain monitoring (third-party services)
- Configure advanced alerting (progressive, enriched)
- Establish SLA tracking and reporting
- Create automated runbooks for common failure scenarios
Choosing the Right Synthetic API Monitoring Solution
When evaluating the best synthetic monitoring tools for APIs, consider these essential capabilities:
Must-Have Features:
- Global Testing Infrastructure: Multiple geographic locations
- Protocol Support: HTTP/HTTPS, WebSocket, GraphQL, gRPC
- Validation Frameworks: JSON Schema, XML validation, custom assertions
- Performance Metrics: Response times, error rates, throughput
- Alerting & Notification: Multi-channel, configurable thresholds
- Historical Analytics: Trend analysis, comparison reporting
- API Access: REST API for integration and automation
- Security Features: Credential management, data encryption
Dotcom-Monitor’s synthetic monitoring solution covers all of these — visit the platform page to run your first API health check in under five minutes.
Advanced Capabilities (Competitive Differentiators):
- AI-Powered Anomaly Detection: Automatic issue identification
- Multi-Step Transaction Support: Complex workflow testing
- Load Testing Integration: Performance under scale
- Dependency Mapping: Third-party service monitoring
- Compliance Validation: Regulatory requirement checking
- Team Collaboration: Shared workspaces, annotations
- Custom Metrics & KPIs: Business-specific measurements
Common Synthetic API Monitoring Challenges & Solutions
Challenge 1: “Our APIs Change Frequently”
Solution: Implement monitoring that:
- Integrates with OpenAPI/Swagger specifications
- Supports automated test generation using API definitions.
- Provides version-aware monitoring
- Includes CI/CD pipeline integration for automated updates
Challenge 2: “We Have Too Many APIs to Monitor”
Solution: Adopt a prioritized approach:
- Tier 1: Business-critical APIs (revenue-impacting)
- Tier 2: Customer-facing APIs (user experience)
- Tier 3: Internal APIs (operational efficiency)
- Tier 4: Legacy/Deprecated APIs (sunsetting planning)
Challenge 3: “False Alerts Overwhelm Our Team”
Solution: Implement intelligent alerting:
- Multi-location confirmation requirements
- Performance baseline adaptation
- Business-hour vs. off-hour thresholds
- Escalation policies based on impact
Challenge 4: “Monitoring Impacts API Performance”
Solution: Use monitoring best practices:
- Distributed testing locations (not concentrated)
- Reasonable check frequencies (1-5 minute intervals)
- Lightweight monitoring vs. load testing separation
- Respect rate limits and API quotas
Experience Enterprise-Grade API Monitoring
Start your 30-day free trial of Dotcom-Monitor’s synthetic API monitoring platform. Test availability, performance, and correctness of your APIs with global coverage and advanced validation:
Frequently Asked Questions
While tools like Postman and SoapUI are excellent for development and manual testing, synthetic API monitoring serves fundamentally different purposes:
Testing vs. Monitoring:
- Postman/SoapUI: Manual, ad hoc testing during development
- Synthetic API Monitoring: Automated, continuous monitoring in production
Scope & Coverage:
- Postman/SoapUI: Single environment, developer workstation
- Synthetic API Monitoring: Global locations, production-like conditions
Frequency & Consistency:
- Postman/SoapUI: Irregular, manual execution
- Synthetic API Monitoring: Scheduled, consistent execution (every 1-5 minutes)
Alerting & Response:
- Postman/SoapUI: Manual result interpretation
- Synthetic API Monitoring: Automated alerts with enriched diagnostics
Integration & Automation:
- Postman/SoapUI: Limited production integration
- Synthetic API Monitoring: CI/CD integration, automated remediation
Think of Postman as a quality inspector checking products before shipment, while synthetic API monitoring is like having sensors throughout your shipping network that alert you the moment any package encounters issues.
Absolutely. Modern synthetic API monitoring platforms provide comprehensive security and authentication testing capabilities:
Authentication Method Support:
- API Key Authentication: Header-based, query parameter keys
- OAuth 2.0 Flows: Authorization code, client credentials, resource owner password
- JWT Token Validation: Token expiration, signature verification, claim validation
- Basic Authentication: Username/password with secure credential storage
- Custom Authentication: SAML, LDAP, custom token schemes
Security Testing Capabilities:
- Input Validation Testing: SQL injection, XSS, and command injection attempts
- Rate Limiting Verification: Ensure limits are enforced correctly
- Permission Testing: Role-based access control validation
- Data Exposure Prevention: Sensitive data masking in monitoring
- Compliance Validation: GDPR, HIPAA, and PCI-DSS requirement checking
Security Best Practices:
- Credential Vaulting: Secure storage with rotation policies
- Test Data Isolation: Separate monitoring data from production
- Encrypted Communications: TLS 1.2+ for all monitoring traffic
- Access Controls: Role-based permissions for monitoring configuration
- Audit Logging: Comprehensive activity tracking for compliance
Synthetic API monitoring platforms handle both GraphQL and REST APIs effectively, with specialized approaches for each:
GraphQL API Monitoring Specifics:
Query Validation:
- Schema Introspection: Automated discovery of available queries/mutations
- Query Complexity Analysis: Monitor for expensive or inefficient queries
- Nested Query Testing: Validate deep nesting performance
- Fragment Validation: Ensure fragment reuse and correctness
Performance Monitoring:
- Resolver-Level Timing: Individual resolver performance tracking
- DataLoader Efficiency: Batch loading performance optimization
- Caching Effectiveness: Query result cache hit ratios
- Subscription Monitoring: Real-time WebSocket connection performance
Error Handling:
- Partial Result Monitoring: Handling of partially successful queries
- Error Path Identification: Specific field-level error tracking
- Validation Error Detection: Query syntax and schema compliance
REST API Monitoring Specifics:
Endpoint Coverage:
- CRUD Operation Validation: Create, Read, Update, Delete testing
- Pagination Testing: Page-based and cursor-based pagination
- Filter & Sort Validation: Query parameter functionality
- Versioning Support: API version header/path parameter handling
Best Practices for Both:
- Comprehensive Test Coverage: All critical queries/endpoints
- Real User Simulation: Production-like query patterns
- Performance Baselining: Establish normal performance ranges
- Geographic Testing: Global performance validation
- Alert Configuration: Business-impact-based alerting thresholds
