
Your monitoring dashboard shows green across the board, and half the company still can’t open the ERP system. That’s the blind spot of external monitoring: the checks run from the public internet, while your CRM, HR portal, intranet, and help desk live on private addresses the internet can’t reach. When one of them goes down, the dashboard says nothing. The help desk queue says plenty.
The fix isn’t a second tool or a homegrown script farm. It’s running the same synthetic monitoring you already trust for public sites from inside your network, through a private agent that sits behind the firewall and reports out. The agent is the easy part; the harder decision is which employee experience it should represent—headquarters, a branch office, VPN users—because internal monitoring fails the moment you treat the inside of the firewall as one place. This guide covers how that architecture works, then walks through six numbered steps for monitoring internal applications end to end: inventory, agent deployment, synthetic checks, network checks, dependency checks, and alerting.
Why External Monitoring Cannot Reach Internal Applications
Public monitoring nodes can test anything with a public address. Internal applications don’t have one. They resolve on internal DNS, sit on private address space, and are often reachable only over a VPN. Point an external check at your intranet and the best you’ll get is a connection timeout; the check fails not because the app is down but because the vantage point is wrong.
So most teams fall back on the two worst monitoring strategies there are: waiting for complaints, or having a sysadmin ping things from a workstation when something feels off. Neither gives you baselines, alerting, response-time history, or evidence. And internal systems carry real obligations—IT teams sign internal SLAs and operational agreements for exactly these applications, and an SLA you can’t measure is an SLA you can’t prove.
The stakes are the same as for any customer-facing site, just aimed inward. An ERP outage stalls order processing. A dead help desk portal takes out the team that fixes everything else. A payroll portal failing on deadline day is a company-wide event. These systems deserve the same continuous checks a revenue page gets.
How a Private Monitoring Agent Works
A private agent is monitoring software you install on a host inside your own network. It runs the same kinds of checks a public monitoring node runs—HTTP(S) requests, scripted browser flows, API calls, network probes—but from where your employees actually sit, against addresses only your network can see.
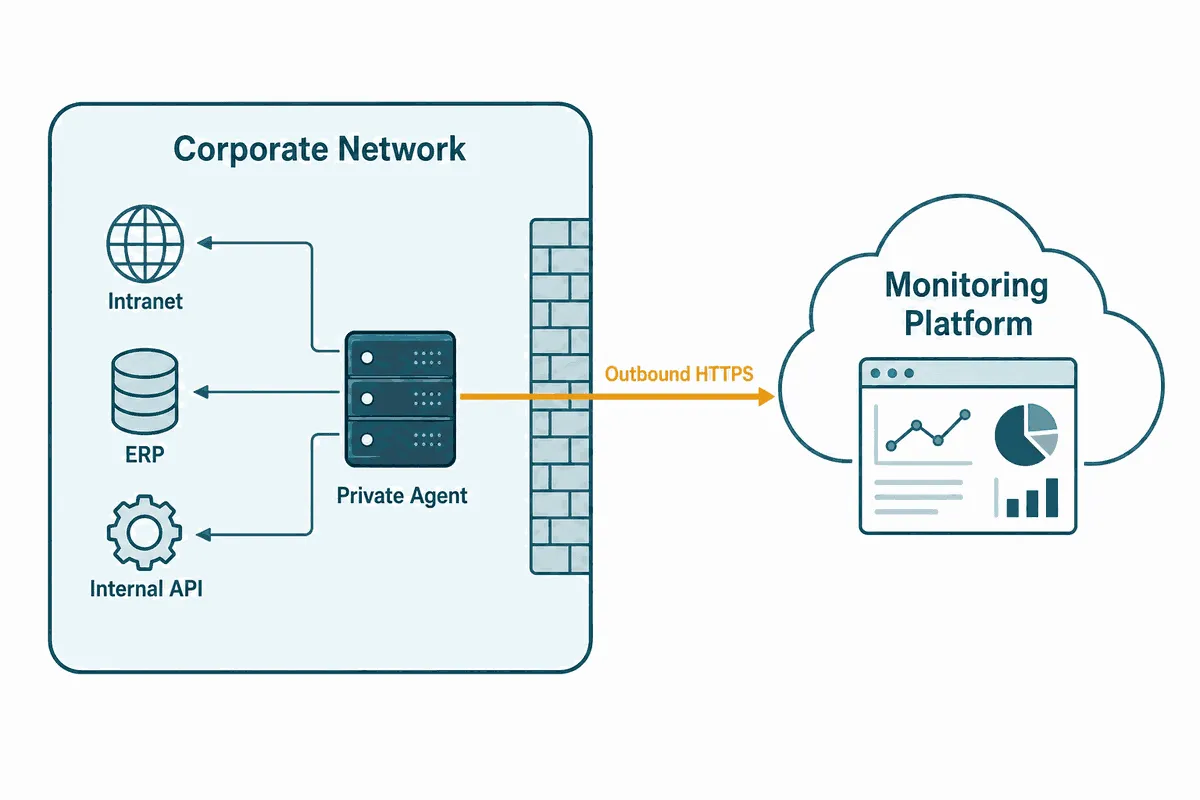
The architecture matters because of what it doesn’t require. Private agents follow an outbound-only connection model: the agent initiates encrypted connections out to the monitoring platform to pick up its task list and deliver results—the same direction of traffic your firewall already allows for any workstation browsing the web. On the firewall side, that usually amounts to allowlisting outbound traffic to the platform’s endpoints. You don’t open inbound ports, publish an internal host to the internet, or punch holes in the perimeter. In locked-down environments, three boring things break agents far more often than architecture does: proxy authentication, TLS inspection and certificate trust, and whether the agent resolves internal DNS the same way employees do. Validate those three before blaming anything else. Your applications, credentials, and test targets stay inside; what leaves is monitoring results.
Dotcom-Monitor Private Agents apply this model to the full platform: the same synthetic checks, scripted user flows, and alerting you’d run from its global network, executed from inside your firewall, with results in the same dashboard as your public-facing monitoring. One pane covers both sides of the perimeter.
How to Monitor Internal Applications in Six Steps
With the architecture clear, here’s the process. Each step builds on the previous one, and you can stop at the depth your environment justifies.
Step 1: Inventory and Prioritize Your Internal Applications
List what’s actually in use: ERP, CRM, accounting and payroll portals, HR systems, the help desk, collaboration and messaging tools, file shares, and the internal APIs that connect them. Don’t stop at the CMDB: cross-check ticket history, SSO app-launch logs, and the recurring is-it-down chat threads, because those reveal what people actually depend on rather than what someone documented. One shortcut works every time: ask senior engineers which outage would make them cancel a vacation. Then tier the list by blast radius. What stops the entire company when it fails? What stops one department? What can wait until morning?
Not everything needs continuous checks. The IT help desk that every other outage funnels through deserves round-the-clock coverage; a reporting portal used at quarter-end doesn’t. Assign each tier a check frequency and an uptime target, and write those targets down—they become the internal SLAs your monitoring will later prove or disprove.
Step 2: Deploy a Private Agent Where Your Users Sit
Install the agent on a dedicated, locked-down host inside your network—a stable VM or a long-lived container, not a shared utility box that gets rebooted without warning— confirm its outbound path to the monitoring platform, and point your first checks at the tier-one list. That covers headquarters. It doesn’t cover everyone.
Place agents by failure domain, not org chart: one near users measures employee experience, one near the application tier measures app health, one behind the VPN measures remote access, and when the three disagree, the disagreement is the diagnosis. If you have branch offices or regional sites, deploy an agent at each one. An application that responds instantly at HQ can crawl for a branch at the far end of a saturated WAN or VPN link, and no single vantage point will surface that. One agent per site turns “it’s always slow in the Denver office” from anecdote into a per-location chart you can act on. Treat the agent hosts themselves as production infrastructure: keep them patched, powered, and excluded from aggressive desktop-cleanup policies.
Step 3: Run Synthetic Checks on Critical User Flows
A ping that says the login page loads tells you almost nothing about whether an employee can do their job. Synthetic checks should walk the flows people actually run: log in, open a record, run a search, submit a transaction, confirm the result. Scripted with a tool like EveryStep, that flow replays on a schedule from your private agent, and every step gets its own timing. Design those scripts to run safely forever: a dedicated test identity, MFA handled deliberately instead of left to break the check, seeded test records, and no transactions that create cleanup work for someone else.
Per-step timing is where the value hides. When the flow degrades, you don’t just learn the app is slow—you learn the search step went from two seconds to twelve while login stayed flat, which points at the database before anyone opens a ticket. Baseline these timings when things are healthy, and alert on deviation, not just failure. The same approach covers heavyweight internal platforms—SharePoint and SAP ERP deployments are classic candidates. How often to run each flow is its own decision; the tradeoffs are covered in this guide to monitoring frequency and locations.
Step 4: Add Network and Infrastructure Checks
Internal applications rarely fail alone—often it’s the network underneath them. Slow internal DNS makes every app feel broken at once. A congested link between segments adds latency that looks like an application problem. Packet loss on a VPN tunnel turns a branch office’s day into a slideshow.
From the same private agent, run infrastructure checks beneath the application layer: ICMP and TCP probes against key hosts, DNS checks against your internal resolvers, and latency measurements between network segments and offices. Watch bandwidth headroom around known peaks. One non-obvious check earns its keep: query response time on your domain controllers, because when Active Directory or LDAP slows down, every integrated application feels broken while each app’s own metrics stay green. When an application check and a network check fail together, the pairing itself is the diagnosis—you know within one cycle whether to page the app team or the network team.
Step 5: Verify Third-Party Dependencies From Inside the Firewall
Internal apps quietly depend on external services: the identity provider behind single sign-on, payment processors, license servers, vendor APIs. Vendor status pages lie by omission: they confirm the vendor’s side is up. It says nothing about whether your network can reach them—through your proxy, your firewall rules, your DNS. A stale egress rule can take an integration down while every status page on the internet stays green. For the dependencies that matter, run paired checks from the public internet and from inside your normal egress path: public passing while private fails points at egress or DNS, and both failing makes it the vendor’s problem.
So run API checks against those dependencies from inside the firewall, alongside health checks on your own core functions. For an internal billing system, that means scheduled tests of login, data retrieval, and transaction processing—the functions whose failure someone will report within the hour, now caught within minutes instead.
Step 6: Automate Alerting and Response
Detection only pays off if the right person hears about it. Route each application’s alerts to the team that owns it, not a shared inbox. Alert on degradation thresholds as well as hard failures, so the twelve-second search gets attention before it becomes an outage. Be realistic about severity, too: an internal reporting portal failing at 3 a.m. is not a wake-someone incident, because the goal is protecting productivity during business hours, not five-nines. Tune off-hours policies to protect your team’s sleep. Add escalation for incidents nobody acknowledges, and push alerts into the channels your teams already watch—chat, ticketing, on-call tools.
Then automate the routine endings. If a known-flaky service can be safely restarted when resource use crosses a threshold, script it and let the alert trigger the fix; save the humans for failures that need judgment. And guard against false positives—a check that failed once from one agent is a fact worth confirming before it wakes anyone. Practical alert-tuning patterns are covered in our guide to website monitoring alerts.
External Monitoring vs. Private Agent Monitoring
The two approaches aren’t rivals; they cover opposite sides of the firewall, and most organizations need both.
| Factor | External Monitoring | Private Agent Monitoring |
|---|---|---|
| Vantage point | Public internet, global locations | Inside your network, where employees sit |
| Can reach private addresses | No | Yes |
| Firewall changes | None (targets are public) | Outbound allowlist only; no inbound ports |
| What it validates | Customer-facing availability and performance | Employee experience of internal systems |
| Where sensitive targets live | Exposed to public checks by design | Stay inside; only results leave the network |
| Best for | Websites, public APIs, SaaS front ends | ERP, CRM, intranets, internal APIs, branch connectivity |
The deciding question is vantage point: measure customer-facing systems from where customers are, and internal systems from where employees are. A platform that does both keeps the two views in one dashboard instead of two tools.
The Bottom Line
Internal applications fail like public ones do, but they fail in the dark: external checks can’t reach them, so the first alert is usually a person. A private agent closes that gap with an outbound-only architecture that needs no inbound firewall changes, and the six steps above turn it into a working practice—inventory and tier your apps, deploy agents where users sit, script the flows that matter, watch the network underneath, verify third-party dependencies from inside, and route alerts to owners with automation handling the routine fixes.
Start with one agent and your five most critical internal systems. Within a week you’ll have baselines nobody in your organization has ever seen, and the next ERP hiccup will be a ticket your team opens—not one your users do.
Monitor What the Internet Cannot See
Run real-browser synthetic monitoring against your internal applications with Dotcom-Monitor Private Agents—same platform, same dashboard, inside your firewall. Start a free trial.