
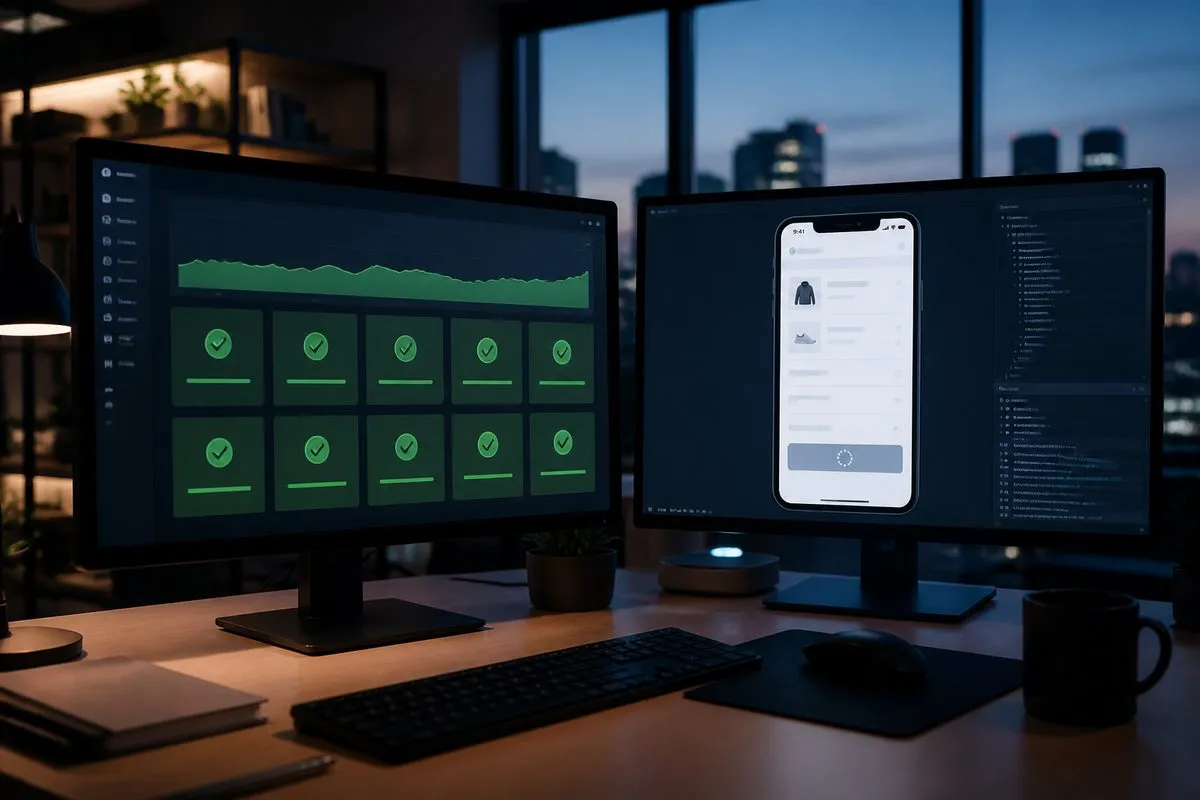
Your uptime monitor reports 100%. Your servers are responding in 180 ms. And orders are down 30% since Tuesday morning.
Digital experience monitoring (DEM) exists for that situation. Server-side metrics confirm your infrastructure answered the phone. They say nothing about whether a shopper in Frankfurt could actually get through checkout on a mid-range Android with a slow payment script sitting in front of the pay button.
Most guides on this topic define DEM for IT teams watching employee laptops and VPN tunnels. This one covers the other version: monitoring the customer-facing journeys that produce revenue. What DEM measures, where each data source goes blind, how to set it up on a real storefront, and which Dotcom-Monitor check catches each failure.
What’s in this guide
- What Is Digital Experience Monitoring?
- Why Your Dashboards Go Green While Checkout Is Broken
- Synthetic Monitoring vs. RUM vs. Network Path Analysis
- What to Measure on a Revenue Path
- Four Failures Your Uptime Check Will Miss
- How to Set Up Digital Experience Monitoring
- How to Choose a Digital Experience Monitoring Tool
- How Dotcom-Monitor Handles Digital Experience Monitoring
- Digital Experience Monitoring FAQs
- The Bottom Line
What Is Digital Experience Monitoring?
Digital experience monitoring is the practice of measuring how people experience your website or application end to end, across the network, browser, and device they use to reach you. Instead of asking “did the server respond,” it asks “could someone complete what they came here to do, and how long did it take.” That measurement can come from real sessions, from scripted journeys run on a schedule, or from both.
The scope is wider than uptime. A DEM setup watches page rendering, multi-step transactions like search and checkout, the APIs behind those steps, third-party scripts, and how all of it changes by region, browser, and connection speed. You’ll see the same practice sold as end user experience monitoring, application experience monitoring, or digital experience management. The labels differ; what gets measured mostly doesn’t.
The Two Kinds of DEM (and Why They Get Confused)
Search this term and page one skews hard toward network and security vendors: Palo Alto Networks, Fortinet, Cloudflare, ThousandEyes, Tanium. Most of what those pages describe is employee-facing, watching endpoint health, SASE tunnels, and the path between a remote worker’s laptop and Microsoft 365. Some of them cover customer traffic too, but the definitions at the top of the results lean toward the workforce.
That’s a real category solving a real problem. It just isn’t the problem an ecommerce or digital operations team has.
The customer-facing version points outward. Your users are strangers on networks you don’t control, using devices you didn’t provision, and they leave without filing a ticket. Nobody escalates a broken promo code field. They go to a competitor.
Employee DEM answers “why is Sarah’s Zoom call choppy.” Customer DEM answers “why did cart completions drop 18% in Brazil last night.” Same acronym, different tooling, different owner.
The rest of this guide is about the second one.
Why Your Dashboards Go Green While Checkout Is Broken
Three common setups all fail in the same direction, and they fail quietly.
An uptime ping checks the wrong thing. An HTTP check on your homepage confirms one URL returned a 200. Checkout can return a 200 with “We couldn’t process your payment” rendered inside the page. The status code has no opinion about the content.
Server-side metrics stop at your edge. Application response time, CPU, and error rates describe your infrastructure. They don’t include DNS resolution, TLS handshakes, CDN edge behavior, third-party tag execution, or the 2.8 seconds a chat widget spends blocking the main thread on mobile.
Real user monitoring has a survivorship problem. Real user monitoring collects data from a JavaScript beacon inside the page. Which means it only reports on sessions where the page loaded and the beacon fired. Users who hit a DNS failure, a CDN 403, or a TLS error never load the beacon at all, so they report nothing. The worst outages produce the least RUM data, and traffic that quietly disappears looks like a slow sales day.
Detection speed compounds all three. Plenty of real outages are short, and short outages are the ones nobody catches by watching a dashboard. If your checks run every five minutes, a four-minute failure can start and finish between them and leave no evidence except the orders you didn’t get.
Closing all three gaps takes the same three things: check from outside your own infrastructure, render in a real browser, and judge the result on page content rather than status codes. That’s what synthetic monitoring does, and it’s what the rest of this guide sets up.
Synthetic Monitoring vs. RUM vs. Network Path Analysis
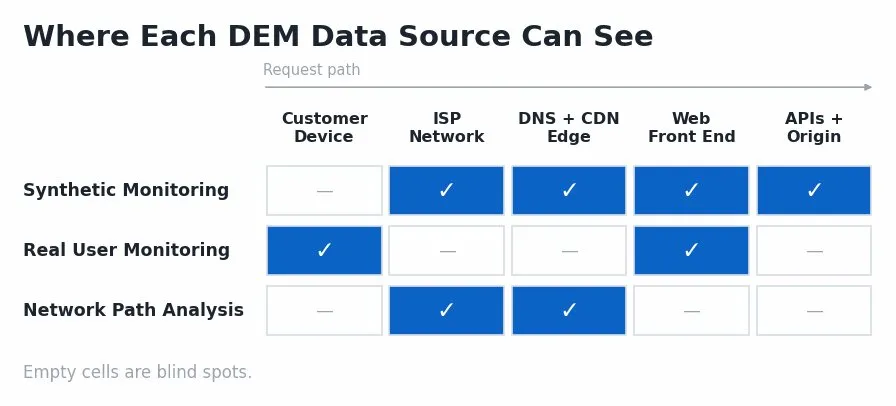
Analysts usually break DEM into three inputs. They overlap, and each one is blind somewhere the others can see.
| Source | What it measures | What it catches first | Blind spot |
|---|---|---|---|
| Synthetic monitoring | Scripted journeys run on a schedule from fixed locations, in a real browser | Broken steps, regional failures, third-party slowdowns, expired certificates, off-peak outages | Only tests the paths you scripted, with the devices and locations you chose |
| Real user monitoring | Field data from actual sessions: Core Web Vitals, device mix, browser mix | Long-tail device and browser problems, real traffic distribution | Survivorship bias: needs traffic and a page that loaded. Silent during hard failures and on low-volume pages |
| Network path analysis | Hop-by-hop routing, latency, and packet loss between vantage points and your service | ISP routing changes, peering problems, BGP issues, regional latency | Says nothing about whether the application logic worked |
Synthetic and RUM are the pair most teams actually run. Synthetic gives you a constant signal that doesn’t depend on someone being awake and shopping. RUM tells you what your real audience looks like. Use synthetic to detect and alert, RUM to prioritize what to fix.
Dotcom-Monitor covers rows one and three. Web application monitoring runs the scripted browser journeys, and Internet Infrastructure checks handle DNS, TLS, and the network-layer pieces beneath them. It does not collect RUM field data, so if you want session-level analytics from real shoppers, run a real user monitoring tool alongside it.
Synthetic has a hard limit of its own: it only knows the journeys you script. If nobody ever scripted guest checkout, guest checkout can stay broken for a week.
What to Measure on a Revenue Path
Start from the journey, not the metric list. For most ecommerce and SaaS sites, four paths carry nearly all the risk: search, add to cart, checkout, and login.
For each of those, track:
- Step-level success. Did every step complete, and did the page contain the text it was supposed to contain? A confirmation number is a better signal than a status code. In EveryStep, that’s a content assertion attached to each step, and it can check text, elements, HTTP status, response headers, or a JSON payload.
- Step-level duration. Total journey time hides the problem. You want to see that “apply promo code” went from 400 ms to 9 seconds while everything else held steady. EveryStep’s Script Time Watchers set a threshold per step, so that one step fails on its own instead of disappearing inside a journey that still passes.
- Core Web Vitals. Largest Contentful Paint, Interaction to Next Paint, and Cumulative Layout Shift on the pages that convert, not just the homepage. Web page monitoring reports these per page alongside the element waterfall.
- Time to first byte. Separates the delay in getting a first response, which includes DNS, TLS, redirects, CDN edge behavior, and origin latency, from the rendering work that happens after it. A slow page with a fast TTFB is a front-end problem.
- Third-party element timing. Payment providers, tag managers, chat widgets, review platforms, ad pixels. Third-party content monitoring matters because these are the assets you can’t patch and can only route around. The waterfall chart lists every third-party request as its own line, so you can see which vendor added 900 ms this month. Watch the third-party domains themselves too: a payment gateway with an expired certificate takes checkout down as completely as your own outage would.
- API response time and correctness. Inventory, pricing, tax, shipping, and payment calls sit behind every step in the funnel. Web Services checks hit those endpoints directly and assert on the response body, so you catch a bad payload before it reaches a page.
- Certificate and DNS health. A lapsed certificate on a payment subdomain takes checkout down completely, and it’s entirely preventable with SSL certificate monitoring and DNS monitoring running under the browser checks.
- Geographic variance. The same page from Chicago, London, and Singapore. Divergence between locations usually points at CDN or DNS rather than your application, which is why Dotcom-Monitor runs the same script from 30+ global locations rather than one.
Four Failures Your Uptime Check Will Miss
Each of these leaves a green uptime dashboard behind it.
1. The 200 OK Error Page
A card processor changes an API contract. Your checkout catches the exception, renders a friendly “Something went wrong, please try again” message, and returns HTTP 200. Every uptime check on the internet says the site is fine. Orders stop.
The fix is a content assertion: the scripted journey must find the order confirmation number, or the step fails.
What catches it: a Web Applications (UserView) check with an assertion on the confirmation step. EveryStep validates the actual rendered text, so “Something went wrong” fails the check even though the server returned 200.
2. A Third-Party Script That Only Hurts Mobile
A marketing team adds a personalization tag. Desktop barely notices. On a throttled mobile connection it adds three seconds before the pay button becomes interactive, so mobile conversion drops while desktop looks normal. Nobody connects the two for a week, because the deploy came from a tag manager rather than a release.
Running checkout on both a desktop and a throttled mobile profile makes the split visible the same day. It’s why browser monitoring for conversion optimization keeps showing up in funnel post-mortems.
What catches it: the same EveryStep script replayed against 40+ mobile browsers and devices as well as desktop. Compare the per-step timings between the two and the tag shows up as a single slow step, not a vague “the site feels slow on mobile.”
3. A Regional CDN or DNS Failure
A CDN configuration push breaks one point of presence. Customers in São Paulo get a 403 from the edge and never load your JavaScript. Your RUM data doesn’t dip, it just stops receiving Brazilian sessions, which reads as a soft traffic day.
A monitoring location in São Paulo fails on the very first check. This is the argument for a global monitoring network rather than checks from one cloud region.
What catches it: running the journey from 30+ locations, with a video recording synced to the waterfall chart on failure. You get the 403 page the Brazilian customer saw and the request that produced it, instead of a support ticket three days later.
4. An API That Degrades Instead of Failing
Your shipping-rate service starts responding in 11 seconds instead of 300 ms. It never returns an error, so error-rate alerts stay quiet. Customers reach the shipping step, watch a spinner, and abandon.
What catches it: a Web Services (WebView) check against the shipping-rate endpoint with a response-time threshold and an assertion on the JSON it returns. That fires on the API itself rather than waiting for the browser journey to time out downstream.
How to Set Up Digital Experience Monitoring
This order works whether you’re starting from nothing or adding depth to existing uptime checks.
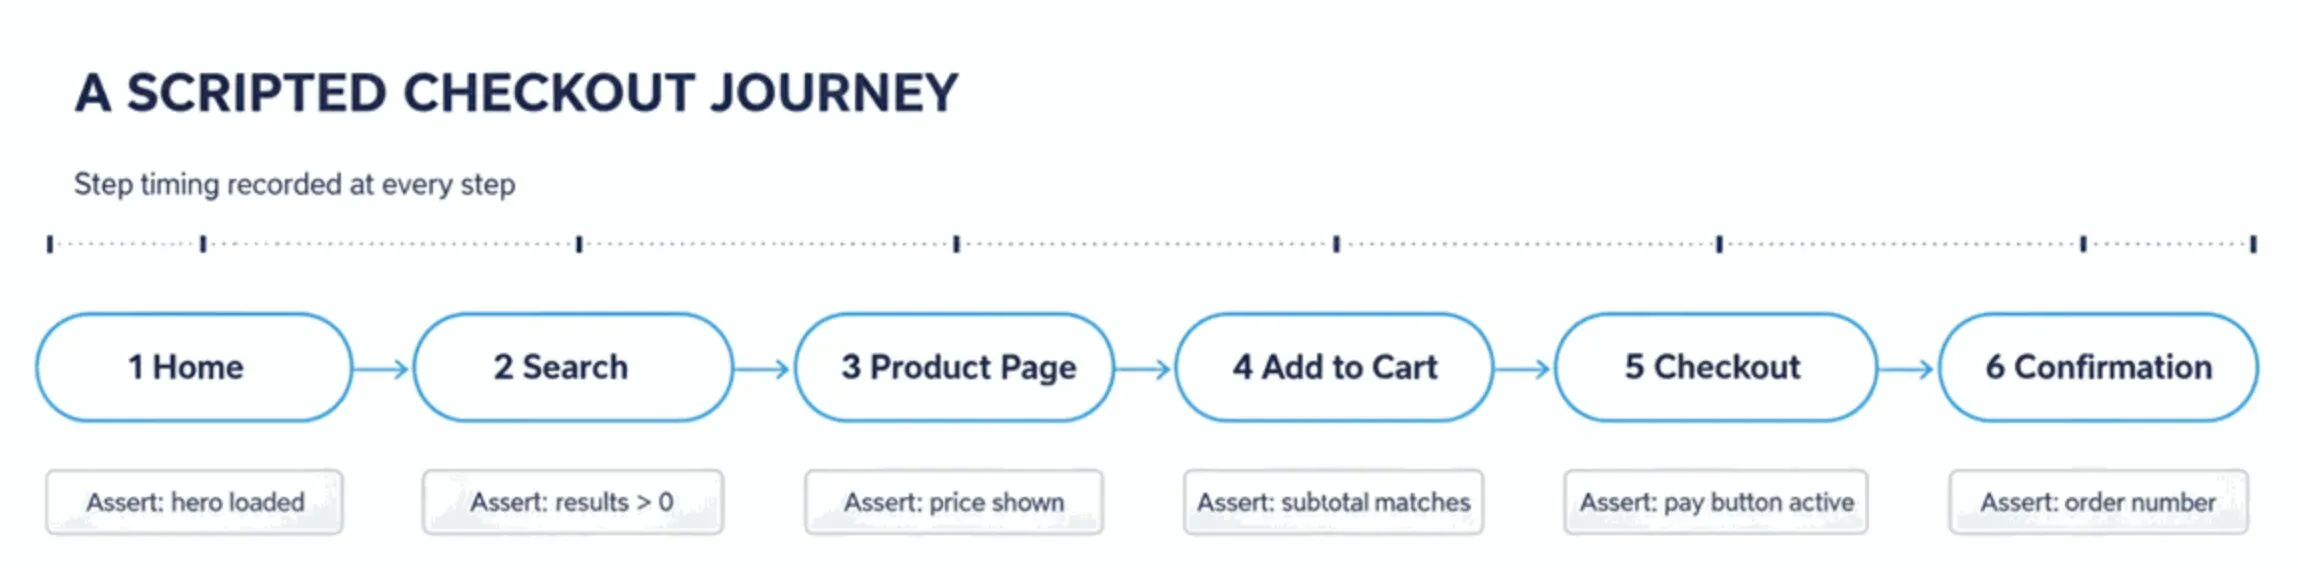
Step 1: Map the journeys that make money. Pull your funnel report and list the three to five paths customers actually take: search, add to cart, guest checkout, account checkout, login. Write down the exact success condition for each.
Step 2: Record each journey as a scripted transaction. Click through the path once in the EveryStep Web Recorder and it captures the clicks, form fills, navigation, and waits, including dropdowns, modals, AJAX-loaded content, and iframes. No selector-writing required. Handle the awkward parts deliberately: cookie banners, dynamic element IDs, one-time passwords, and a test payment method that won’t charge anyone. Give the script its own test account and an inventory-safe SKU so monitoring never creates real orders. This is what web transaction monitoring is for.
Step 3: Add an assertion to every step. Each step verifies text or an element that only appears on success: “Order confirmed,” a confirmation number, a cart subtotal matching the item price. EveryStep also asserts on HTTP status, response headers, and JSON payloads, so a step can fail on a bad API response before the page even renders wrong. Without assertions you’re back to checking status codes.
Step 4: Choose locations and devices that match your traffic. Take your top regions from analytics and monitor from those, not from wherever your servers happen to live. Dotcom-Monitor gives you 30+ locations and 40+ mobile browsers and devices, so pick the three or four that match your real audience and add at least one throttled mobile profile. Your monitoring frequency and locations should mirror the customers you actually have.
Step 5: Set frequency by revenue impact. Checkout deserves a tighter interval than a careers page. Full transaction scripts cost more to run than single-page checks, so spend the budget where the orders are.
Step 6: Monitor the services underneath. Add checks for the APIs your funnel depends on, plus DNS, TLS certificates, and any partner endpoint in the payment path. API monitoring with response assertions catches degradation the browser journey only shows you later.
Step 7: Route alerts so a person acts. Confirm a failure from a second location before paging anyone, which clears out false alarms from local network noise. Use a second location in the same region, though. Checking against a node on another continent suppresses the regional failures you built this to catch. Dotcom-Monitor’s alerting rules handle the thresholds and confirmation logic, and push to PagerDuty, Slack, and Teams natively, so checkout failures land where whoever can roll back a deploy will see them.
Step 8: Review waterfalls on a schedule. Once a week, open the waterfall chart for your slowest journey and look at what changed. Third-party assets creep in gradually and never announce themselves. On a failed run the waterfall comes paired with a video recording of the session, which usually answers “what did the customer actually see” in about ten seconds. Reading waterfall charts turns a slow number into a specific request to fix, and public dashboards and email reports put the same numbers in front of the people who ask about conversion.
How to Choose a Digital Experience Monitoring Tool
Most vendors will show you a dashboard. Fewer pass these questions.
- Does it run a real browser? HTTP-level checks can’t execute JavaScript, so they miss everything a modern storefront does after the initial response.
- How hard is it to script a multi-step journey? If a checkout script takes a developer two days, nobody maintains it when the cart page gets redesigned.
- Where can it test from? Count the locations that match your customers, not the total. Twenty nodes in North America don’t help a European launch.
- Can it assert on content, not just status? This separates transaction monitoring from a fancy ping.
- Does a failure come with root-cause data? A waterfall, a screenshot at the moment of failure, the failing element. An alert that only says “checkout failed” starts your investigation from zero.
- Does it fit your incident workflow? Alerts that arrive in PagerDuty, Slack, Teams, SMS, or a webhook get acted on. Alerts sitting in a dashboard nobody has open do not.
- Can it reach internal or staged environments? Pre-production and firewalled apps need a private agent inside the network.
- What does pricing do when you add journeys? Per-step or per-run pricing punishes the deep journey monitoring you’re buying it for.
How Dotcom-Monitor Handles Digital Experience Monitoring
Dotcom-Monitor covers the synthetic side of DEM, which is the detection layer for everything above. Four device types map onto the layers of a customer journey, and most storefronts end up using all four.
| Device type | What it monitors | What it gives you on failure |
|---|---|---|
| Web Applications (UserView) | Multi-step scripted journeys in a real browser: search, cart, checkout, login | Video recording of the session synced to the waterfall chart, plus per-step timing |
| Web Pages (BrowserView) | Single-page rendering, Core Web Vitals, element and third-party asset timing | Element-level waterfall showing which request slowed the page |
| Web Services (WebView) | REST, SOAP, GraphQL, and Postman-imported API calls behind the funnel | Response time, status, headers, and assertion results against the payload |
| Internet Infrastructure (ServerView) | DNS, TLS certificates, mail, FTP, TCP, and ping-level checks | Which layer failed, so you stop debugging the app when it’s a DNS record |
Journeys get recorded in the EveryStep Web Recorder as a point-and-click capture rather than hand-written selectors, then replayed across 40+ mobile browsers and devices and from 30+ locations on the global monitoring network. Per-step thresholds catch the step that got slow. Content assertions catch the step that looks fine and isn’t. Private agents run the same checks against staging or applications behind your firewall, which matters if you want to catch a bad checkout deploy before it ships.
Two honest caveats. Dotcom-Monitor is a synthetic platform and does not collect RUM field data, so pair it with a RUM tool if you need session-level analytics. And it isn’t an APM: it tells you a step broke and shows you where, not which line of your code threw. Teams that need both usually run retail and ecommerce monitoring alongside an internal APM and treat the synthetic layer as the outside-in early warning.
The Bottom Line
Digital experience monitoring closes the gap between “our servers are up” and “our customers can buy.” Most of the revenue you lose to performance problems disappears inside that gap: 200 OK error pages, third-party scripts that only hurt mobile, regional CDN failures your RUM data can’t see, and APIs that degrade without ever erroring.
You don’t need a large program to start. Pick your single highest-value journey, record it in EveryStep with an assertion on every step, run it from the three regions your customers are actually in, and route the alert to someone who can act. That one check will catch failures your current dashboard has been hiding.
Once it runs clean for a week, script the next journey and repeat. Most teams cover their whole funnel in three or four passes.
Monitor the Journeys That Matter
Record your checkout path in EveryStep, add an assertion to the confirmation step, and run it from 30+ locations in real browsers. Start a free Dotcom-Monitor trial and find out what your uptime dashboard has been missing.
