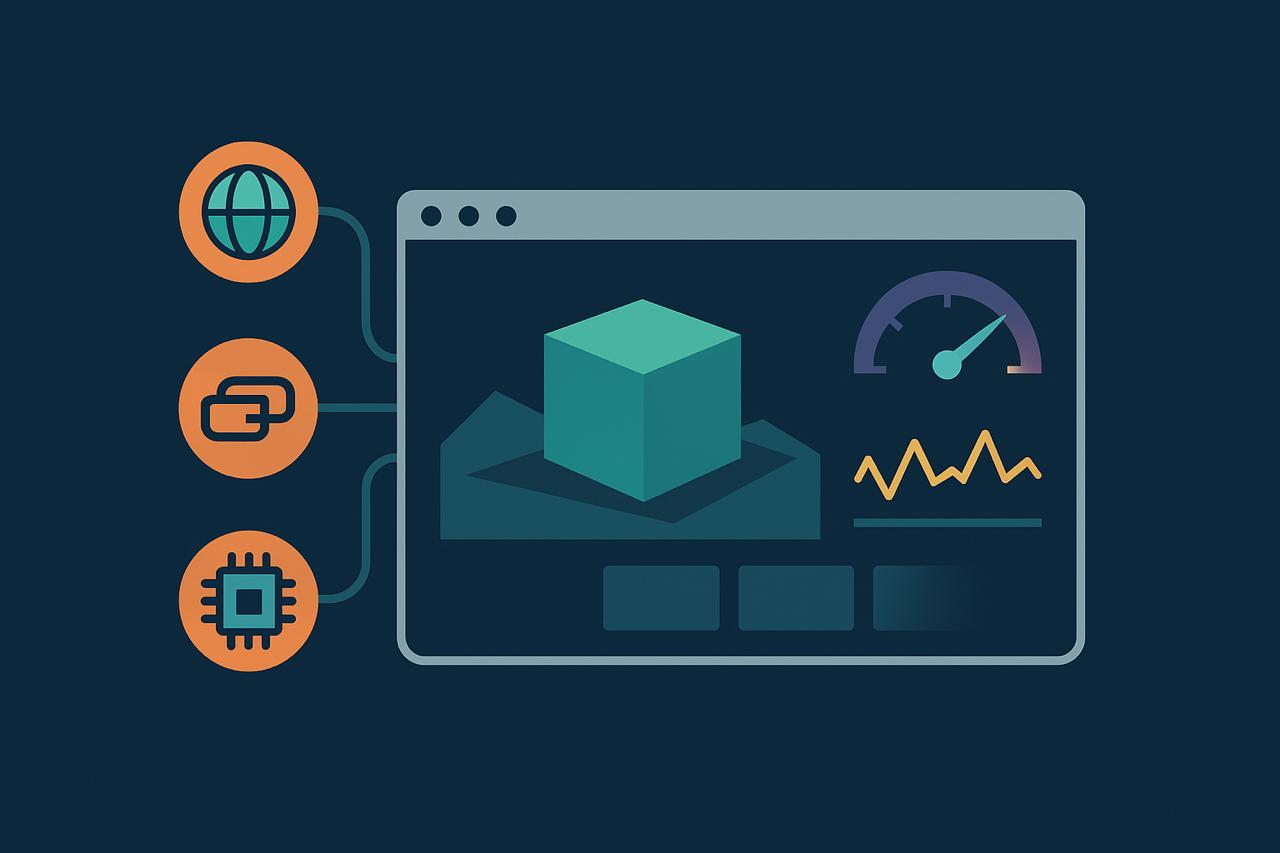
 WebGL has turned the browser into a real-time 3D engine. The same technology behind console-quality games now powers design platforms, architectural walkthroughs, and virtual conference spaces—all without a single plugin. These 3D experiences blur the line between web and desktop, blending high-fidelity rendering with persistent interactivity and complex real-time data streams.
But with that complexity comes a new operational challenge: how do you monitor it?
Traditional web monitoring—ping checks, API response times, HTTP uptime—can’t see inside a GPU render loop. They’ll report that a page is up while the user stares at a frozen canvas or half-loaded 3D scene. A modern WebGL application isn’t defined by its load time, it’s defined by how smoothly it renders and how reliably it interacts.
That’s where synthetic monitoring becomes essential. By simulating user actions within the 3D environment—joining sessions, manipulating models, moving through virtual rooms—teams can measure both backend health and frontend performance. Synthetic tests can validate frame stability, connection persistence, and interactivity long before users ever encounter a glitch.
This article explores how to monitor WebGL applications effectively. We’ll unpack the unique technical behaviors that make 3D web experiences difficult to observe, examine the metrics that actually matter, and show how tools like Dotcom-Monitor can deliver real visibility across games, CAD tools, and virtual spaces built on WebGL.
Why WebGL Applications Are Different
Monitoring a WebGL application is nothing like monitoring a website. A static web page might make a few HTTP calls and render a DOM tree. A WebGL app, on the other hand, spins up a GPU pipeline inside the browser, loading shaders, compiling programs, and continuously rendering frames at 60 frames per second—or trying to. The difference isn’t cosmetic, it’s architectural.
Where a traditional web app is built around request and response, WebGL runs on a continuous render loop. Each frame depends on the one before it, making performance issues cumulative. A missed draw call or shader compile failure can cascade into visible stutter, blank screens, or dropped interactivity. None of that would register in a standard uptime check.
WebGL’s dependencies also extend well beyond HTTP:
- WebSocket channels maintain real-time state—syncing game worlds or updating collaborative design sessions.
- WebRTC streams power voice, video, and shared interactions.
- GPU drivers and device capabilities determine shader compatibility and rendering performance.
- CDNs serve massive texture and model files that can vary by region or cache state.
The result is a multidimensional performance problem: CPU, GPU, network, and rendering layers all interacting in real time. Monitoring that ecosystem means tracking not just whether something loads, but how it behaves over time.
A WebGL app can technically be “available” while completely unplayable. Frames can drop to 15 per second, the render loop can hitch on garbage collection, or WebSocket connections can drift out of sync. Without synthetic visibility into these behaviors, you’re flying blind.
The Core Challenges of Monitoring 3D Web Experiences
Persistent Sessions
Most WebGL applications maintain open sessions for minutes or hours. They don’t reset after a single transaction. Monitoring tools must manage long-lived browser sessions without timing out or losing context, a sharp contrast to standard one-and-done HTTP checks.
GPU Variability
Performance differs drastically between devices. A synthetic monitor running on a headless VM can’t replicate a user’s discrete GPU, but it can benchmark consistency across test environments—catching performance regressions when a shader suddenly doubles its draw calls.
Frame Rate and Render Loop Health
WebGL applications live and die by frames per second (FPS). Monitoring needs to track both average FPS and variance over time, surfacing stutter or animation jitter before users complain.
Network Dependencies
WebSocket and WebRTC connections define the “real-time” in real-time 3D. Packet loss or jitter can destroy interactivity. Synthetic agents can measure connection persistence, latency, and message success rate across regions.
Complex Assets
High-resolution textures and 3D models often exceed hundreds of megabytes. Delayed or partial loading from a CDN can cause invisible slowdowns that only appear under specific regions or cache conditions.
User Input Fidelity
Interactions like drag, rotate, and zoom must be simulated to ensure proper response. Without synthetic input simulation, you can’t verify interactivity or detect bugs where controls silently fail.
Visual Correctness
Even when everything “loads,” scenes can render incorrectly. Missing shaders, corrupted lighting, or z-fighting (where geometry flickers) can only be detected through visual validation—something traditional network monitors don’t provide.
These factors combine into one truth: monitoring a WebGL app isn’t about endpoints. It’s about experience integrity—the continuous interplay of rendering, data, and responsiveness.
What Synthetic Monitoring Looks Like for WebGL
Synthetic monitoring is about replaying user journeys in a controlled, measurable way. For WebGL applications, that means using real browsers and scripted inputs to validate how the scene loads, performs, and reacts.
The basic structure of a WebGL synthetic test looks like this:
- Initialization — Launch a real browser, load the 3D application, and wait for initialization events (canvas creation, WebGL context ready).
- Asset Loading — Track how long it takes textures, shaders, and geometry to finish downloading and compiling.
- Render Validation — Confirm that the WebGL canvas begins rendering (e.g., detecting changes to pixel data, canvas size, or DOM attributes).
- Interaction Simulation — Execute user events like mouse movements, drags, rotations, or object clicks. Measure response time.
- Network and Connection Checks — Verify that WebSocket messages are exchanged or WebRTC peers remain connected.
- Visual Capture — Take screenshots for comparison or use visual diffing to catch rendering regressions.
Unlike passive RUM (real user monitoring), synthetic checks can run proactively—before a release, after a deployment, or every few minutes from distributed global locations. They answer a different question: will users see what we expect them to see?
By integrating browser performance APIs (window.performance, requestAnimationFrame, or WebGLRenderingContext.getParameter), synthetic monitors can extract meaningful frame-level telemetry without modifying production code.
Key Metrics to Track in WebGL Monitoring
- Frame Rate (FPS): The single most direct indicator of rendering health. Low or unstable FPS suggests shader issues, GPU contention, or asset overload.
- Frame Variance and Stutter: Jitter between frames is often more noticeable than average FPS drops. Synthetic tests can log delta times between frames to quantify smoothness.
- WebGL Context Stability: Browsers occasionally lose WebGL contexts due to GPU resets or driver faults. Detecting “context lost” events is critical for reliability monitoring.
- Shader Compilation Time: Long shader compile times increase initial load latency. Tracking compile duration helps developers tune complexity.
- Asset Load Time: Large textures and models impact both initial load and memory footprint. Synthetic agents can capture load times per asset and detect bottlenecks in CDNs.
- WebSocket / WebRTC Latency: Synthetic probes can measure ping intervals, message acknowledgments, and disconnections to ensure real-time stability.
- Input-to-Response Delay: Simulating user input (e.g., rotating a model) and measuring render response validates interactivity performance—a core UX metric for 3D apps.
Collectively, these metrics create a realistic profile of how your 3D environment performs from the user’s point of view.
Synthetic Monitoring Strategies
Synthetic monitoring for WebGL falls into two main categories: functional and performance.
Functional Synthetic Checks
These tests verify that the app loads correctly and the scene renders as expected:
- Confirm WebGL context creation.
- Validate that all assets load successfully.
- Perform basic user interactions.
- Capture screenshots for pixel-level comparisons.
Functional checks ensure that new builds haven’t broken initialization, rendering, or navigation.
Performance Synthetic Checks
These focus on runtime behavior and responsiveness:
- Log FPS and frame variance over a defined period.
- Measure shader compile time and GPU memory footprint.
- Introduce network throttling to simulate latency or packet loss.
- Run scheduled benchmarks to detect gradual degradation.
A healthy monitoring strategy mixes both: functional for reliability, performance for experience quality.
Advanced teams add regional distribution, running tests from multiple data centers to reveal how CDN edges, WebSocket latency, or client-side rendering differ globally. Combined with real user telemetry, this creates a feedback loop: synthetic monitoring detects regressions, and real-user data validates thresholds.
Security and Stability Considerations in WebGL Monitoring
Monitoring shouldn’t compromise the environments it tests. For 3D and collaborative applications, that requires a deliberate balance between access and control. Every synthetic session should operate under the same security expectations as a real user, but with tighter constraints.
All traffic must use encrypted transport—WSS for WebSocket connections and HTTPS for asset delivery—to protect data in transit. Credentials used by monitoring scripts should be treated as sensitive secrets and restricted to low-privilege, non-production accounts. Avoid persistent logins, and understand that synthetic sessions should start clean and end clean, resetting authentication each time to prevent session drift or unintended persistence.
Because automated environments often run without dedicated GPUs, they can exhaust memory under heavy rendering. Proactively managing GPU resources helps prevent “out of memory” crashes and ensures consistent performance across test runs. Finally, synthetic monitors should disconnect gracefully once tests complete, avoiding phantom users or stale sessions that linger in collaborative or multiplayer systems.
By treating monitoring sessions as isolated, ephemeral users—secure, disposable, and contained—you ensure both accuracy in performance data and safety in operations.
Using Dotcom-Monitor for WebGL Synthetic Monitoring
Synthetic monitoring for 3D applications demands real browsers, visual validation, and connection awareness—exactly where Dotcom-Monitor’s UserView excels.
UserView scripts full browser sessions, capturing every stage from page load to 3D canvas render. Teams can:
- Validate that WebGL contexts initialize correctly.
- Confirm asset downloads and shader compilations.
- Measure interactivity by scripting drag, rotate, or click actions.
- Detect visual changes using automated screenshot comparisons.
- Monitor WebSocket or WebRTC connections for latency, uptime, and throughput.
Because Dotcom-Monitor operates from global test nodes, it reveals geographic differences in CDN performance, GPU-heavy load times, or connection stability. You can schedule continuous tests to detect degradation or run pre-deployment checks to validate new versions.
Example:
A team maintaining a browser-based 3D CAD platform uses Dotcom-Monitor to run hourly synthetic sessions that load complex models, interact with them, and measure FPS stability. When a new build introduced a shader bug that halved frame rate on Chrome, synthetic metrics flagged it within minutes—before customers reported performance drops.
This is the value of synthetic visibility: catching 3D-specific failures that traditional uptime monitoring will never see.
Monitoring the Future: WebGPU and Beyond
WebGL isn’t the end of the story. Its successor, WebGPU, is already emerging in Chrome, Edge, and Safari. It gives developers deeper access to hardware acceleration, compute shaders, and parallel workloads. The upside is performance. The downside is complexity.
As these new APIs evolve, monitoring must evolve with them. Future 3D experiences will combine physics simulations, AI models, and GPU-based computation—all inside the browser. Synthetic monitoring will need to capture GPU timings, pipeline throughput, and memory pressure as first-class metrics.
The principle won’t change, though: visibility into how something renders will remain as important as whether it renders at all. Synthetic testing will continue to provide that view.
Final Thoughts on WebGL Application Monitoring
WebGL brought immersive, interactive 3D experiences to the web—but it also broke traditional monitoring models. Applications built on continuous rendering, real-time communication, and GPU processing require a new approach to observability.
Synthetic monitoring bridges that gap. By replaying user interactions, validating visual output, and measuring real frame-level performance, teams can ensure that their 3D worlds, games, and virtual spaces stay smooth, stable, and responsive.
With Dotcom-Monitor, this becomes operationally practical. UserView scripts run real browsers, inspect live render loops, and catch performance regressions before users ever feel them. Whether your team runs a 3D product configurator, a multiplayer simulation, or a virtual workspace, synthetic visibility means you don’t have to guess when performance dips—you’ll know instantly.
