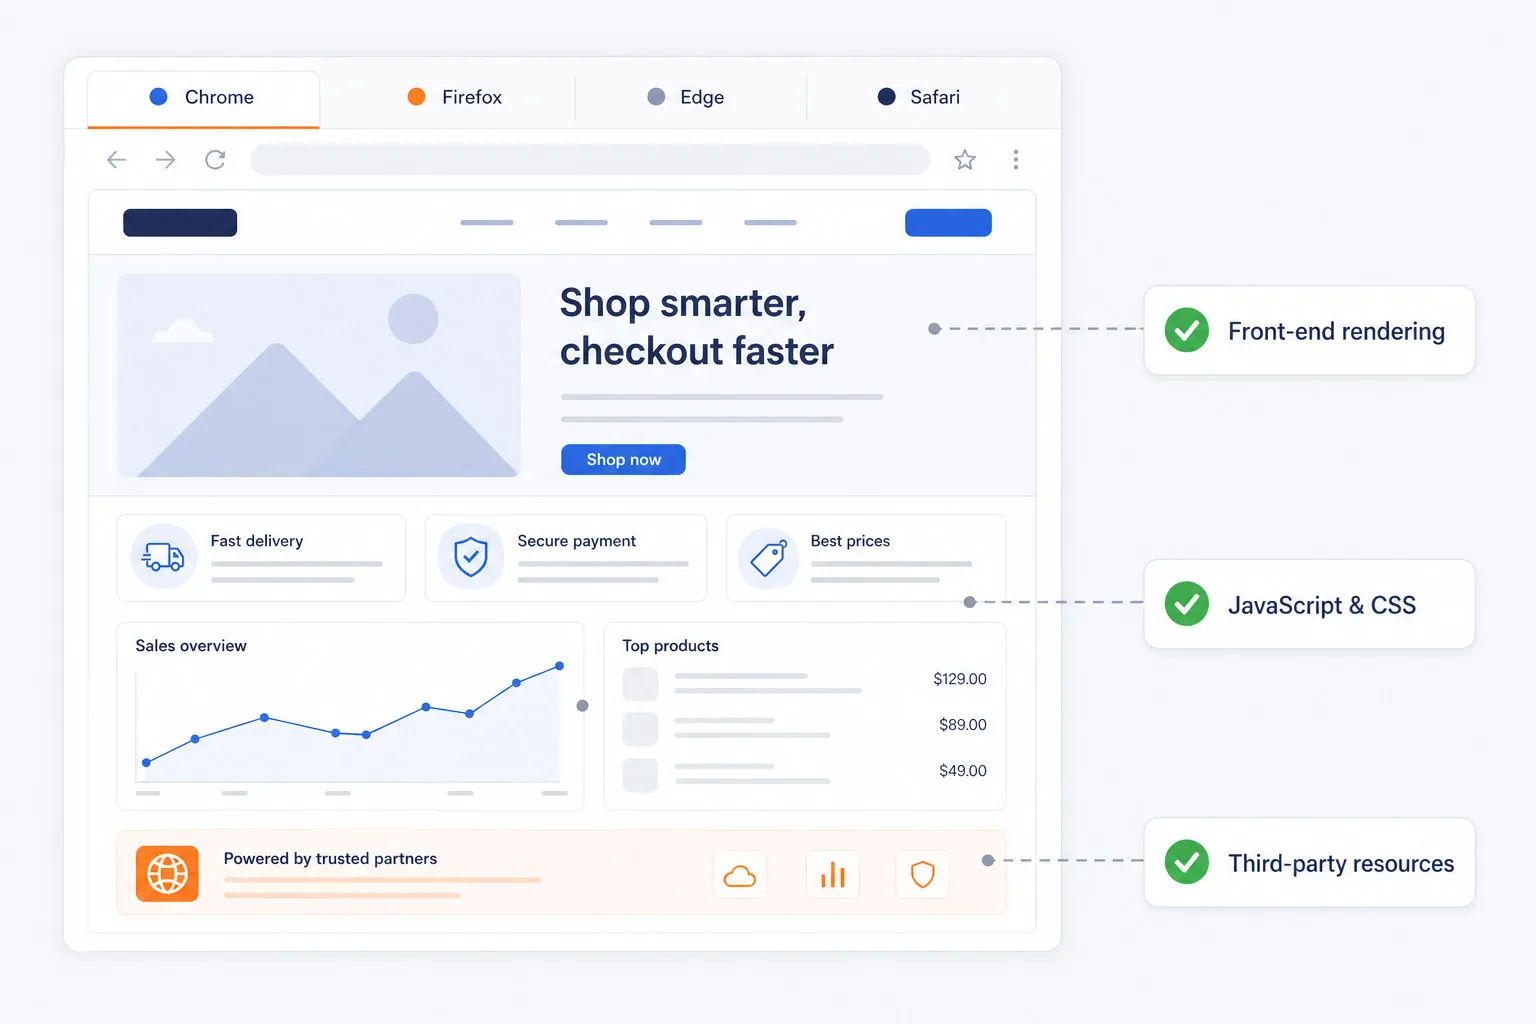
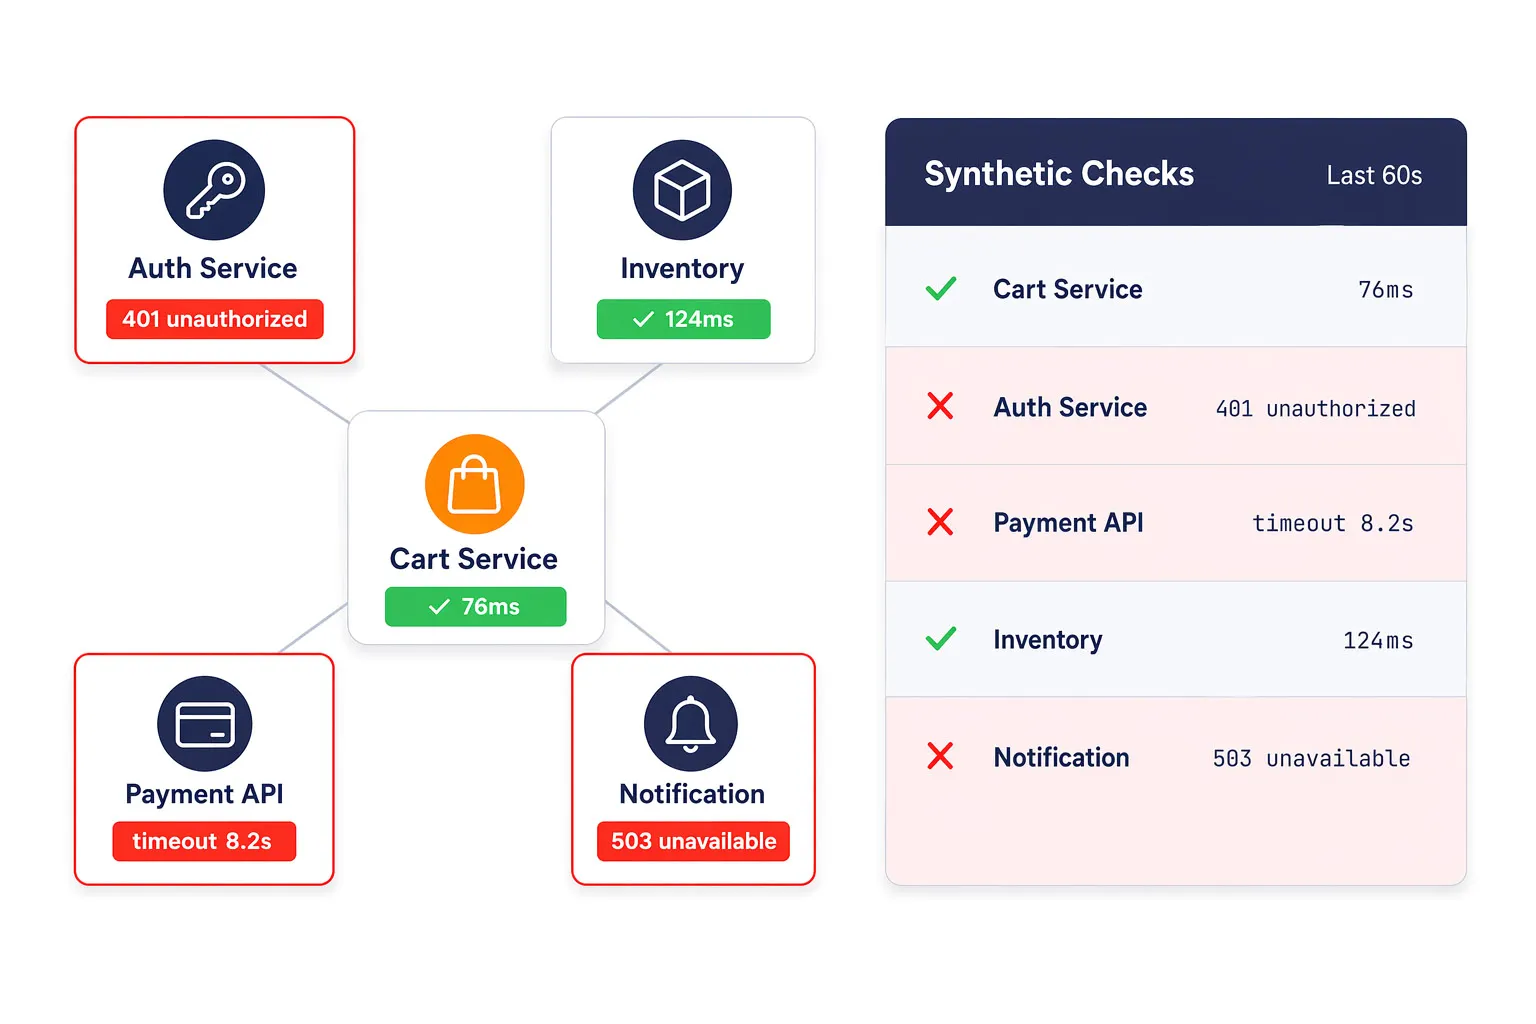
ServiceNow is one of those platforms that looks simple from the outside but turns into a labyrinth the moment an organization starts customizing it. What begins as a service catalog or an HR portal quickly evolves into a tangle of custom tables, UI policies, business rules, Flow Designer actions, and scripted REST endpoints. None of this is bad. In fact, it’s the whole reason companies choose ServiceNow: you can build anything.
But with that flexibility comes fragility. The moment you introduce custom logic—especially logic that depends on other logic—you create failure modes that don’t show up in the built-in monitoring and aren’t visible through most internal dashboards. A ServiceNow instance can look healthy on paper while the portal is completely unusable for real users.
That’s where synthetic monitoring fits. Not the lightweight “synthetics” ServiceNow runs internally to validate workflows, but outside-in, browser-level monitoring that simulates the way an actual user interacts with your portal. The difference between the two is the difference between checking a server’s heartbeat and checking whether a human can actually submit a ticket.
External synthetics catch the failures that originate in your custom tables, your client scripts, your scripted APIs—and ultimately your design decisions. As the number of moving parts grows, the only reliable way to confirm that your ServiceNow portal works is to use something that behaves like a real person hitting it from the internet.
That’s the scope of this article: why ServiceNow’s customizations are the root of most breakage, why native tools can’t see it, and how synthetic monitoring fills the gap.
Why ServiceNow Customizations Break the Portal Experience
The Now Platform gives organizations an enormous surface area for customization. And because the underlying structure is so modular, it’s easy to assume that a small change in one place won’t have consequences elsewhere.
In reality, almost everything in ServiceNow is relational—custom tables reference other tables, rules fire against inherited classes, scripts mutate state that other scripts depend on. Even UI elements that look simple in the browser may be powered by a stack of GlideRecord queries, ACL checks, and server-side business rules.
When something goes wrong, it rarely looks like a traditional “downtime” event. Instead, users see symptoms like:
- Pages that load slowly until they time out.
- Catalog items that freeze after pressing Submit.
- Widgets that spin forever because a custom API returned incomplete JSON.
- Search results that suddenly return nothing because a rule adjusted ACL inheritance.
- A knowledge page that works internally but breaks the moment someone hits it through SSO.
To ServiceNow’s infrastructure, everything is “up.” But to your employees or customers, the portal might as well be offline.
These failure modes don’t emerge from the base platform, they emerge from how it has been customized. Tables, rules, endpoints—each introduces a weak point. Synthetic monitoring works because it doesn’t care what the internal state of the instance is. It only cares whether the portal behaves correctly.
The Blind Spots in ServiceNow’s Native Monitoring
ServiceNow does have “synthetic” monitoring built into the platform. But it’s internal synthetic monitoring—checks that run from inside the instance, validating workflow execution, business logic, and basic SLAs.
Useful? Yes. Sufficient? Not remotely.
Internal synthetics live inside the same conditions the portal does. They don’t traverse VPNs, corporate firewalls, different geographies, third-party identity providers, DNS layers, or CDNs. They don’t load a browser, execute JavaScript, or render the portal in anything resembling a real user environment. They don’t follow multi-step journeys across catalogs, approvals, scripts, and back-end integrations.
Most importantly, they don’t touch what breaks the most: your custom code. Common occurrences are:
- A custom client script that throws an error doesn’t trigger an internal synthetic failure.
- A Flow Designer action stalling because a third-party API is slow won’t trigger internal alerts.
- A scoped app’s endpoint returning a malformed payload won’t register as unhealthy unless you specifically test it.
- A browser-side performance regression caused by a widget modification won’t appear in server logs.
Native monitoring validates the platform. External synthetic monitoring validates the experience.
If you only look at what happens inside ServiceNow, you’ll always be half-blind.
Monitoring Custom Tables: When Data Architecture Breaks UX
Everything in ServiceNow sits on top of tables, and the moment an organization introduces custom tables, the dependency graph grows geometrically. A new incident subclass, a record producer backed by its own schema, a custom CMDB extension—each becomes a new source of potential drift.
The biggest problems show up in the portal long before anyone notices them in the instance.
- An ACL update that looked harmless suddenly blocks a reference field from populating, which cascades into a catalog item that appears to “freeze.”
- A custom table inherits from a parent that has been modified over time, and now a rule that relies on a particular field doesn’t fire.
- GlideRecord queries run slower as record counts increase, and the portal times out even though the instance shows normal CPU.
- A cross-table dependency breaks silently, leaving workflows stuck in “requested” without error messages.
These are not outages in the traditional sense. They are workflow failures. And they are invisible unless you test the actual portal components that rely on those tables.
Synthetic monitoring catches this because it stitches the entire table-dependent workflow together: open catalog > fill fields > submit > verify state change. You see the whole path, not just the bits ServiceNow believes are fine.
Monitoring Business Rules & Client Scripts
Rules are the most deceptively dangerous part of ServiceNow because they chain together in subtle ways. A business rule fires after insert, which triggers a Flow Designer action that updates a field, which triggers a script include, which calls a custom API—and suddenly a simple ticket submission turns into a distributed system.
Client scripts create a different flavor of breakage: a bad condition, a missing variable, or a new UI policy that conflicts with an older one. These failures don’t show up in logs as obvious errors. They show up in the browser as delays, frozen buttons, and inconsistent form behavior.
The portal is where the combination of business rules + client scripts reveals itself.
Synthetic monitoring catches:
- A business rule causing a slow glide query that spikes submission times.
- A UI policy that misfires when specific fields are empty.
- A client script that breaks only in Chrome, not in Firefox.
- A rule that reroutes data into the wrong table because of inheritance drift.
ServiceNow’s internal synthetics will happily report “all systems normal” while users slam the help desk with screenshots of spinning widgets.
Outside-in tests are the only reliable way to detect whether the rule stack is behaving the way you expect.
Monitoring Custom Endpoints & Integrations
Custom endpoints are where a ServiceNow portal stops being a simple web interface and starts behaving like a real application. Organizations extend the platform with scripted REST APIs, integration records, Flow Designer actions that call external systems, scoped app endpoints, and a mix of inbound and outbound webhooks. Each addition deepens the dependency chain, and each dependency introduces a point of failure that lives outside the core ServiceNow environment.
This is where a large share of portal breakage originates. A scripted REST API that malfunctions causes the widget relying on it to spin indefinitely. An external integration that slows down forces catalog submissions to hang long enough that users assume they’ve failed. Middleware systems like MuleSoft or Workato may enforce rate limits or intermittent throttling, and when that happens, ServiceNow often responds with vague error states that offer no meaningful clues to the user. Even something as subtle as an endpoint returning malformed or partial JSON is enough to break UI components in ways that don’t surface as traditional errors.
None of these issues appear in ServiceNow’s native monitoring. The platform only sees its own infrastructure, not the external calls your customizations depend on. But a synthetic test treats those dependencies as first-class citizens of the workflow. It loads the widget, triggers the API call, processes the response, updates the relevant tables, and verifies the final state just as a real user would. That full chain—the combination of browser behavior, network conditions, endpoint performance, and platform logic—is what determines whether the portal actually works.
If you aren’t testing the entire workflow continuously, you’re relying on hope rather than validation. And in a customized ServiceNow environment, hope is not a strategy.
Outside-In Synthetic Monitoring for ServiceNow Portals
Browser-level synthetic monitoring is fundamentally different from internal workflow checks. It loads your portal exactly as a user does: from a real machine, running a real browser, over the public internet.
This recreates the full path:
- DNS resolution
- CDN routing
- Corporate or cloud gateways
- SSO or external identity providers
- JavaScript execution
- Widget rendering
- API calls
- Table updates
- Portal responses
It’s the difference between checking whether the engine runs and checking whether the car actually drives.
For ServiceNow portals—especially those with extensive customizations—this is the only way to capture reality.
- If a page takes 7 seconds to load, you see it.
- If a widget throws a console error, you see it.
- If a custom endpoint returns malformed JSON, the test fails exactly like a user would fail.
- If a release update changes a script’s behavior, the step timing spikes.
Outside-in synthetics don’t care whether the instance thinks it’s healthy. They care whether a human can accomplish the task.
Modeling Real ServiceNow Portal Journeys
ServiceNow portals aren’t linear applications, they’re branching flows. A good synthetic test reflects this. The goal is not to click through pages randomly—it’s to validate the business logic embedded in the tables, rules, and endpoints your organization created.
A proper test mirrors a real workflow:
- Authenticate (often through SSO).
- Open the custom portal or service catalog.
- Search for a catalog item that depends on custom tables.
- Populate fields that trigger client scripts or UI policies.
- Submit, triggering business rules and endpoint calls.
- Validate the resulting record in the correct table.
- Confirm that follow-up state changes propagate.
This recreates every step where things typically break.
Good synthetic tests include:
- Dynamic waits for asynchronous widget loading.
- Assertions tied to actual data values, not static text.
- Verification that the ticket lands in the correct table with the correct state.
- Checks that custom endpoints return expected objects.
- Timing analysis that reveals slow rules, scripts, or integrations.
This isn’t lightweight health checking. It’s full-stack behavioral verification of the custom application your team built on top of ServiceNow.
Catching Upgrade & Release Regression in ServiceNow
ServiceNow’s twice-yearly upgrades are a predictable source of unpredictable failures. Even with careful sub-production testing, subtle regressions slip through because the platform’s behavior can shift in ways that only become visible in a fully customized environment. A client script that behaved perfectly in one release may break after a UI framework change. A custom widget might rely on dependencies that are quietly refactored. A business rule may begin firing twice because of altered execution order. Flow Designer actions can return slightly different output structures, and GlideRecord queries may perform differently due to changes in indexing or query optimizations.
These aren’t dramatic outages, they’re second-order failures that surface only in the portal, usually as sluggishness, unexpected form behavior, or components that refuse to load. And because so many customizations rely on inherited tables or platform-level abstractions, even small changes ripple outward until something breaks.
Synthetic monitoring is the only reliable way to surface these issues before users experience them. Where manual upgrade testing focuses on known paths, synthetics validate the living workflows—catalog items, ticket creation, approvals, search behaviors, and integration-dependent components. Hours after an upgrade, users will eventually report what’s broken. Synthetic monitoring gives you that visibility immediately, providing a regression safety net that stays in place long after the upgrade window has closed.
Where Dotcom-Monitor Fits In
Dotcom-Monitor doesn’t replace ServiceNow’s internal tools. It complements them by filling the visibility gap between the platform and the user experience.
With real-browser monitoring, you get step-level timings that reflect client-side performance, not just server-side status. With API monitoring, you can validate custom endpoints and integrations independently. With global locations, you see how different networks and regions interact with your portal. And with multi-step scripting, you can model the exact workflows that rely on your custom tables, rules, and endpoints.
In other words: internal monitoring keeps the platform honest, and external monitoring keeps the experience honest.
Conclusion
ServiceNow becomes powerful through customization. It becomes fragile for the same reason. Every custom table, rule, and endpoint introduces new ways for the portal to fail—often silently, and often without any indication in ServiceNow’s native monitoring tools.
Synthetic monitoring closes the visibility gap by recreating the full journey from the user’s perspective. It validates the workflows that depend on your custom data structures. It catches behavioral issues introduced by scripts and rules. It exposes the failures hidden behind API calls and integrations. And it does all of this continuously, regardless of how healthy the instance believes it is.
For organizations relying on ServiceNow as a front-door experience—whether for ITSM, HR, customer portals, or bespoke applications—outside-in validation isn’t optional. It’s the only reliable way to know whether the portal works.
Tables. Rules. Endpoints. They’re the core of your ServiceNow customizations—and the core of your monitoring strategy. External synthetics ensure they behave the way you intended, not just the way the platform reports.