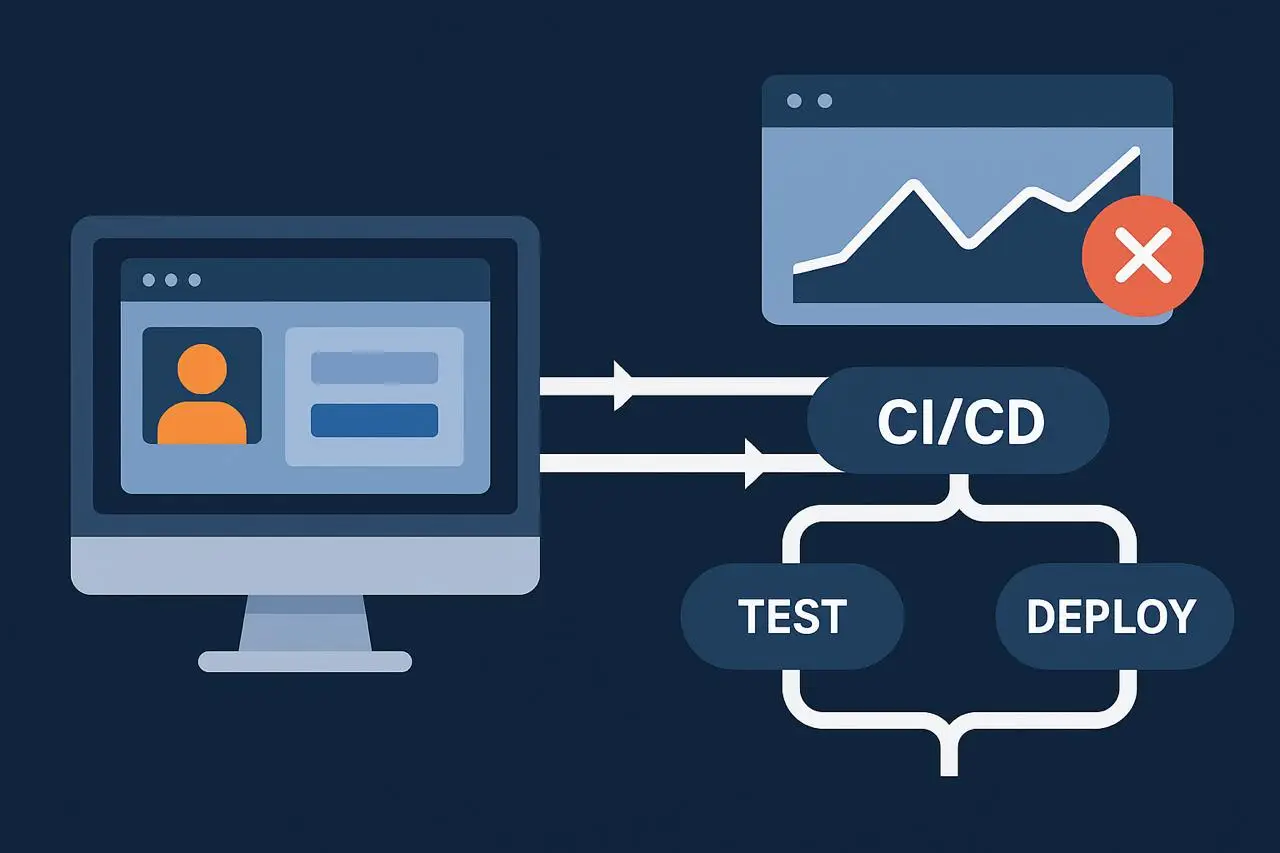
Continuous Integration (CI) and Continuous Deployment (CD) pipelines are automated systems that handle almost every step of modern software development, from writing code to delivering it live to the users. They’re central to how modern development teams work, continuously moving code through testing and deployment. Instead of developers manually compiling code, the pipeline automatically does it whenever new code is pushed. It automatically tests small parts of the code to make sure nothing is broken.
For engineering teams that need to develop, test, and release software quickly, CI/CD pipelines are the key system that enables that speed and flexibility. CI/CD pipelines are excellent at making sure the code works as intended; they check whether functions, APIs, and components behave correctly from a technical perspective.
What Is Synthetic Monitoring in a CI/CD Context?
If you’re building this into your pipeline for the first time, our complete guide on what is synthetic monitoring explains the fundamentals before you integrate. Synthetic monitoring doesn’t just test bits of code or APIs in isolation like unit tests do—it simulates how a real user interacts with the application. For example, it performs full user actions such as: Logging into an account, Filling out and submitting a form, and completing a purchase. It does these tasks from the outside, just like a real customer using a website or app—through an actual browser, following redirects, loading assets, and checking that everything works properly.
Synthetic monitoring can be added to CI/CD pipelines at different points to find and fix problems early making sure the application runs well and is available.
Pre-Deployment in Staging Environments
Simulate Critical Workflows
Before deploying to production, synthetic monitors can simulate user journeys (e.g., login, checkout, and search) in the staging environment
Early Issue Detection
If these simulated transactions fail or exhibit poor performance, the deployment can be halted, preventing faulty code from reaching production.
Validate Functionality
This stage acts as a crucial guardrail, verifying that core functionalities are working as expected in a near-production environment.
Post-Deployment Smoke Tests
Immediate Production Validation
After a successful deployment to production, a rapid set of synthetic checks should be triggered.
Confirm Live Environment Health
These tests confirm that the live environment is healthy, critical endpoints are responding, and essential user flows remain functional after the deployment.
Catch Deployment-Related Issues
This helps catch issues that might only manifest in the production environment due to configuration differences or external service interactions.
Scheduled Regression Runs
Ongoing Performance Assurance
Implement scheduled synthetic monitoring runs (daily, weekly, or aligned with business events) on the production environment.
Detect Drift and Degradation
These runs help identify performance degradation, functional regressions, or issues arising from external dependencies, configuration changes, or underlying infrastructure drift that may not be immediately apparent after deployment.
Proactive Problem Identification
This provides continuous assurance that critical workflows continue to function correctly long after the initial deployment.
Benefits of Integrating Synthetic Monitoring Into CI/CD
Synthetic monitoring into your CI/CD pipeline (the automated process that builds, tests, and deploys code) gives your system the ability to test the real user experience before the app goes live. Detect problems earlier in the development process, not after deployment. Developers can release updates knowing that core user flows (like login or checkout) have been tested automatically. Alerts immediately trigger if something breaks during the test phase, enabling quick fixes before users experience any impact. Simulated user flows help verify that the deployed version behaves correctly in the live environment.
Shift-left reliability
Issues are detected and fixed early in the development cycle, before code is released to production and negatively impacts users.
Increased confidence in releases
By simulating critical user paths and transactions, synthetic tests validate that core functionality is not broken by new changes, providing more assurance than just backend logic checks.
Regression protection
Synthetic checks act as a safety net, flagging if new code changes accidentally break existing features or user flows.
Faster incident response
A failed synthetic test in the pipeline generates an alert much faster than waiting for an end-user to report an issue, leading to a quicker recovery time.
Improved production consistency
Synthetic monitoring helps ensure that the application functions as expected in the live environment by continuously checking critical paths and business transactions from an external perspective.
Want to see how synthetic monitoring can strengthen your production consistency in real time?
Explore our Synthetic Monitoring solution
To learn how proactive testing, browser scripting, and real user emulation keep your applications performing flawlessly — before customers ever notice an issue.
Best Practices for Synthetic Monitoring in CI/CD
To implement synthetic monitoring in CI/CD effectively, use a layered testing strategy, integrate monitoring scripts into the pipeline, and configure tests to avoid polluting production data. Define clear policies for which checks are blocking “gates” versus non-blocking “warnings” to prevent alert fatigue and ensure that failures are taken seriously. Automate tasks with version control and Infrastructure as Code (IaC) to manage monitoring scripts and configurations reliably. Part of that strategy is choosing the right cadence for each check type — our article on synthetic monitoring frequency best practices covers exactly how to tier your intervals.
Implementation and strategy
Start with clear objectives
Before writing any tests, define what you want to achieve with synthetic monitoring and align it with your overall testing goals.
Build a layered testing strategy
Don’t rely on synthetic monitoring alone. Use it in conjunction with other automated tests like unit, integration, and end-to-end tests to create a robust quality gate.
Process and security
Shift security left
Integrate security testing, including synthetic monitoring for security vulnerabilities, early in the pipeline.
Use access controls
Implement proper access controls for your CI/CD pipeline and monitoring tools to prevent unauthorized changes.
Common Monitoring Challenges and How to Solve Them
Many of these challenges trace back to script quality — our deep dive into engineering robust monitoring scripts covers authentication handling, dynamic content, and maintenance patterns that keep pipelines stable. Common monitoring challenges include the sheer volume of data, complexity of modern IT environments, and alert fatigue. These can be solved by using automated tools, implementing a layered monitoring approach (e.g., synthetic monitoring in CI/CD pipelines), and focusing on actionable alerts rather than just the volume of data.
Want to dive deeper into solving modern monitoring challenges?
Check out our blog post The Best Tools for Synthetic & Infrastructure Monitoring. A Comparative Guide to learn how leading solutions tackle alert fatigue, data overload, and complex IT visibility.
Challenge: Too much data
- Problem: Modern systems generate vast amounts of data, making it difficult to find relevant information.
- Solution: Use automated tools to collect, aggregate, and analyze data, and focus on key metrics rather than all raw data.
Challenge: Complex environments
- Problem: Hybrid, cloud-native, and containerized environments are complex, making it hard to get a complete picture.
- Solution: Adopt a layered monitoring approach that covers different parts of the stack, from the physical infrastructure to the user’s experience. For example, use synthetic monitoring to simulate user journeys in your CI/CD pipelines.
Challenge: Alert fatigue
- Problem: Too many alerts, many of which are false positives, can overwhelm IT teams and lead them to ignore critical issues.
- Solution: Implement a system for prioritizing and de-duplicating alerts. Focus on actionable alerts that require immediate attention, and reduce noise by tuning alert thresholds and rules.
Challenge: Lack of visibility
- Problem: Siloed monitoring tools can create blind spots, leaving gaps in visibility across the entire IT infrastructure.
- Solution: Implement a unified observability platform or a set of integrated tools that provide a single pane of glass for all monitoring data.
Challenge: Static monitoring
- Problem: Traditional, static monitoring approaches fail to keep up with dynamic, cloud-based, and containerized environments.
- Solution: Adopt modern monitoring techniques that are designed for dynamic environments, such as AIOps (Artificial Intelligence for IT Operations)
The Future of Synthetic Monitoring in CI/CD
The future of synthetic monitoring in CI/CD involves its deeper integration, driven by AI/ML, to proactively identify and prevent issues before they reach production. This includes using AI for predictive analytics, optimizing test suites to run faster and more efficiently, and ensuring the right tests are run at the right time to maintain pipeline speed while protecting user experience.
Dotcom-Monitor for CI/CD Pipelines
Dotcom-Monitor leads with its tool called the Every Step Web Recorder, which lets teams record and create synthetic monitoring scripts (like simulating user actions on a website, logging in, clicking buttons, etc.) without needing to code. These scripts can then be integrated directly into DevOps tools such as Jenkins, GitHub Actions, GitLab, or Azure DevOps, allowing automated checks every time new code is released. Visit the synthetic monitoring platform page to explore full CI/CD integration options and request a trial.
Conclusion
CI/CD pipelines (which automate software builds and deployments) have made development much faster—but speed alone isn’t enough. If teams deploy quickly without testing real user experiences, they risk releasing broken features. That’s where synthetic monitoring comes in. It adds automated, user-focused tests directly into the release process, checking if apps work properly before, during, and after deployment.
The idea is
- Run tests in staging before deployment.
- Validate again right after release in production.
- Continue with scheduled regression tests to ensure stability over time.
When synthetic monitoring tools integrate smoothly into CI/CD pipelines, testing becomes part of the normal workflow—ensuring every release is fast, functional, and reliable.
Ready to experience seamless CI/CD monitoring in action?
With Dotcom-Monitor, you can integrate synthetic checks, automate pre-release testing, and validate every deployment — all without complex setup.
And see how effortless performance and reliability can be.
