
Here’s how most SharePoint outages get discovered: a help desk ticket. Someone in finance can’t open a document library, three more tickets follow, and by the time the admin team confirms the problem, half the company has already hit it.
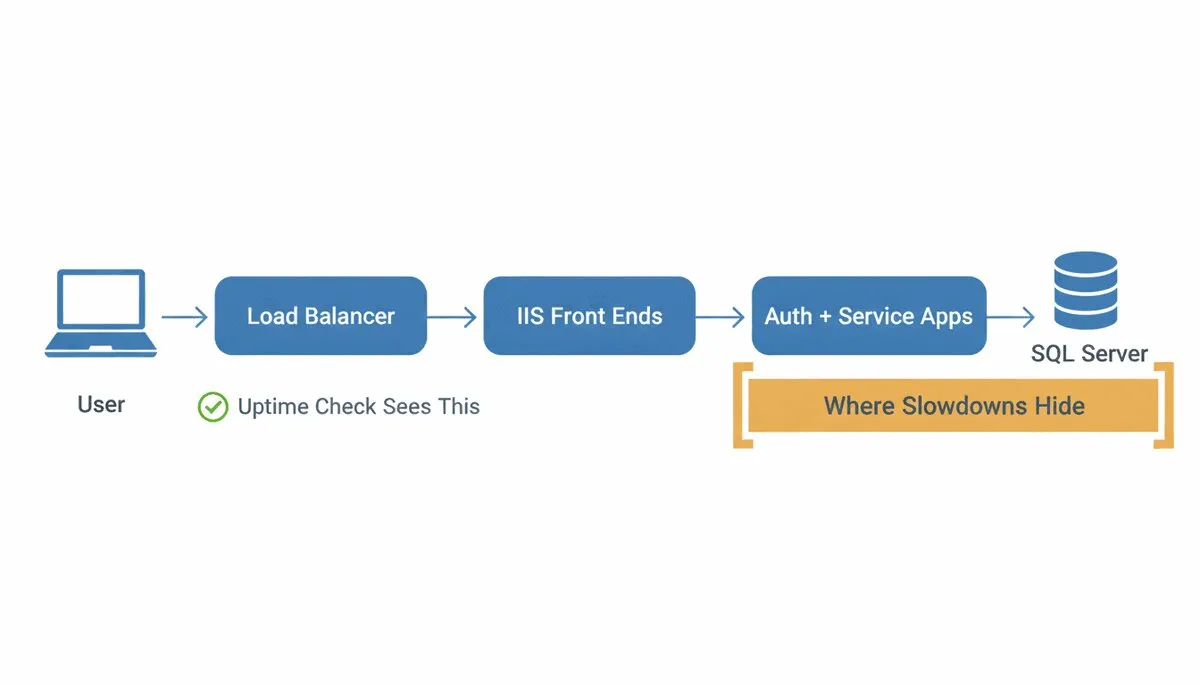
The farm’s servers were probably “up” the whole time. That’s the trap with SharePoint Server. A single page load crosses IIS front ends, the authentication chain, service applications, and SQL Server. Any one of those layers can degrade while every basic uptime check stays green.
This guide covers what to actually monitor on a SharePoint farm, where the built-in tools stop, how to set alerts that fire before the first ticket, and how to turn monitoring data into an SLA report your management will accept.
Why SharePoint Problems Reach the Help Desk Before They Reach You
Ping and port checks answer one question: is the server reachable? SharePoint fails in ways that question never touches.
Consider a Monday morning login storm. Hundreds of employees authenticate at 9 a.m., the ADFS servers fall behind, and logins that normally take two seconds take forty. Every server answers ping. IIS returns 200s. But nobody can get into the intranet, and the tickets start.
Or the slower version: disk latency on the SQL volume holding your largest content database creeps up over a month. Page loads go from one second to four. No threshold trips, because nothing was watching the number that moved.
The pattern is the same in both cases. The failing layer sits between “server is up” and “user got their document,” and that middle territory is exactly what SharePoint server monitoring has to cover.
What to Monitor on a SharePoint Server Farm
You don’t need hundreds of counters. You need the short list that predicts user pain, watched consistently.
| Layer | What to Watch | Why |
|---|---|---|
| IIS front ends | Request queue length, 5xx rate, CPU and memory, app pool recycles | Queued requests are the earliest sign the farm can’t keep up with load. |
| SQL Server | Disk read/write latency on content database volumes, blocking waits, transaction log growth | Nearly every SharePoint operation ends in SQL. Slow disks here slow everything. |
| Search | Crawl freshness, crawl queue backlog, query latency | Stale or slow search is one of the most-reported SharePoint complaints, and it degrades silently. |
| Timer jobs | Failed job count, last run time on critical jobs | Failed timer jobs quietly break workflows, profile syncs, and usage reporting. |
| Distributed Cache | Cache host status on each server running it, AppFabric service health | Login tokens and feeds live here, and one bad cache host causes farm-wide symptoms that are hard to trace. |
| Authentication | Login round-trip time through AD, ADFS, or Entra ID | Auth is a farm-wide single point of failure that server counters barely reflect. |
| User experience | Login time, page load on key site collections, search response, document upload/download | These are what users feel, and the terms your SLA is written in. |
The last row is the one most SharePoint monitoring setups skip. Server counters tell you a component is stressed. Only a check that behaves like a user, logging in, opening a library, running a search, tells you whether the farm is actually delivering. Depending on the farm, also watch service application pools and, if legacy workflows are still in use, Workflow Manager.
Set a baseline for each metric during a normal week before you set any thresholds. A 70% CPU reading means nothing until you know whether normal is 40% or 65%.
What the Built-In Tools Catch (And What They Miss)
SharePoint Server ships with real monitoring machinery, and you should use it. Microsoft’s monitoring documentation covers three main pieces:
- Health Analyzer runs rule-based checks against farm configuration and known failure conditions, and can self-repair some of them.
- Diagnostic (ULS) logging writes detailed trace logs you’ll want during any root-cause hunt.
- Usage and health data collection gathers request and service statistics into the usage and logging database.
Teams running System Center can add the SharePoint management pack and get event-driven alerts on top.
But notice what all of these have in common: they run inside the farm and report on the farm. None of them can tell you that the load balancer is sending users to a dead node, that the certificate on the ADFS endpoint expired, or that page loads take nine seconds from the branch office. Health Analyzer rules also run on schedules, some daily or weekly, so a problem can sit undetected between runs.
The built-in tools are the inside half of a monitoring strategy. The outside half has to come from checks that approach SharePoint the way users do.
How to Monitor What Users Actually Experience
The outside half is synthetic monitoring: scripted checks that run on a schedule and perform real SharePoint tasks. A useful script for a SharePoint farm does four things:
- Step 1: Log in. Use a dedicated monitoring account with least-privilege access. Time the full authentication round trip, including any SSO redirects.
- Step 2: Load a page. Open your busiest site collection or the intranet home page and record the load time in a real browser, not just the HTML response.
- Step 3: Run a search. Query a term that should return a known document, and fail the check if it doesn’t. This catches index lag that a server-side view won’t flag as a user problem.
- Step 4: Touch a document. Open or download a test file from a library to validate the full path through IIS, permissions, and SQL.
With Dotcom-Monitor, this is a web application monitoring task recorded once with EveryStep scripting and replayed from wherever your users are. For an internet-facing or hybrid deployment, that means external nodes in your users’ regions. For an intranet-only farm behind the firewall, private agents run the same scripted checks from inside your network, so an on-premises deployment doesn’t exempt the farm from user-level monitoring.
Authentication deserves planning rather than avoidance. If you’re on Entra ID (formerly Azure AD), give the monitoring account its own conditional access policy that swaps MFA for an allowlisted monitoring IP range. Wherever the account lives, store its credentials in a vault and rotate them on your normal schedule. If your farm authenticates through ADFS or Entra ID, the login step doubles as a health check on that whole chain. We cover the setup details in monitoring applications that use ADFS.
And if part of your estate lives in Microsoft 365, the same scripted approach applies there. Our guide to Office 365 synthetic monitoring walks through it. You can’t see Microsoft’s servers, which makes the user-level check the only measurement of SharePoint Online you own.
How to Set Alerts That Beat the First Ticket
The goal is a specific race: your alert has to arrive before the first help desk ticket. Three practices decide it.
Alert on the user-facing number, diagnose with the server number. Page the on-call when login time triples or the search check fails, because that’s what generates tickets. Let the CPU and disk metrics annotate the alert rather than drive it. Server-counter paging is how teams end up ignoring their own alerts. Two starting rules that work: page when login time runs double its baseline for two consecutive checks, and page when the search check misses its known result.
Verify before you wake anyone. A check that fails once from one location might be a network blip. A check that fails from two locations, or twice in a row, is an incident. Most alert fatigue traces back to skipping this step. Dotcom-Monitor does the re-check from a second location automatically before an alert goes out.
Match frequency to the SLA math. If you’re accountable for 99.9% uptime, you get about 43 minutes of downtime per month. A check that runs every 15 minutes can burn a third of that budget before it fires once. Run user-level checks every one to five minutes on the flows that matter, and schedule maintenance windows in the monitoring tool so patch nights don’t page anyone or pollute the uptime record.
How to Report SharePoint Uptime Against Your SLA
Most SharePoint teams answer to an SLA, whether it’s a contractual commitment or an internal promise to the business. The monitoring setup above produces the evidence: a timestamped record of every check, every failure, and every response time, independent of the farm’s own logs.
That independence matters. When the farm’s logs say “healthy” and users say “slow,” a third record measured from the user’s side settles the argument. It also gives you something Microsoft’s service dashboards never will for hybrid environments: one continuous uptime number across on-premises and cloud.
A monthly SLA report needs three things: measured uptime against the target, response-time trends on the user flows you script, and a list of incidents with duration and root cause. Uptime and SLA reports generate the first two directly from check history, scheduled to whoever needs them. The trend line earns its keep between incidents. A page load drifting from one second to three over a quarter is an early capacity warning you can act on before it becomes a ticket flood.
Which SharePoint Monitoring Tool Fits Your Environment
Different tools watch different halves of the problem, so the honest comparison is by vantage point.
Built-in tools (free). Health Analyzer, ULS logs, and usage data collection. Use them regardless of what else you buy. They configure the farm correctly and support root-cause work, but they won’t alert you in real time or measure user experience.
Agent-based infrastructure monitors. ManageEngine Applications Manager and SolarWinds Server & Application Monitor both ship SharePoint templates that collect farm counters: database sizes, timer job failures, IIS and SQL health, requests per second. PRTG covers similar ground with pre-built sensors for Windows, IIS, and SQL, extendable with custom scripts. Strong choices for the server-side rows of the table above, and if you already run one for your Windows estate, point it at the farm. In System Center shops, SCOM with the SharePoint management pack covers the same ground.
Synthetic monitoring platforms. Dotcom-Monitor works from the user’s side: scripted logins, page loads, searches, and document transactions from external nodes or private agents, with alerting and SLA reporting built on those checks. This is the layer that wins the race against the first ticket, catches what agent-based tools structurally can’t, and for SharePoint Online it’s the only layer available at all.
Most teams that get this right end up pairing an inside tool with an outside one. What matters is that both halves exist, because each one’s blind spot is the other’s core coverage.
The Bottom Line
SharePoint server monitoring works when it covers both halves: farm metrics that explain problems, and user-level checks that detect them. Watch the short list of counters that predict pain, script the four user actions that matter, alert on what users feel with verification built in, and let the check history double as your SLA report.