Choosing the right infrastructure and synthetic monitoring tools is no longer just about checking an uptime box; it is about closing the visibility gap between your backend health and the actual end-user experience. In a modern DevOps environment, a failure in your DNS routing or a latent 3rd-party API can be just as catastrophic as a server crash, yet these “outside-in” issues often go undetected by traditional internal monitors.
This guide evaluates the 12 best infrastructure and synthetic monitoring tools, specifically curated for technical teams who need to reduce MTTR (Mean Time to Resolution) and eliminate “blind spots” in their production stack.
Synthetic vs. Infrastructure Monitoring
For a foundational definition before you compare tools, read our complete guide on what is synthetic monitoring. While synthetic monitoring validates functional workflows from global locations, infrastructure monitoring provides the granular telemetry needed to diagnose the hardware and network faults that cause those workflows to fail.
| Monitoring Type | What It Does | Key Use Cases & Advantages |
| Synthetic Monitoring | Mimics user actions, scripted workflows, and scheduled API calls | Catches broken flows & slowdowns. Benchmarking across locations. Uptime/transaction health |
| Infrastructure Monitoring | Tracks: servers, network devices, services (DNS, TCP/UDP, ping, etc.), & resource metrics | Detects: backend & protocol-level faults, service outages, and resource saturation |
Comparing Top 12 Infrastructure and Synthetic Monitoring Tools
If you’re focused specifically on the synthetic side, our guide to the best synthetic monitoring solutions digs deeper into scripting capabilities and user journey coverage.
| Tool | Synthetic | Infrastructure | Highlights | Trade-offs |
| Dynatrace | ✅ | ✅ | AI-driven observability, linking user flows and backend metrics | Complex. Cost may scale quickly |
| Dotcom-Monitor | ✅ | ✅ | Synthetic and service monitoring in one platform | Avoids tool fragmentation. Offers modular scaling |
| New Relic | ✅ | ✅ | Scripted synthetic workflows. Strong observability | Pricey. Has a learning curve |
| Datadog | ✅ | ✅ | Full view from UI, infrastructure, logs, to metrics | Expensive at a large scale |
| Site24x7 | ✅ | ✅ | All-in-one: web, server, network, cloud, synthetic & infra coverage | Depth may be lower in some modules |
| Pingdom | ✅ | – | Reliable in uptime, transaction, & page load monitoring | Lacks deep infrastructure & protocol-level checks |
| Checkly | ✅ | – | JS/Playwright scripting for synthetic workflows | Requires scripting expertise. No built-in infra checks |
| Zabbix | – | ✅ | High-versatility platform for hybrid estates (SNMP, IPMI, JMX, & Agents). | UI-heavy management; scaling requires significant database tuning. |
| Nagios | – | ✅ | Legendary stability for static/legacy environments with a massive plugin library. | High configuration “toil”; dated UI and lacks native time-series graphing. |
| Prometheus | – | ✅ | The CNCF standard for K8s-native metrics and multidimensional labeling. | Requires external storage (Thanos/Cortex) and extra tools for logs/synthetics. |
| SolarWinds Network Performance Monitor (NPM) | – | ✅ | Excellent network path, hop, device-level, SNMP, flow analysis | Less focus on synthetic monitoring |
| LogicMonitor, ManageEngine OpManager | – or Hybrid | ✅ | Infrastructure, network, systems monitoring with some synthetic or integration features | Weak Synthetic monitoring, add-ons are required. |
1. Dynatrace

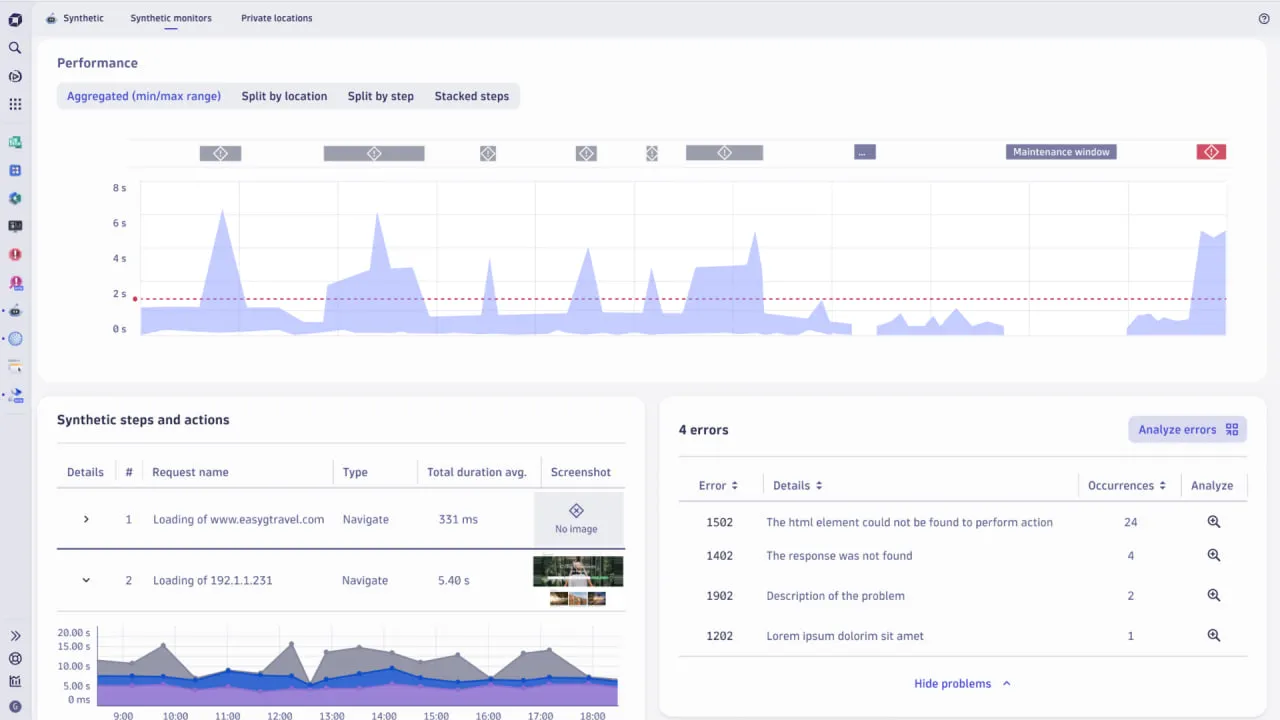
Dynatrace is a solution that combines features like synthetic monitoring, real user monitoring, infrastructure and application metrics, and automatic root-cause analysis. Its OneAgent architecture collects analytics through contextual analytics, AI, and automation.
Key Benefits
- AI‑driven anomaly detection and analysis;
- Correlation of synthetic checks with infrastructure traces;
- Full-stack coverage, including global synthetic monitoring;
- Good for hybrid, cloud, and complex enterprise environments.
Best For: Massive Enterprise Complexity & Automated Root-Cause.
Real-Life Scenario: Your bank is migrating a legacy monolith to a hybrid-cloud microservices architecture. A single “transfer money” request now touches 50+ services across AWS and an on-prem data center.
The Fix: You deploy the OneAgent. When transaction latency spikes, Dynatrace’s AI (Davis) automatically maps the topology and tells you: “The delay is not in the code; it’s a specific database lock in the on-prem SQL cluster causing a cascade.”
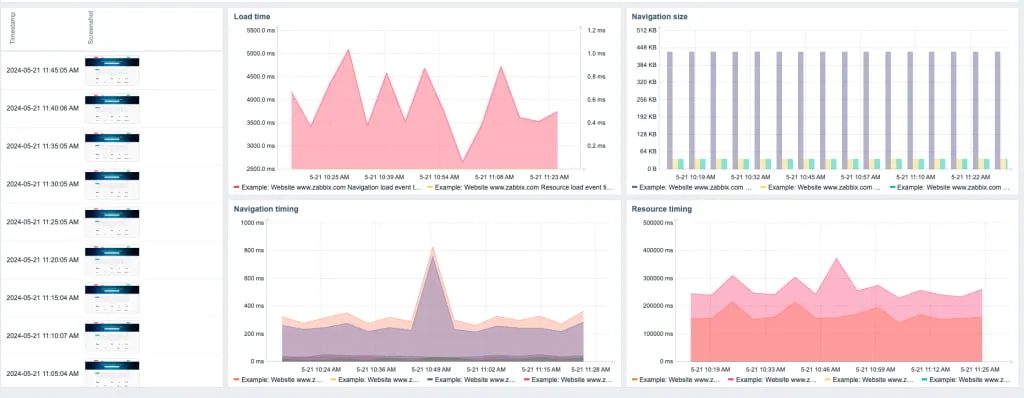
2. Dotcom‑Monitor

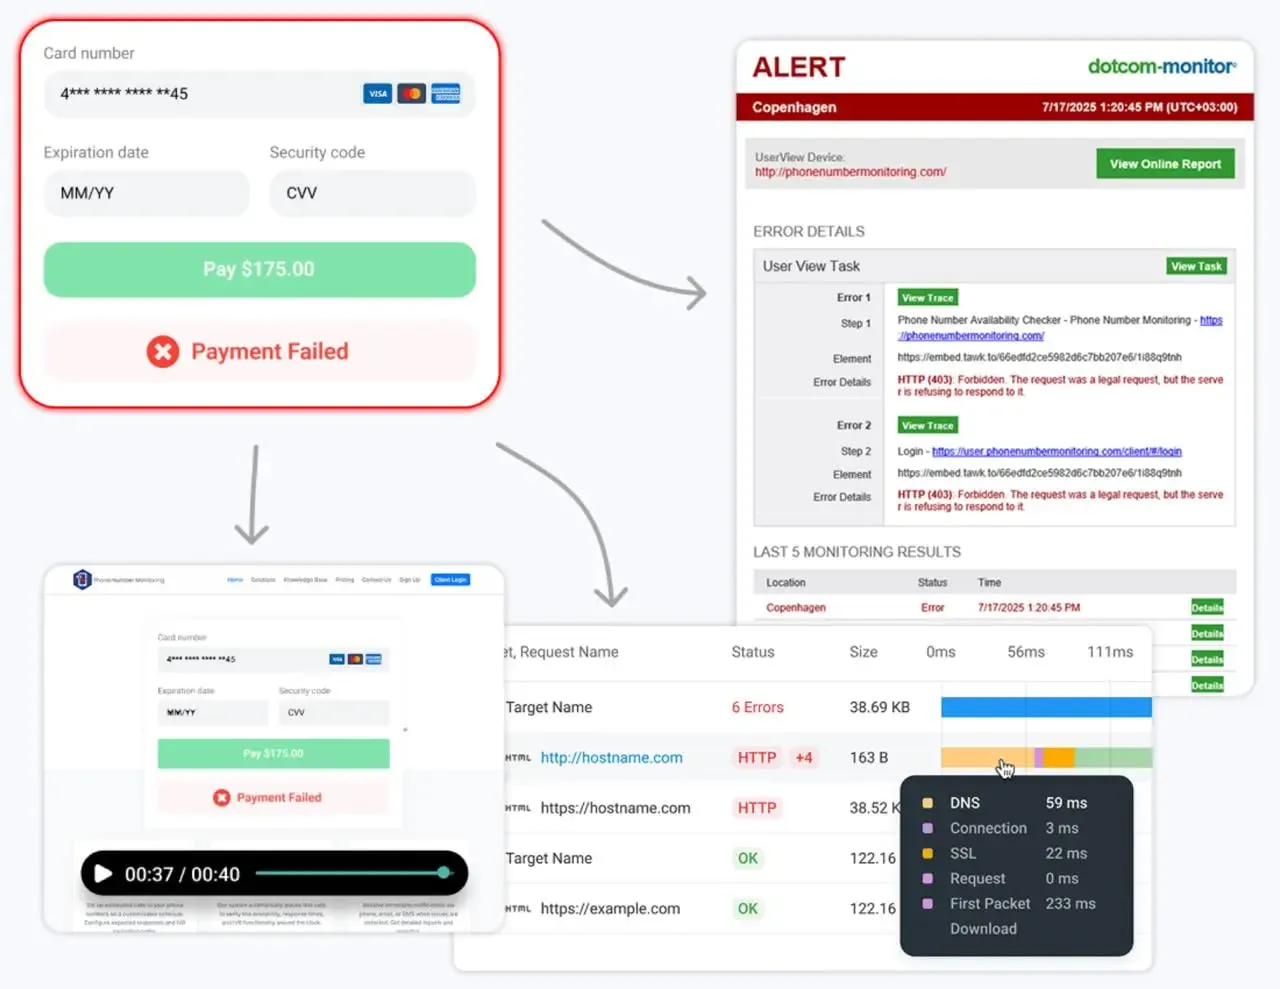
Dotcom-Monitor is a unified platform offering both synthetic monitoring (web performance, scripted flows, API checks) and infrastructure monitoring (DNS, FTP, ICMP, UDP, TCP port checks, VoIP). It also integrates server and device monitoring via its ServerView module for complete visibility with just one interface.
Key Benefits
- Finds underlying anomalies by stimulating user interactions;
- Multi-location checks to improve user experience and infrastructure;
- Everything under a unified dashboard without switching tools;
- Modular approach—enable infrastructure modules as needed;
- Reduces operational overhead, like managing multiple tools.
Best For: Global User-Experience & Multi-Protocol Reliability.
Real-Life Scenario: You run a high-traffic e-commerce platform with a global customer base. You’ve had several incidents where the site was “up” according to internal metrics, but customers in Europe couldn’t complete checkouts due to regional DNS latency or a third-party payment gateway timing out.
The Fix: You use Dotcom-Monitor to run real-browser synthetic flows from 30+ global locations every 5 minutes. When a regional ISP in London has a routing issue, you get an alert with a waterfall chart showing the exact 404 or 500 error before your helpdesk is flooded with tickets.
Ready to see it in action?
Explore the full synthetic monitoring solution and start a free trial.
3. New Relic

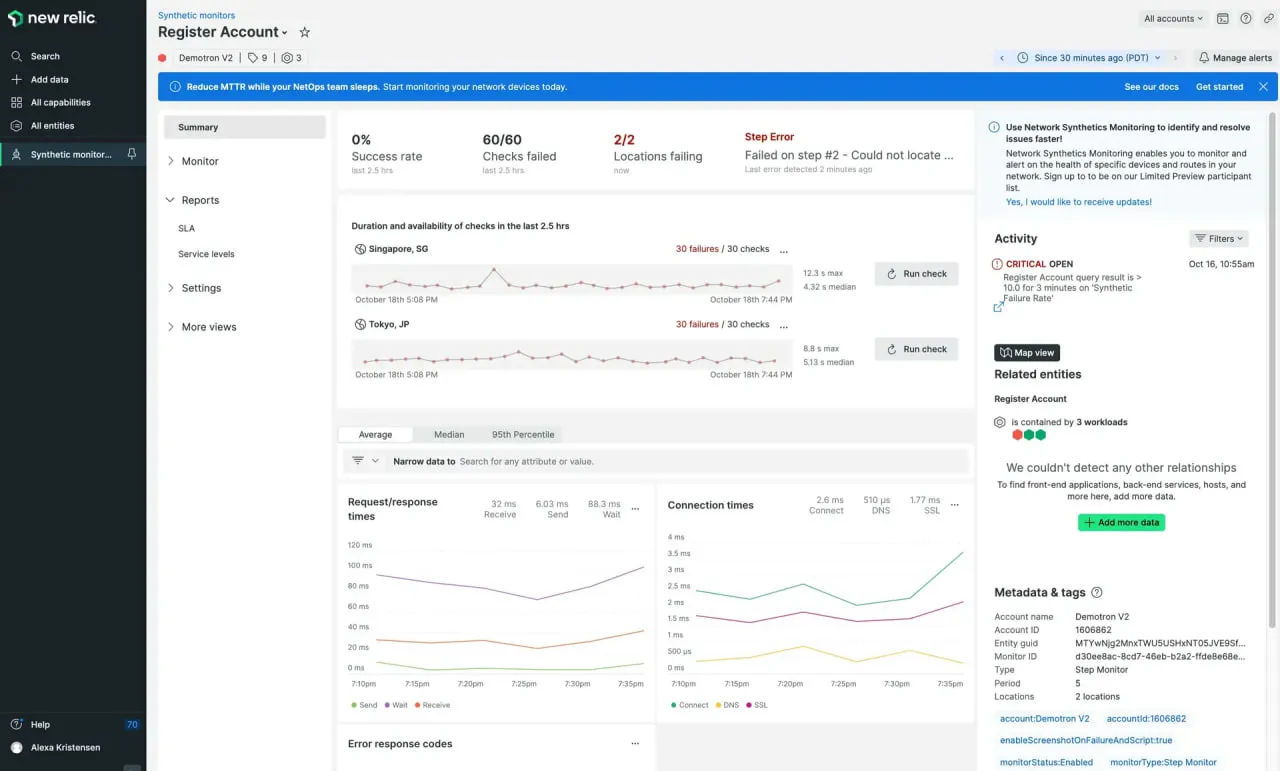
New Relic lets you write browser and API workflow scripts, then tie those results into its observability stack (APM, infrastructure, logs). It’s designed for teams that want everything in one ecosystem.
Key Benefits
- Rich scripting flexibility for complex user flows;
- Strong integration with backend metrics and logs;
- Unified dashboards and alert system;
- Good support and ecosystem.
Best For: Deep Application Debugging & Code-Level Optimization.
Real-Life Scenario: After a major Friday afternoon deployment, your API’s response time doubles. The logs show everything is “OK,” but the users are complaining.
The Fix: You use New Relic APM to drill down into a “Transaction Trace.” It reveals that a new regular expression in line 402 of your Python controller is causing CPU spikes—allowing you to revert and fix the specific line of code within minutes.
4. Datadog

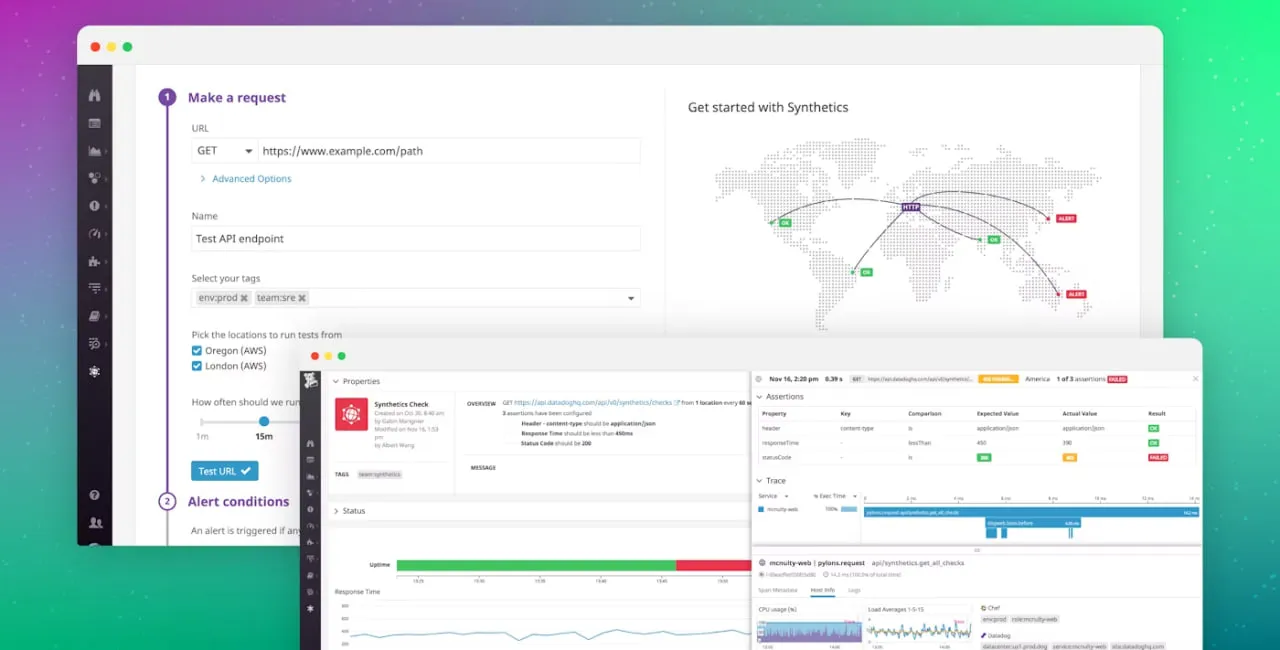
Datadog has an integrative approach that combines synthetic monitoring with metric collection, logs, tracing, and infrastructure health. So this somewhat provides you with an all-in-one solution.
Key Benefits
- Unified correlation across synthetic, infrastructure, and logs;
- Custom dashboard and visualizations;
- Broad integrations across cloud services, containers, databases, etc.;
- Can be scaled for large systems.
Best For: High-Velocity Cloud-Native Teams.
Real-Life Scenario: You manage a fleet of 500+ Kubernetes microservices that scale up and down 20 times a day. You need to know if a specific “Canary” deployment is causing errors in a downstream service.
The Fix: You use Service Maps and Log Correlation. When a pod crashes, you click the error in your dashboard and instantly see the specific logs and traces for that exact container, filtered by the “version” tag.
5. Site24x7

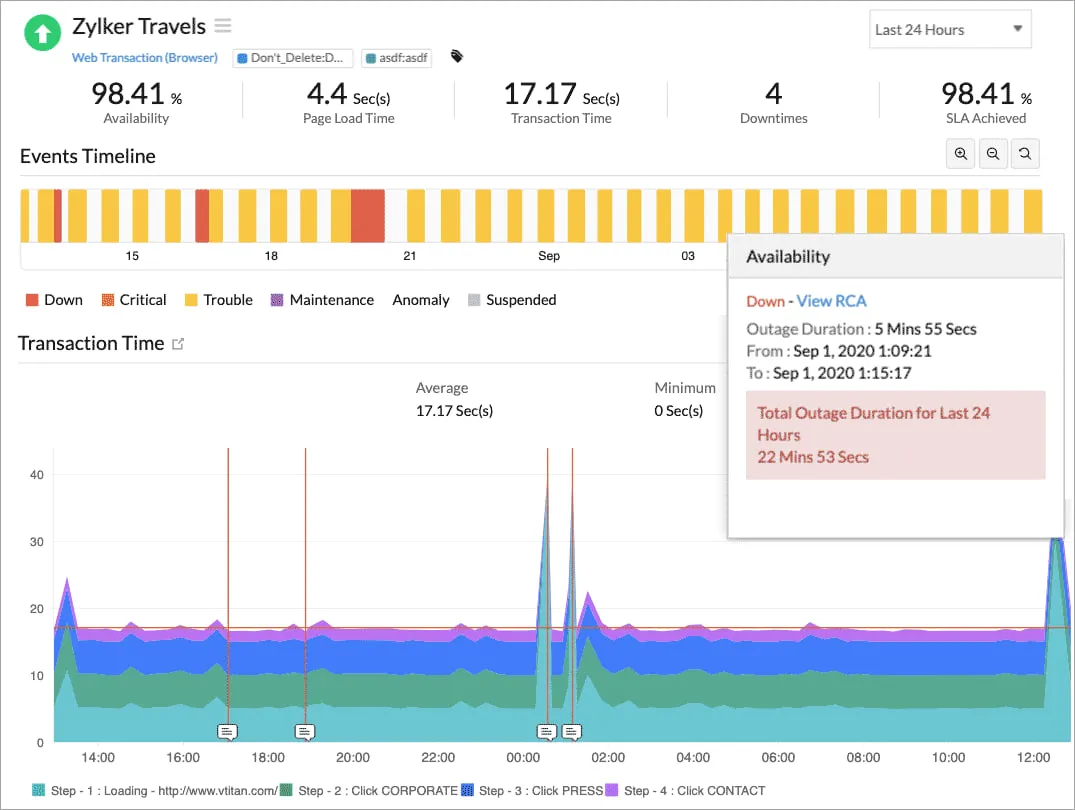
Site24x7 covers synthetic user flows, server and network monitoring, cloud infrastructure, applications, and more. For small and medium teams this is a good tool offering full coverage.
Key Benefits
- Monitoring for web, server, network, applications;
- Infrastructure protocol support;
- Easy and step-by-step learning;
- Flexible pricing and good value for money.
Best For: Budget-Conscious Teams Needing “All-in-One” Basics.
Real-Life Scenario: You’re the sole DevOps engineer at a 50-person startup. You need to monitor your website, your office’s VPN router, and your AWS bill on a limited budget.
The Fix: You use Site24x7 to set up basic uptime pings and a Server Agent on your Linux boxes. It’s a “set it and forget it” tool that gives you 80% of the visibility of expensive tools at 20% of the cost.
6. Pingdom

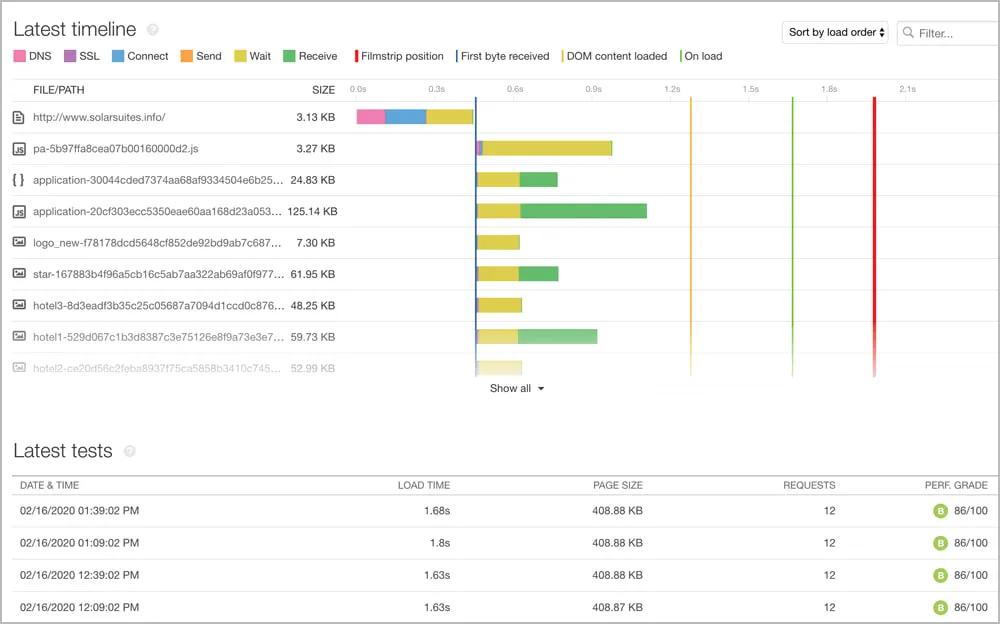
Pingdom is a web-based synthetic monitoring tool. Its features include page load measurements and user journey simulations from multiple locations. It’s a great choice for anyone who’s focus is web monitoring.
Key Benefits
- Fast configuration and deployment;
- Multiple location checks for regional issue detection;
- Multi-step monitoring support;
- Real-time alerts and performance reporting.
Best For: Marketing & Business Stakeholders.
Real-Life Scenario: Your CMO wants a simple “Public Status Page” to show customers that the site is reliable.
The Fix: You set up a simple Pingdom Check. It’s low-cost and high-reliability. When the site goes down, it triggers a “Status Page” update that keeps your users informed without exposing your internal complex SRE dashboards.
7. Checkly

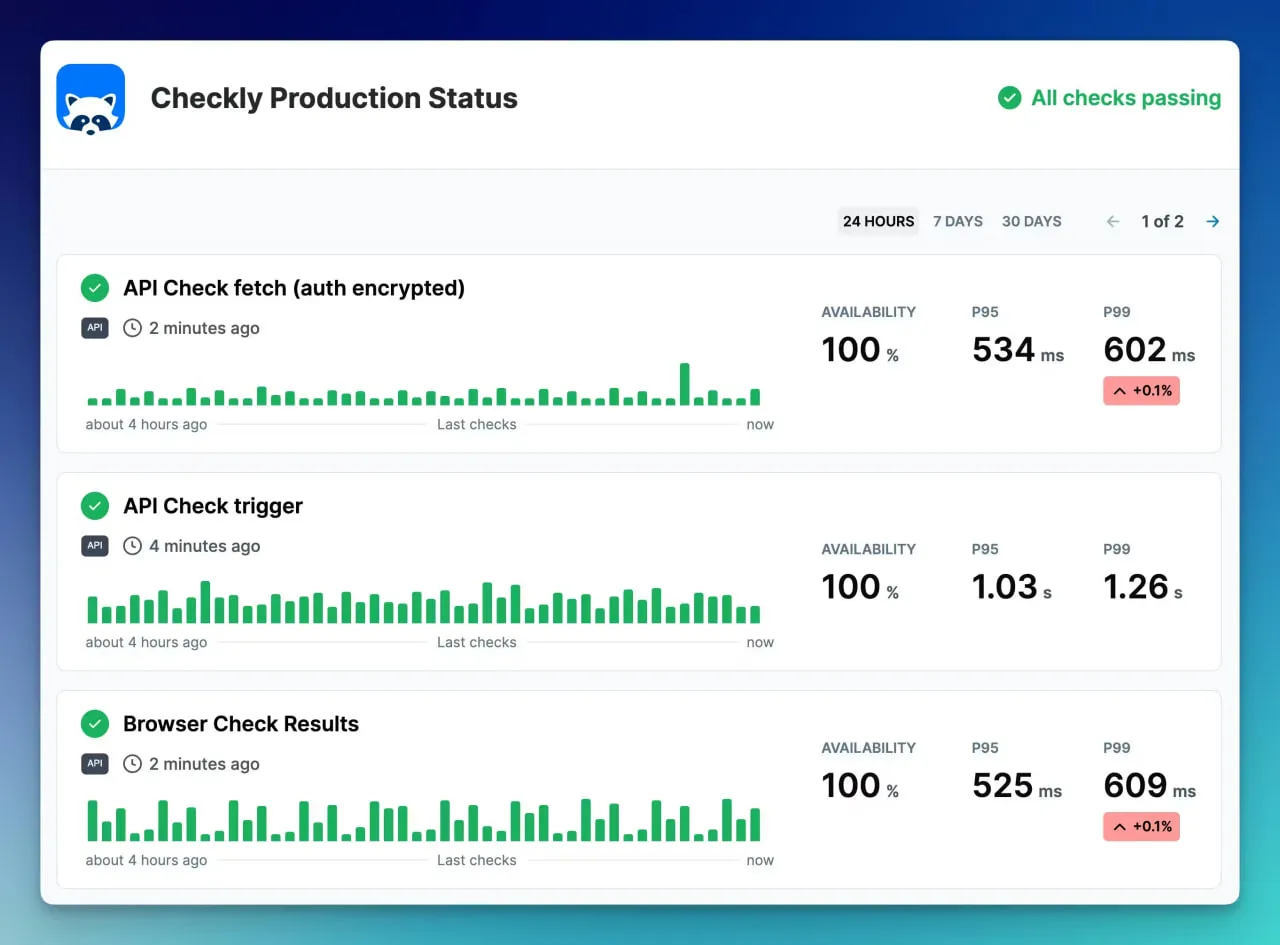
Checkly is for developers as it emphasizes JavaScript and Playwright scripting to define checks. This makes it ideal for people who know how to code.
Key Benefits
- Highly customizable synthetic checks via code;
- Easily integrates into CI/CD pipelines;
- Good for API and browser-based monitoring;
- Lightweight, modern UI and developer tools orientation.
Best For: Modern Frontend & QA Engineering (Playwright-First).
Real-Life Scenario: Your team is moving toward a “You build it, you run it” model. Your developers already use Playwright for local testing and want to use those same scripts to monitor production.
The Fix: You integrate Checkly into your GitHub Actions. Every time a PR is merged, Checkly automatically updates your production “Heartbeat” monitors using the exact same code your developers wrote for testing.
8. Prometheus
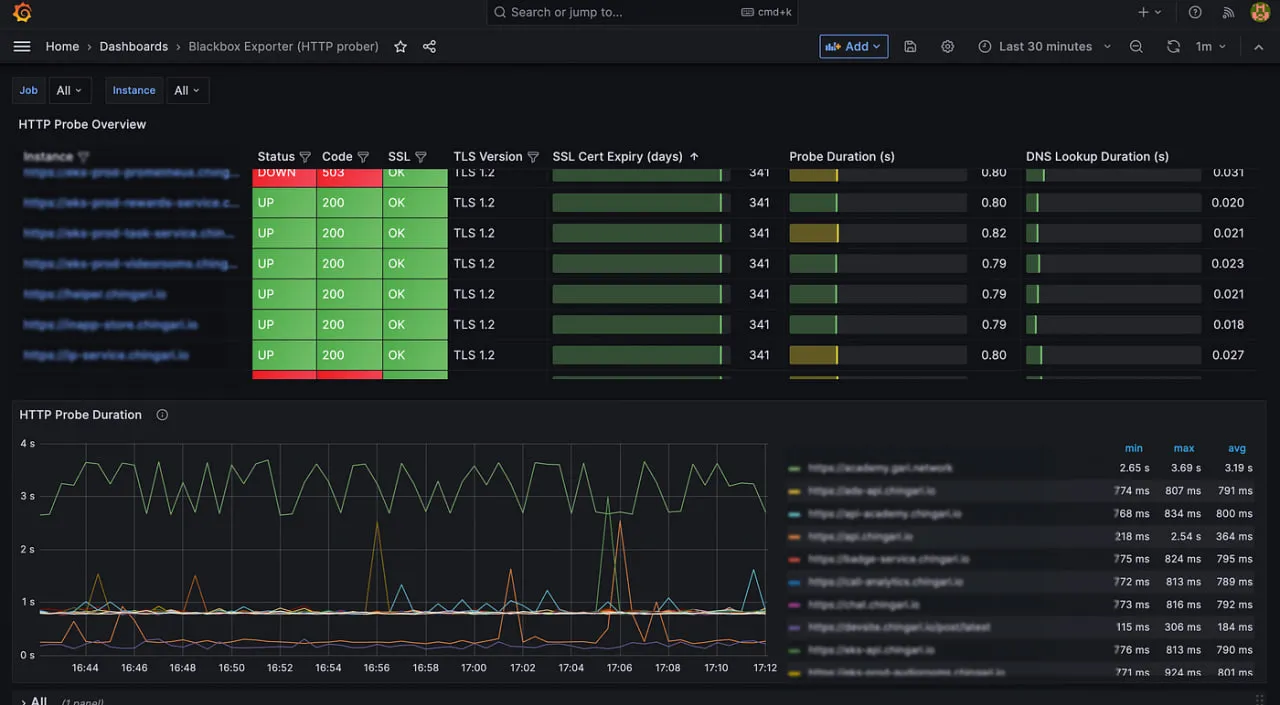
Prometheus is the CNCF-graduated “gold standard” for cloud-native monitoring. It pioneered the pull-based metrics model and the use of multi-dimensional labels, which are essential for tracking ephemeral Kubernetes pods.
Key Benefits
- Seamless auto-discovery for Kubernetes services and containers.
- A powerful query language designed for math-heavy operations (e.g., calculating 99th percentile latency).
- Each server is self-contained with no external database dependency, making it resilient during outages.
Best For: Kubernetes & Microservices Auto-scaling.
Real-Life Scenario: You are running a retail API on EKS (Amazon Kubernetes Service). During a “Flash Sale,” your HPA (Horizontal Pod Autoscaler) spins up 200 new pods.
The Fix: Prometheus automatically discovers these pods via the Kubernetes API, scrapes their metrics instantly, and alerts you if the p99 latency across the entire fleet exceeds 200ms—without you ever manually adding a single IP address to a config file.
9. Zabbix
Zabbix is the “Swiss Army Knife” of infrastructure monitoring. It is a centralized, enterprise-ready platform that excels at monitoring “mixed estates”—where you have a mix of modern Linux servers, legacy Windows boxes, and physical network gear.
Key Benefits
- Zabbix includes dashboards, alerting, and reporting in a single native web interface.
- First-class support for physical hardware (routers, switches, and even server room thermometers).
- If you can write a script for it (Python, Bash, Go), Zabbix can monitor it.
Best For: Hybrid Infrastructure & Diverse Network Estates.
Real-Life Scenario: You manage a university network. You need to monitor 500 Virtual Machines, 200 Cisco Switches, and the temperature of three different data centers.
The Fix: You use Zabbix with Active Agents for the VMs and SNMP for the switches. You build a “Network Map” in the Zabbix UI that turns red if a core switch goes down, allowing you to see exactly which servers are isolated by the hardware failure.
10. Nagios (Core & XI)
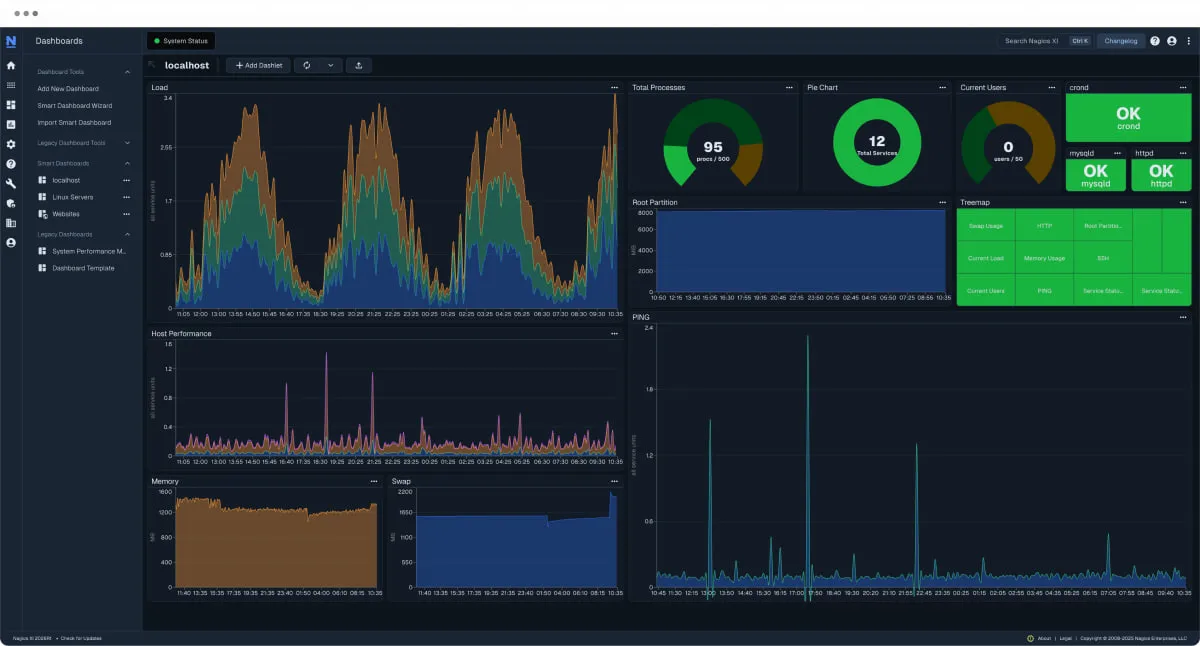
The “Grandfather” of monitoring. Nagios is built on a simple “Plugin” architecture—it executes a script, looks at the exit code (0, 1, 2), and alerts accordingly. It is legendary for its stability but criticized for its 1990s-era interface and configuration friction.
Key Benefits
- If it exists in a data center, someone has already written a Nagios plugin for it over the last 25 years.
- The core engine is incredibly lightweight and can run on minimal hardware.
- It follows a simple “Check -> Result -> Alert” flow that is easy to troubleshoot.
Best For: Stable, Legacy, or “Static” Environments.
Real-Life Scenario: You manage a series of mission-critical “Air-Gapped” servers in a secure facility. These servers never change, they don’t autoscale, and they must remain up 24/7/365.
The Fix: You use Nagios Core. It is rock-solid and won’t break during an update. You use a simple check_disk and check_ssh plugin. It sends a single, reliable email the moment a hardware raid fails, and it does so with zero “SaaS” or cloud dependencies.
11. SolarWinds NPM

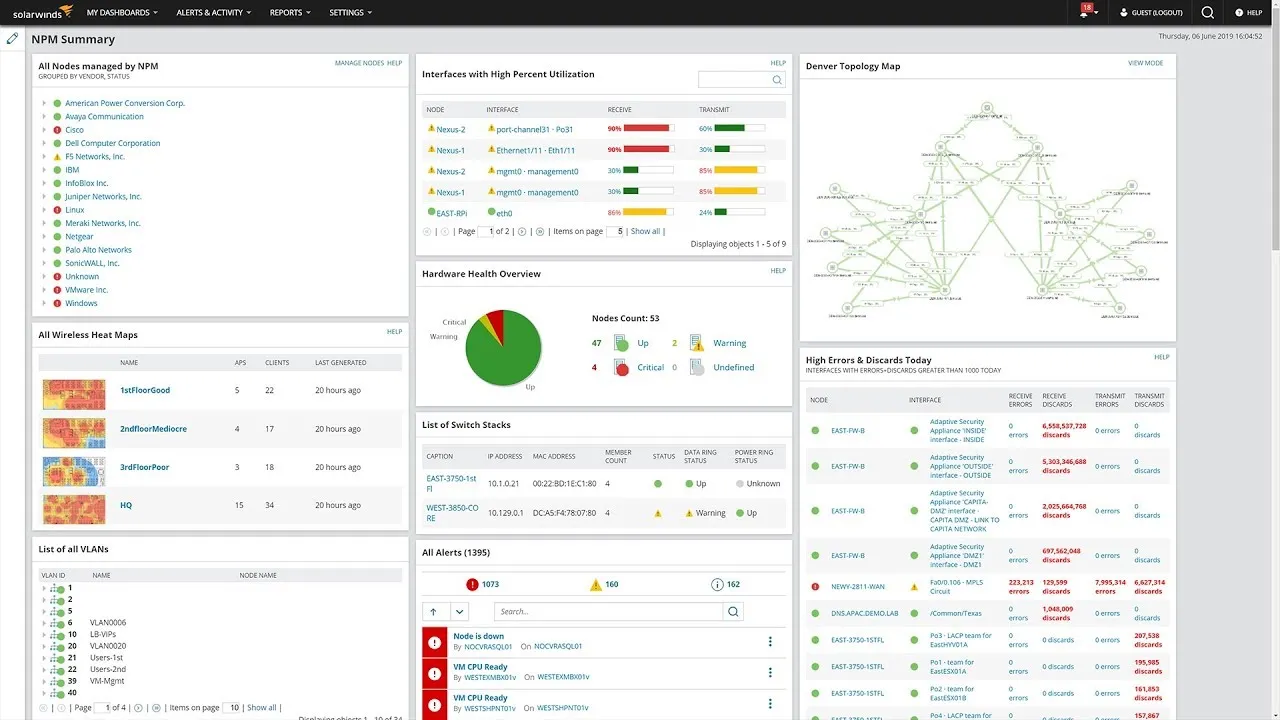
SolarWinds Network Performance Monitor (NPM) specializes in network device and path-level monitoring. It tracks reachability, hop latency, device health, interface traffic, SNMP metrics, and network topology.
Key Benefits
- Exceptional network path, hop, and interface visibility;
- SNMP and NetFlow support, device-level metrics;
- Insights into network bottlenecks and topology issues;
- Strong diagnostics for network-related outages.
Best For: Network Administrators & Physical Infrastructure.
Real-Life Scenario: Users are complaining that “the internet is slow.” You suspect a hardware issue in the server room or a bad fiber hop between your offices.
The Fix: You use NetPath. It shows you a hop-by-hop map of the network path. You see a 200ms latency spike at a specific Cisco router in your Dallas branch, confirming it’s a hardware bottleneck, not a software bug.
12. LogicMonitor / ManageEngine OpManager
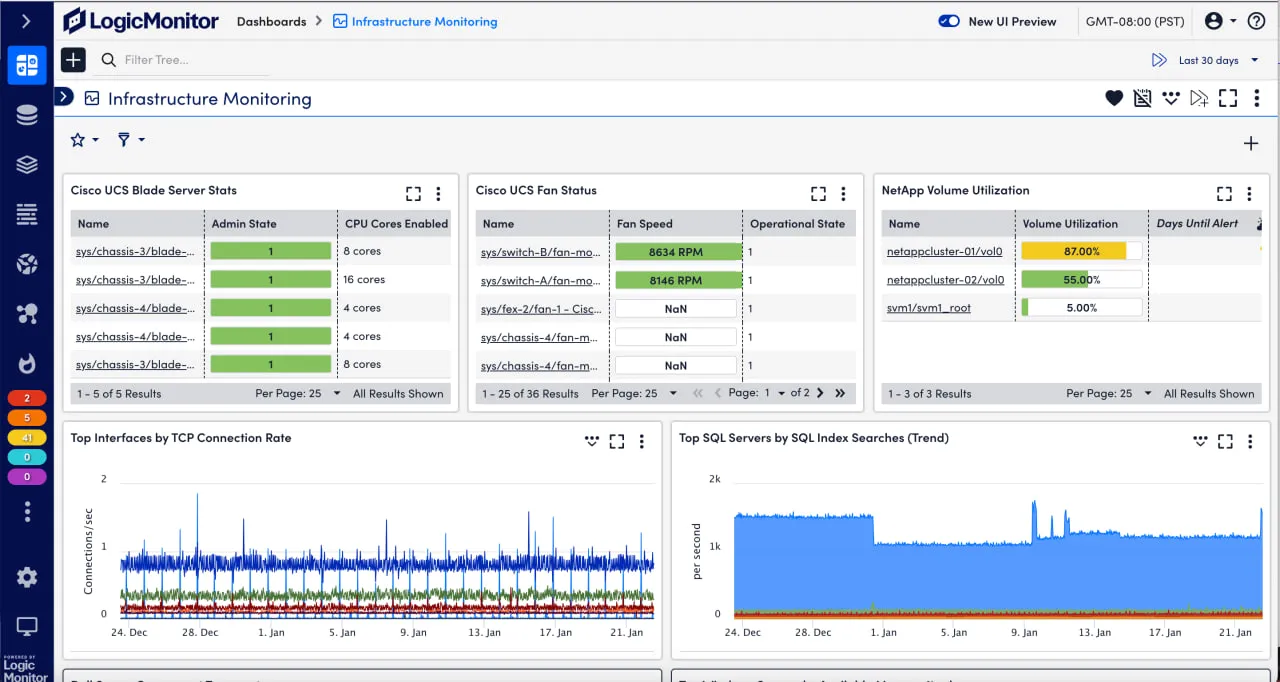 LogicMonitor and ManageEngine are tools for monitoring enterprise-level infrastructure, featuring synthetic modules and user-experience integrations. They are good for device, server, VM, and app monitoring.
Key Benefits
- Broad servers, network, & application infrastructure;
- Prebuilt integration and automation convenience;
- PErfect dashboard for enterprise operations;
- Some options for synthetic modules integration.
Best For: Hybrid IT & Managed Service Providers (MSPs).
Real-Life Scenario: You manage IT for a company with 10 global offices, each with its own local servers, NetApp storage, and VMware clusters, all connected to Azure.
The Fix: You use LogicMonitor’s Collector architecture. It automatically discovers all 2,000+ devices on your network and builds an “Enterprise Dashboard” that shows the health of your physical storage, virtual machines, and cloud instances in one view.
How to Choose Your Monitoring Stack?
Selecting a monitoring suite is less about “finding the best tool” and more about minimizing the gap between an incident and its resolution. For a modern DevOps or SRE team, the decision-making process should prioritize the following:
1. Evaluate Coverage vs. Tool Sprawl
Ask whether your team can realistically manage a “best-of-breed” stack (e.g., Prometheus for metrics, Checkly for scripts, and SolarWinds for network). While specialized, this often leads to “data silos.” Unified platforms like Dotcom-Monitor or Datadog reduce context-switching during high-pressure outages by correlating synthetic failures directly with infrastructure health.
2. Prioritize Automation and IaC Support
In a cloud-native environment, manual configuration is a liability. Ensure your chosen tool supports Terraform, Pulumi, or a comprehensive CLI. If you cannot provision a synthetic check as part of a service deployment, the tool will eventually become a bottleneck for your engineering velocity.
3. Assess Signal-to-Noise Ratio
The greatest threat to an SRE is alert fatigue. Look for tools that offer sophisticated alerting logic—such as “X failures out of Y locations”—to filter out transient network blips. Avoid platforms that force a “one-size-fits-all” threshold, which often leads to “crying wolf” and ignored notifications.
4. Analyze Total Cost of Ownership (TCO)
Beyond the sticker price, consider the operational overhead. Open-source solutions like Zabbix or Prometheus are “free” in licensing but expensive in engineering hours required for maintenance, patching, and scaling. SaaS platforms trade higher licensing costs for reduced “toil,” allowing your team to focus on site reliability rather than monitoring-server maintenance.
Many teams adopt a layered stack or go all-in on unified platforms like Dotcom‑Monitor. What is best for you depends on your budget, system, team size, and team expertise.
If you’re in an enterprise DevOps context, we also cover the specific requirements of top synthetic monitoring solutions for enterprise DevOps teams, including scripting scale, SLA reporting, and SSO. For a structured feature-by-feature evaluation, download our 2026 checklist for choosing the best synthetic monitoring tools.
Bottom Line
In 2026, the “best” tool is the one that eliminates silos between your DevOps, SRE, and QA teams. If you are managing a complex, cloud-native environment, Datadog or Dynatrace provide unparalleled correlation, albeit at a premium price. For teams seeking a robust, unified approach that combines deep protocol checks with global synthetic transactions without the “enterprise tax,” Dotcom-Monitor offers the most pragmatic balance of “outside-in” and “inside-out” visibility.
Ultimately, your goal should be to treat Monitoring as Code. Prioritize tools with strong API support and Terraform providers so that your monitoring evolves as fast as your infrastructure.
Frequently Asked Questions
- Use alerts via a central system
- Use severity levels & thresholds wisely
- Suppress during maintenance windows
- Group related alerts and filter duplicates
- Tune based on historical false positives
