 Real-time applications now define the modern digital experience whether it’s live dashboards, multiplayer games, trading terminals, or collaborative workspaces, all rely on continuous, bidirectional communication.
WebSocket applications make such interaction possible. However, the very features that give them power—persistent connections, high message frequency, and event-driven logic—also create unique monitoring challenges.
Unlike traditional web traffic, which consists of short-lived HTTP requests, WebSockets maintain open connections that require continuous oversight. Effective monitoring demands visibility into message flow, latency, and reliability across thousands or even millions of concurrent sessions.
In this guide, we’ll explore how to monitor WebSocket applications effectively: the key metrics to track, common performance and security pitfalls, and the tools like Dotcom-Monitor that enable scalable observability for WebSocket client applications and chat applications alike.
What is WebSocket Monitoring?
WebSockets enable clients and servers to maintain a constant, bidirectional communication channel. Unlike the traditional HTTP model, where a connection opens and closes for every interaction, WebSockets stay open, allowing real-time data to flow freely. This makes them ideal for applications that require instant updates, such as WebSocket chat applications, live dashboards, trading platforms, and collaborative workspaces.
Effective WebSocket monitoring goes beyond simply tracking connection uptime. The goal is to understand what happens after the handshake: how data flows, where bottlenecks form, and how clients behave under real-world load.
Key metrics for WebSocket monitoring include:
- Handshake latency: Time from initial request to upgrade confirmation.
- Message throughput: Number and size of messages per second.
- Round-trip latency: Time from message sent to acknowledgment or response.
- Backpressure and buffering: Monitor buffered data on both client and server to detect overloads.
- Reconnection frequency: Rate of dropped and reestablished connections.
- Active connection count: Track concurrent sessions per server instance.
These metrics feed into real-time dashboards, often powered by platforms like Prometheus and Grafana or by synthetic monitoring solutions such as Dotcom-Monitor, which visualize latency, message flow, and stability trends in a single interface.
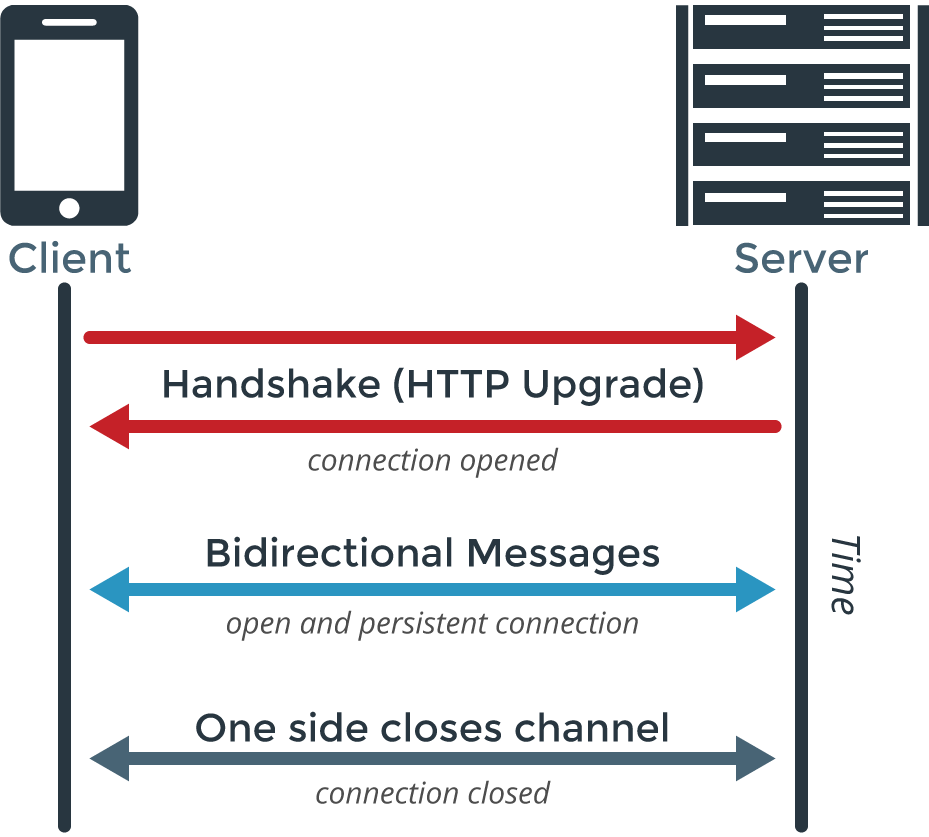
Understanding the WebSocket Handshake
Before a client (like a web browser) and a server can communicate, a WebSocket connection must be established through a handshake.
Server response:
If the server supports WebSockets, it responds with a 101 status code to confirm the handshake. Example:
- HTTP/1.1 101 WebSocket Protocol Handshake
- Date: Wed, 16 Oct 2013 10:07:34 GMT
- Connection: Upgrade
- Upgrade: WebSocket
Client request:
The client sends an HTTP request with an Upgrade header to initiate the WebSocket connection. Example:
- GET ws://websocket.dotcom-monitor.com/ HTTP/1.1
- Origin: https://example.com
- Connection: Upgrade
- Host: websocket.dotcom-monitor.com
- Upgrade: websocket
Once the handshake completes, both client and server can exchange data directly. Unlike traditional HTTP requests, WebSocket communication only transmits your application’s data without extra headers, allowing for faster, real-time interaction.
History of WebSockets
The origins of WebSockets trace back to 2008, when developers Ian Hickson and Michael Carter recognized the limitations of traditional HTTP connections for real-time communication. Through their discussions on the W3C mailing list and Internet Relay Chat (IRC), they collaborated on a proposal for a new standard that would enable modern, bi-directional communication between clients and servers—what we now know as WebSockets.
Their idea was soon incorporated into the W3C HTML standard, and Michael Carter later introduced the concept to the Comet development community, sparking broader adoption and innovation.
By 2010, Google Chrome 4 became the first browser to support WebSockets, marking a major milestone in web communication. One year later, in 2011, the WebSocket Protocol (RFC 6455) was officially published by the Internet Engineering Task Force (IETF), solidifying it as an internet standard.
Since then, WebSocket technology has evolved rapidly. By 2013, both Android and iOS browsers had native WebSocket support, making real-time communication accessible across virtually all devices. Today, WebSockets are a cornerstone of real-time web application development—powering everything from chat applications and live dashboards to multiplayer games and financial trading platforms.
Why Monitoring WebSockets Is Harder Than HTTP
Monitoring a WebSocket application is fundamentally different from monitoring traditional HTTP traffic. Unlike HTTP where each request is a short-lived, independent event, WebSockets maintains an open, continuous connection between the client and server. This persistent nature introduces unique challenges that complicate real-time observability.
Key challenges include:
- Stateful connections: Each WebSocket client session maintains its state, which can persist for hours or even days. Tracking these long-lived connections requires constant visibility.
- Variable message rates: Traffic patterns in WebSocket applications are often bursty and unpredictable, unlike the steady request/response cycles of HTTP.
- Invisible failures: A WebSocket connection can appear active but silently stop transmitting data, creating hidden failures that traditional monitoring tools may miss.
- Scaling limits: With tens or hundreds of thousands of concurrent connections, unmonitored servers can quickly hit capacity, leading to latency spikes or dropped sessions.
Traditional HTTP monitoring tools simply aren’t built to detect these issues. WebSocket monitoring must instead focus on tracking connection lifecycle events, message flow, and server-side performance under sustained load.
To ensure your WebSocket client applications and real-time services stay swift, reliable, and resilient, choose a platform designed for modern workloads.
Explore Dotcom-Monitor’s WebSocket Monitoring Solution
To gain real-time visibility into every connection and message—before small issues turn into major outages.
Typical Applications that Utilize WebSockets
WebSockets power the backbone of many modern, real-time digital experiences. Their ability to maintain continuous, two-way communication makes them ideal for dynamic applications that demand instant updates and low latency. Here are some of the most common use cases:
1. Live Chat and Messaging
Platforms like WhatsApp, Slack, and customer support tools rely on WebSocket chat applications to deliver instant, bidirectional messaging. WebSockets eliminate the need for frequent HTTP polling, allowing messages to appear in real time without delay.
2. Online Gaming
Multiplayer games depend on WebSocket client applications for synchronized gameplay and rapid communication between players. Features such as real-time chat, matchmaking, and in-game event updates all rely on persistent WebSocket connections.
3. Collaborative Workspaces
Tools like Google Docs, Figma, and Miro use WebSockets to support real-time collaboration. Multiple users can work on the same document, board, or design simultaneously, with every change reflected instantly for all participants.
4. Streaming Platforms
Live streaming services—including sports broadcasts, webinars, and social media live events—use WebSockets to provide seamless video delivery and real-time audience engagement through chat and reactions.
5. Stock markets and Financial Dashboards
Financial institutions and trading platforms leverage real-time WebSocket APIs to continuously update data such as stock prices, currency exchange rates, and market performance metrics—essential for rapid, informed decision-making.
6. IoT and Smart Devices
In the Internet of Things (IoT) ecosystem, WebSockets enable real-time communication between smart devices and centralized systems. This allows for immediate feedback, control, and automation—whether in smart homes, vehicles, or industrial environments.
By understanding how diverse WebSocket applications operate, you can design a monitoring strategy that addresses the unique performance, scalability, and reliability requirements of your specific use case.
Challenges in Monitoring WebSocket Applications
Monitoring a WebSocket application is more complex than traditional HTTP-based systems. Because WebSockets maintain persistent, bi-directional connections, they introduce a unique set of performance, scalability, and security challenges that demand continuous oversight.
1. Persistence and Resource Management
Unlike short-lived HTTP requests, WebSocket connections remain open for long periods—sometimes hours or days. While this enables real-time communication, it also increases the risk of resource leaks and memory exhaustion. Proxy servers and firewalls can silently consume server memory or drop idle or “zombie” connections without warning. These hidden failures often go unnoticed without deep, continuous WebSocket monitoring.
2. Performance Bottlenecks and Latency Spikes
Real-time systems rely on sub-second latency. Even a slight increase in round-trip time (RTT) or message delivery delay can degrade user experience in chat systems, trading platforms, or IoT dashboards. Managing backpressure and flow control is also critical—when servers transmit messages faster than clients can process them, buffers overflow, latency rises, and vital updates can be lost.
3. Scalability Across Distributed Architectures
As concurrent sessions grow into the thousands or millions, scaling becomes a major challenge. Each active WebSocket client application must maintain state, message flow, and authentication across distributed nodes. In containerized or Kubernetes-based environments, ephemeral pods can disrupt connection stability if not properly orchestrated and monitored.
4. Security and Data Integrity Risks
Persistent connections expand the attack surface. Without secure WebSocket (WSS) encryption, strict origin validation, and token-based authentication, applications become vulnerable to man-in-the-middle attacks, data leaks, and session hijacking. Effective WebSocket monitoring should include continuous SSL verification, anomaly detection, and access control tracking to ensure a secure communication channel.
Security Best Practices for WebSocket Monitoring
Because WebSocket applications maintain persistent, two-way communication channels, they demand stronger security measures than traditional HTTP or REST APIs. A comprehensive WebSocket monitoring strategy should track performance and enforce security best practices to protect data integrity and application reliability.
1. Enforce Encrypted Connections (WSS)
Always use WebSocket Secure (WSS) over TLS to protect communication between the client and server. Encryption prevents unauthorized interception, data tampering, and eavesdropping, especially in public or multi-tenant environments. Dotcom-Monitor validates that all active WebSocket endpoints maintain strong SSL configurations and certificates.
2. Validate Origins During the Handshake
Origin validation is essential for blocking Cross-Site WebSocket Hijacking (CSWSH) attacks. Each connection request should confirm that the origin header matches trusted domains. Misconfigured origin policies can expose sensitive data or allow unauthorized external connections.
3. Implement Token-Based Authentication
Instead of cookies (which are vulnerable to theft and reuse), use JWT (JSON Web Tokens) or OAuth tokens for authenticating WebSocket clients during the handshake phase. Tokens provide a secure, stateless way to verify identity and permissions for each session. Continuous monitoring should confirm that authentication responses and renewal flows operate as expected.
4. Enforce Rate Limits and Message Validation
Persistent channels are prone to denial-of-service (DoS) or flooding attacks if rate limits aren’t in place. Monitoring should detect unusual spikes in message frequency or size to prevent server overload. Every inbound message must also be sanitized and validated, as payloads can carry injection or serialization vulnerabilities if handled as trusted input.
5. Monitor Security Configurations Continuously
Security is not a one-time setup—it’s a process. Tools like Dotcom-Monitor can continuously audit your WebSocket configurations to ensure:
- Connections remain properly encrypted (WSS).
- Origins align with your defined security policy.
- Tokens and authentication flows function correctly.
- No unauthorized or untrusted sources are communicating with your servers.
By combining real-time monitoring with active security validation, businesses can protect their WebSocket applications from data breaches, unauthorized access, and service interruptions—without compromising performance.
Want to ensure global coverage and resilience?
Explore our guide on Synthetic Monitoring from Multiple Locations to see how multi-location testing complements WebSocket observability.
Maintaining Connection Health and Resilience
A stable WebSocket application depends on constant connection health. Because WebSockets maintain long-lived, persistent sessions, it’s crucial to detect and recover from dropped, stalled, or idle connections in real time. Effective WebSocket monitoring ensures that communication channels remain responsive and self-healing under varying network conditions.
1. Implement Ping/Pong Heartbeats
The most reliable method to verify connection health is through ping/pong heartbeats. These lightweight signals confirm that both the client and server remain responsive. Best practices include:
- Sending ping frames every 30–60 seconds.
- Expecting a pong response within a defined timeout (e.g., 10 seconds).
- Closing or resetting connections when pong responses aren’t received.
Monitoring agents should continuously track:
- Heartbeat success rate—percentage of successful ping/pong exchanges.
- Average ping latency—the round-trip time for each heartbeat.
- Disconnection causes—identifying whether disconnects stem from server overload, network timeouts, or client-side failures.
2. Enable Intelligent Reconnection Strategies
Dropped connections are inevitable, especially under fluctuating network conditions. Instead of reconnecting instantly (which can overload servers), clients should implement exponential backoff with jitter, a strategy that spaces out retries to prevent synchronized reconnection storms.
Tools to Simplify WebSocket Monitoring
Monitoring and maintaining a WebSocket application requires specialized tools capable of tracking live connections, latency, and throughput across distributed environments. Below are some of the most effective tools that simplify WebSocket monitoring, analysis, and troubleshooting.
Dotcom-Monitor
Dotcom-Monitor delivers end-to-end visibility into WebSocket performance using synthetic monitoring scripts that emulate real user interactions. The platform tracks:
- Connection success rates and handshake latency
- Throughput and message delivery times
- Encryption, origin validation, and protocol negotiation compliance
By leveraging its real-browser monitoring engine, Dotcom-Monitor can simulate bi-directional WebSocket traffic from multiple global locations—measuring stability, latency, and overall responsiveness in real time.
Comprehensive dashboards visualize session health, latency trends, and connection churn, while intelligent alerting immediately detects issues such as slow message throughput or handshake failures.
Using UserView scripting, teams can even monitor entire workflows—from authentication and MFA validation through WebSocket message exchange—without breaking session logic.
Wireshark
Wireshark is a go-to tool for packet-level debugging. It captures raw WebSocket frames—including handshakes, control frames, and message payloads—to help identify low-level connection issues. While extremely powerful for root-cause analysis, Wireshark is best suited for diagnostic troubleshooting, not continuous performance monitoring.
Prometheus + Grafana
The open-source duo Prometheus and Grafana remains a popular choice for operational WebSocket metrics monitoring.
- Prometheus collects and stores metrics such as connection counts, message rates, and latency histograms.
- Grafana visualizes those metrics in customizable dashboards and triggers alerts when performance thresholds are exceeded.
This combination provides developers with flexible, self-managed observability for real-time systems.
Additional Tools for WebSocket Monitoring
Artillery and k6:
Load testing frameworks that simulate thousands of concurrent WebSocket clients to assess scalability and message performance.
Autobahn|Testsuite:
Validates RFC 6455 protocol compliance, ensuring your WebSocket implementation adheres to the official standards.
OWASP ZAP:
A security testing suite that scans for WebSocket injection, authentication weaknesses, and hijacking vulnerabilities to harden your real-time applications.
Wrapping Up: The Importance of Monitoring WebSocket Applications
Today’s digital experiences depend on WebSocket applications—powering everything from financial dashboards and IoT systems to multiplayer games and chat platforms. But their persistent, always-on nature introduces hidden risks. Issues like slow reconnections, buffer overloads, or missed heartbeats can quietly erode user experience and performance at scale.
Comprehensive WebSocket monitoring eliminates that uncertainty. By tracking real-time metrics, validating security configurations, and testing system resilience under load, organizations can ensure every connection remains quick, stable, and secure.
Dotcom-Monitor simplifies this process through a unified platform that combines:
- Synthetic WebSocket monitoring to emulate real-world traffic and workflows
- Real-time dashboards to visualize connection health and latency trends
- Protocol-level analysis to detect handshake errors, encryption issues, and throughput bottlenecks
With Dotcom-Monitor, you can monitor connection uptime, message delivery accuracy, and end-to-end encryption compliance—all in one place. This proactive visibility helps you detect performance issues before users experience them, keeping your applications dependable and high-performing.
Start monitoring your WebSocket applications with Dotcom-Monitor to ensure unmatched reliability and uptime.
Sign up for a free trial today
And experience the power of proactive WebSocket performance monitoring firsthand.
Frequently Asked Questions
WebSocket monitoring involves tracking the performance, reliability, and security of WebSocket-based connections that enable real-time communication between clients and servers. Unlike traditional HTTP requests, WebSockets maintain persistent, two-way communication channels, complicating them to monitor.
Monitoring helps detect issues like connection drops, latency spikes, message delivery delays, and security vulnerabilities that can disrupt user experience. By implementing continuous monitoring with tools like Dotcom-Monitor, businesses can ensure that real-time applications—such as chat systems, trading dashboards, or multiplayer games—run smoothly and securely at scale.
Effective WebSocket performance monitoring goes beyond basic uptime checks. Key metrics include:
- Handshake latency —time to establish the WebSocket connection.
- Message throughput—the number and size of messages exchanged per second.
- Round-trip latency—Time taken for a message to travel from client to server and back.
- Active connection count—the number of concurrent connections at any given moment.
- Reconnection rate —frequency of dropped and reestablished sessions.
- Error and timeout rates serve as indicators of network instability or configuration issues.
Tracking these metrics offers broad perspectives on connection health and application responsiveness, helping teams proactively resolve issues before they impact users.
Dotcom-Monitor simplifies WebSocket observability by offering synthetic monitoring that emulates real-world user interactions across multiple global locations. The platform provides:
- End-to-end visibility into connection performance, latency, and uptime.
- Real-browser testing to simulate bidirectional WebSocket traffic.
- We utilize real-time dashboards and intelligent alerts to pinpoint any slowdowns or handshake failures.
- Security validation for WSS encryption, origin checks, and token authentication.
With UserView scripting, teams can monitor entire workflows—from login through message exchange—without breaking session or MFA logic. This ensures a comprehensive view of WebSocket performance, security, and reliability.
