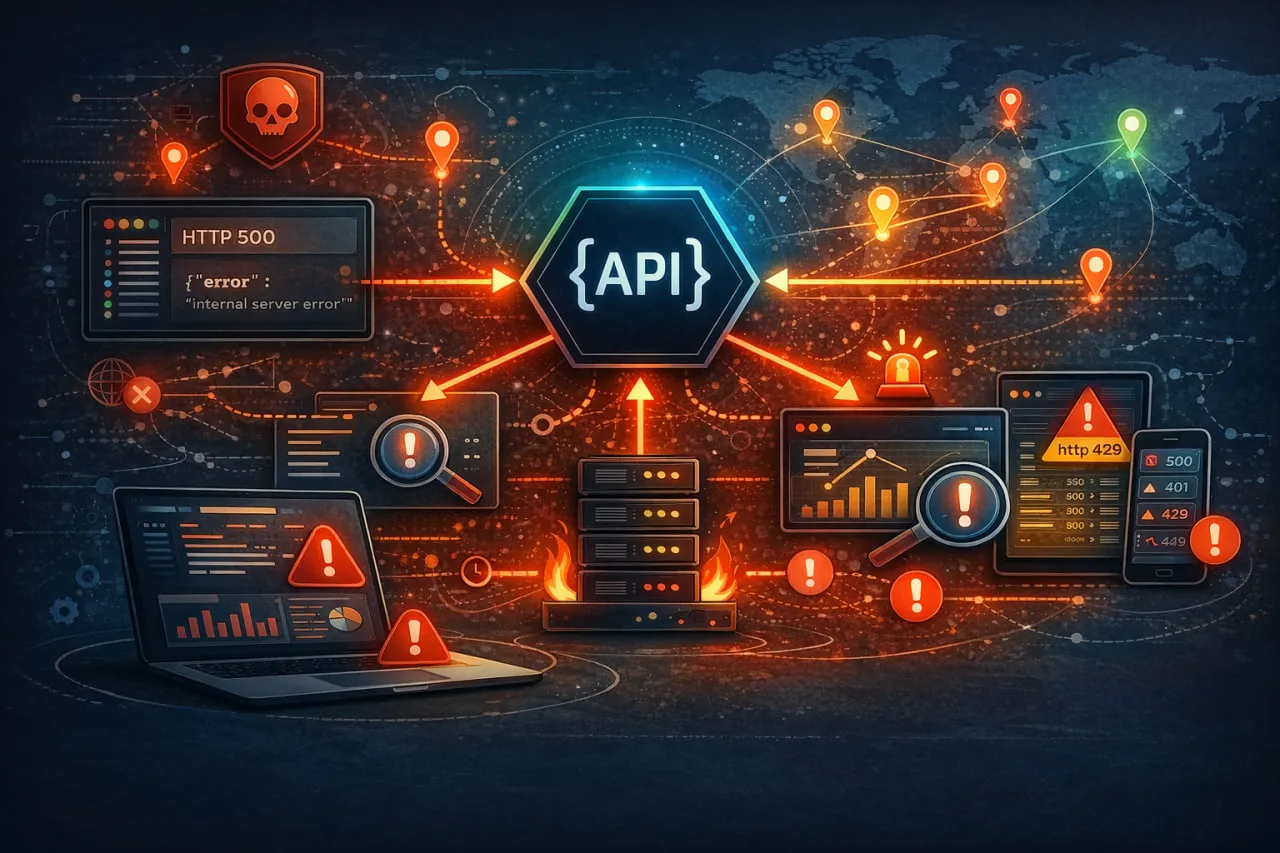
 APIs power nearly every modern digital experience. From mobile apps and SaaS platforms to payment gateways and internal microservices, APIs handle authentication, transactions, content delivery, and system-to-system communication. When an API fails, users often experience broken features, slow responses, or complete service outages. In many cases, they leave before your team even realizes something is wrong.
The business impact of API failures is significant. Organizations risk lost revenue from failed transactions, SLA violations, damaged brand trust, and increased operational overhead. As architectures become more distributed and reliant on third-party services, the surface area for potential API errors continues to grow.
This is where API error monitoring becomes essential. Traditional logging and debugging tools help teams investigate problems after they occur, but they often lack proactive visibility into endpoint availability, response validation, and real-world performance. Engineering teams need more than stack traces. They need continuous insight into whether APIs are functioning correctly across environments and geographic regions.
To fully understand this discipline, it helps to explore how API monitoring works in practice and how it extends beyond simple exception tracking. API error monitoring involves:
- Detecting failures before users encounter them
- Validating responses and critical business logic
- Triggering real-time alerts based on defined monitoring rules for availability, performance, or validation failures
In this guide, we will examine what API error monitoring is, why it matters, the types of failures you must track, and how proactive strategies can reduce downtime and user impact.
What Is API Error Monitoring?
API error monitoring is the practice of continuously detecting, tracking, and analyzing failures that occur when an API does not behave as expected. These failures may include HTTP status errors, timeouts, malformed responses, authentication issues, or performance degradations that impact reliability.
At its core, API error monitoring answers a simple but critical question:
Is this API functioning correctly right now for real users and systems?
Many teams confuse API error monitoring with basic logging. Logs record events after they happen. Developers can search through them to investigate issues. However, logs alone do not actively test endpoints, validate responses, or notify teams when availability drops below acceptable thresholds.
It is also different from traditional application performance monitoring. APM tools typically focus on application internals such as code-level exceptions, database queries, and transaction traces. While valuable, they may not provide an external, user-perspective view of API availability.
Effective API error monitoring combines multiple layers of visibility:
- Detecting HTTP 4xx and 5xx errors in real time
- Monitoring endpoint uptime and response success rates
- Validating response bodies against expected values
- Tracking latency spikes that signal underlying instability
To better understand how this fits into a broader strategy, you can review a complete overview of API monitoring concepts, which explains how error detection works alongside availability and performance tracking.
Modern API ecosystems are distributed across cloud environments, third-party services, and microservices architectures. Because of this complexity, API error monitoring must go beyond reactive debugging. It should continuously validate endpoints from an external perspective and alert teams before users experience widespread impact.
When implemented correctly, API error monitoring becomes a foundational component of API reliability engineering.
Why API Error Monitoring Is Critical for Modern Applications
Modern applications are no longer monolithic systems running on a single server. They are distributed environments built on microservices, third-party integrations, serverless functions, and cloud infrastructure. Each API endpoint represents a potential failure point. As the number of dependencies grows, so does the likelihood of errors.
In this environment, API error monitoring is not optional. It is essential for protecting performance, uptime, and user experience.
Consider what happens during an API failure:
- A payment API returns intermittent 500 errors
- An authentication endpoint times out under peak traffic
- A third-party shipping API changes its response schema without notice
Even if the core application is functioning, these API failures can break critical workflows. Because APIs often sit between users and business logic, errors directly affect revenue and trust.
API error monitoring also plays a key role in maintaining service-level agreements. Organizations that promise uptime or response-time guarantees must continuously verify that endpoints meet defined thresholds. Without automated monitoring and alerting, teams risk discovering issues only after customers complain.
Beyond uptime, modern observability practices emphasize full-stack visibility. Understanding how errors propagate across services is part of a larger strategy supported by modern API observability tools, which combine error detection, performance insights, and trace data.
Additionally, public-facing APIs require constant status verification. If customers rely on your API, you need clear, measurable proof of reliability. Continuous monitoring supports transparent reporting and aligns with best practices outlined in API status monitoring strategies.
As digital ecosystems become more interconnected, even a minor upstream failure can cascade across multiple services. Proactive API error monitoring helps teams isolate issues quickly, reduce mean time to resolution, and protect the user experience before widespread disruption occurs.
Monitoring Error Budgets and Reliability Objectives
Many engineering teams measure reliability using Site Reliability Engineering (SRE) concepts such as Service Level Indicators (SLIs), Service Level Objectives (SLOs), and error budgets.
These metrics provide a structured framework for balancing reliability with development velocity.
Common examples include:
| Metric | Description |
| SLI | Measured reliability metric (e.g., successful API responses) |
| SLO | Target reliability threshold (e.g., 99.9% uptime) |
| Error Budget | Acceptable failure allowance within the SLO |
Example calculation:
- SLO target = 99.9% success rate
- Allowed failures = 0.1%
If the API processes 1,000,000 requests per month:
Allowed failures = 1,000
Monitoring systems should track error budgets continuously. When failure rates approach the threshold, engineering teams may pause deployments or prioritize reliability improvements.
This approach ensures monitoring aligns with business reliability goals.
Common Types of API Errors You Must Monitor
Not all API errors are the same. Some failures are obvious, such as a 500 Internal Server Error. Others are more subtle, including slow response times, malformed JSON payloads, or partial data responses that silently break application logic.
To build an effective API error monitoring strategy, you must understand the different categories of failures that can impact reliability.
1. HTTP Status Code Errors (4xx and 5xx)
HTTP status codes are the most visible indicators of API problems.
- 4xx errors typically indicate client-side issues, such as bad requests or unauthorized access
- 5xx errors indicate server-side failures, such as crashes or misconfigurations
While tracking status codes is foundational, simply logging them is not enough. Teams should monitor error rate trends over time and set alert thresholds when failure percentages exceed acceptable levels. This aligns closely with broader API availability monitoring practices, where uptime and success rates are continuously measured.
2. Timeouts and Latency Failures
An API can technically return a 200 OK response and still be failing from a user perspective. Excessive latency often causes frontend timeouts, abandoned transactions, and degraded experiences.
Monitoring for:
- Response time spikes
- Slow downstream dependencies
- Increased time to first byte
is essential. Detailed guidance on measuring these signals can be found in discussions around API response time monitoring techniques and deeper analysis of API latency monitoring best practices.
Latency issues often precede full outages. Detecting them early provides an opportunity to prevent escalation.
3. Authentication and Authorization Errors
Expired tokens, incorrect credentials, or permission misconfigurations can prevent legitimate users or services from accessing endpoints. These issues may appear as 401 or 403 errors and often spike during deployments or security updates.
Continuous monitoring ensures that authentication workflows remain functional after configuration changes.
4. Schema and Payload Validation Errors
Sometimes the endpoint responds successfully but returns incorrect or incomplete data. Examples include:
- Missing required fields
- Invalid JSON structure
- Incorrect data types
- Business logic failures, such as incorrect pricing values
These errors are especially dangerous because they may not trigger traditional server-side alerts. Response validation monitoring ensures that APIs return expected values and formats, protecting downstream systems.
In many monitoring systems, API responses must be validated beyond HTTP status codes. Engineers often implement automated validation scripts that confirm required fields and expected values.
For example, a monitoring check might validate that a payment API response includes a transaction ID and a successful status.
Example payload validation script (JavaScript):
const response = JSON.parse(apiResponse.body);

if (!response.transaction_id) {

throw new Error("Missing transaction_id in API response");

}

if (response.status !== "success") {

throw new Error(`Unexpected status value: ${response.status}`);

}

if (response.amount <= 0) {

throw new Error("Invalid transaction amount detected");

}
This type of validation ensures that APIs are not only available but also returning correct business logic values, preventing silent failures in downstream services.
Many monitoring platforms allow teams to embed similar validation rules directly into synthetic API tests.
5. Third-Party and Upstream Dependency Failures
Many APIs rely on external services such as payment processors, shipping providers, or data vendors. When these dependencies fail, your API may return errors even if your infrastructure is stable.
Endpoint-level monitoring, such as described in API endpoint monitoring strategies, helps isolate which service in the chain is failing and reduces diagnostic time.
By tracking these categories collectively, teams gain a comprehensive view of API health rather than reacting only to obvious crashes.
6. Rate Limiting and 429 Errors
Many APIs enforce rate limits to prevent abuse and protect backend infrastructure. When applications exceed allowed request quotas, the API typically returns a 429 Too Many Requests error.
These failures often appear during:
- Sudden traffic spikes;
- Batch processing jobs;
- Misconfigured retry loops;
- Integration with third-party APIs that enforce strict quotas.
Monitoring systems should track 429 error rates separately from general HTTP failures, since these errors usually indicate traffic management issues rather than application instability.
Effective monitoring strategies include:
- Tracking request frequency per endpoint;
- Alerting when 429 errors exceed baseline levels;
- Monitoring rate-limit headers such as:
- X-RateLimit-Limit
- X-RateLimit-Remaining
- X-RateLimit-Reset
When rate limiting occurs frequently, engineering teams may need to adjust traffic patterns, increase quotas, or implement request throttling mechanisms within the application.
How API Error Monitoring Works
API error monitoring typically operates through two complementary approaches: reactive error tracking within applications and proactive synthetic monitoring from outside the system. Understanding the difference is critical to building a complete reliability strategy.
Reactive Error Tracking Inside the Application
Reactive monitoring captures errors after they occur within your application code. This approach often includes:
- Exception tracking and stack traces
- Log aggregation and search
- Release tagging to correlate errors with deployments
- Error grouping and alerting
These tools help developers diagnose why a failure happened. They provide context such as which line of code triggered an exception or which database query failed.
However, reactive tracking has limitations. It depends on traffic hitting the system. If no request triggers the failing path, the issue may remain undetected. It also reflects what happens internally, not necessarily how the API behaves from an external user perspective.
Reactive tools are valuable for debugging. They are less effective at answering whether an endpoint is consistently available across regions or meeting defined SLAs.
Proactive Synthetic API Monitoring
Proactive monitoring takes a different approach. Instead of waiting for users to encounter failures, synthetic monitoring actively tests API endpoints at regular intervals.
This typically includes:
- Sending scheduled requests to REST or SOAP endpoints
- Validating HTTP status codes
- Verifying response content and structure
- Measuring response times
- Triggering alerts when thresholds are breached
Because tests run continuously from external locations, teams gain visibility into real-world availability and performance.
For example, with Dotcom-Monitor’s API Monitoring platform, teams can configure REST Web API tasks to validate specific response fields, authenticate securely, and monitor multi-step API workflows before customers are affected.
Synthetic monitoring also supports SLA tracking and global performance benchmarking. If an endpoint fails in one geographic region but not another, monitoring tools can help identify where failures are occurring.
The most effective API error monitoring strategy combines both approaches. Reactive tools help engineers fix root causes. Proactive synthetic monitoring detects failures early and prevents widespread user impact. Together, they reduce mean time to detection and improve overall API reliability.
API Error Monitoring in Distributed and Cloud-Native Architectures
Modern APIs rarely run as single services. Most production environments operate within distributed architectures composed of microservices, containerized workloads, serverless functions, and third-party dependencies.
In these environments, detecting API failures requires more than endpoint checks. Teams must monitor interactions between services, track requests across infrastructure layers, and identify failure patterns that propagate through distributed systems.
Several architectural monitoring patterns are particularly important in cloud-native environments.
Distributed Tracing
In distributed systems, a single user request may pass through multiple services before returning a response. When an error occurs, identifying the failing component can be difficult without visibility into the entire request path.
Distributed tracing allows engineers to follow the lifecycle of a request as it travels through multiple services.
Example trace flow:
Client Request

↓

API Gateway

↓

Authentication Service

↓

Order Processing Service

↓

Payment Service

↓

Inventory Service
Tracing tools attach a unique trace ID to each request, enabling monitoring platforms to correlate logs, metrics, and errors across services.
This approach allows teams to quickly identify where failures originate and understand how errors propagate through the system.
Common tracing frameworks include:
- OpenTelemetry;
- Jaeger;
- Zipkin.
When combined with synthetic API monitoring, distributed tracing helps engineers detect failures externally while diagnosing root causes internally.
Circuit Breakers and Failure Isolation
In distributed architectures, failures in one service can cascade across dependent systems. To prevent this, many platforms implement circuit breaker patterns.
A circuit breaker temporarily stops requests to a failing service once a failure threshold is exceeded.
Example workflow:
Request → Service A → Service B (failing)
Circuit breaker triggers

↓

Requests to Service B temporarily blocked

↓

Fallback response returned
Monitoring systems should track circuit breaker events because frequent trips may indicate deeper infrastructure or dependency issues.
Monitoring circuit breaker metrics helps teams detect instability before full service outages occur.
Serverless and Cloud-Native Monitoring Challenges
Serverless architectures introduce additional monitoring challenges because functions run only when triggered and often exist for very short durations.
Common monitoring considerations include:
- Cold start latency;
- Short-lived execution environments;
- Event-driven workflows;
- Third-party event triggers.
Traditional logging tools may miss failures when serverless functions terminate quickly.
Synthetic API monitoring is particularly valuable in these environments because it continuously tests endpoints regardless of runtime execution patterns.
Observability Stack Integrations
Modern engineering teams typically combine several observability tools to monitor APIs effectively.
A common observability stack includes:
| Layer | Tool Examples |
| Metrics | Prometheus, Datadog |
| Logs | ELK Stack (Elasticsearch, Logstash, Kibana) |
| Tracing | OpenTelemetry, Jaeger |
| Synthetic Monitoring | API uptime monitoring tools |
Integrating monitoring platforms with observability systems allows teams to correlate:
- API failures;
- infrastructure metrics;
- distributed traces;
- application logs.
This unified view significantly improves incident diagnosis and reduces mean time to resolution.
API Error Monitoring vs API Performance Monitoring
API error monitoring and API performance monitoring are closely related, but they are not the same discipline. Understanding the distinction helps teams build more precise alerting strategies and avoid blind spots.
API error monitoring focuses on correctness and availability. It answers questions such as:
- Is the endpoint returning a successful status code
- Are authentication workflows functioning
- Is the response body valid and complete
- Has the failure rate exceeded acceptable thresholds
In contrast, API performance monitoring focuses on speed and responsiveness. An API may return a 200 OK response but still degrade the user experience if it takes several seconds to respond.
Performance monitoring typically tracks:
- Average and percentile response times
- Latency spikes under load
- Geographic performance variations
- Throughput and traffic trends
For deeper insight into these metrics, many teams rely on practices outlined in API response time monitoring strategies and detailed evaluations of API latency monitoring approaches.
The key difference is impact timing. Error monitoring identifies when something is broken. Performance monitoring identifies when something is slowing down and may soon break.
In practice, these disciplines overlap. Latency increases often precede server-side errors. Slow upstream dependencies can cascade into timeouts. This is why a comprehensive monitoring strategy should include both.
When paired together, API error monitoring and performance monitoring provide a full picture of reliability. Teams can detect failures, diagnose slowdowns, and intervene before minor degradations turn into major outages.
Understanding the API Monitoring and Observability Tool Landscape
Modern engineering teams rarely rely on a single monitoring tool. Instead, they combine multiple observability solutions that each provide visibility into different aspects of system behavior.
When evaluating API error monitoring strategies, it helps to understand how the major tool categories differ and how they complement each other.
The most common categories include:
- Synthetic monitoring;
- Application performance monitoring (APM);
- Error tracking platforms;
- Log management systems.
Each category addresses a different layer of the reliability stack.
| Tool Category | Primary Purpose | Example Vendors | Strengths | Limitations |
| Synthetic API Monitoring | External testing of API availability and response validation | Dotcom-Monitor, Pingdom, Checkly | Detects failures before users report them, validates responses, monitors uptime globally | Does not provide deep application-level debugging |
| Application Performance Monitoring (APM) | Tracks application performance and internal service behavior | Datadog, New Relic, Dynatrace | Deep insight into code execution, database queries, and service dependencies | May not detect outages from an external user perspective |
| Error Tracking | Captures application exceptions and stack traces | Sentry, Rollbar, Bugsnag | Excellent for debugging code-level errors | Reactive rather than proactive monitoring |
| Log Management | Aggregates and analyzes system logs | Splunk, ELK Stack, Loggly | Powerful search and historical analysis | Requires manual investigation and may not trigger proactive alerts |
When to Use Synthetic API Monitoring
Synthetic monitoring tools continuously test API endpoints from external locations. These tools simulate real API requests and validate responses to ensure services are available and functioning correctly.
Synthetic monitoring is particularly valuable for detecting:
- endpoint downtime;
- response validation failures;
- authentication issues;
- geographic performance degradation.
Because tests run independently of real user traffic, these systems often detect outages before customers encounter them.
When to Use Application Performance Monitoring (APM)
APM platforms focus on internal system performance. They track metrics such as:
- service latency;
- database query performance;
- CPU and memory usage;
- dependency call chains.
APM tools are valuable for diagnosing root causes once a failure occurs. However, they may not detect availability issues if requests never reach the application.
When to Use Error Tracking Platforms
Error tracking tools specialize in capturing application exceptions.
When an error occurs, these systems collect detailed diagnostic information including:
- stack traces;
- code context;
- release versions;
- affected users.
This information helps developers quickly reproduce and fix issues.
However, error tracking platforms typically rely on application traffic, meaning they may not detect problems until users encounter them.
When to Use Log Management Platforms
Log management tools aggregate system logs across infrastructure components.
They allow engineers to search for events, analyze historical patterns, and investigate incidents.
While logs provide valuable context, they are primarily reactive. Engineers must often manually analyze log data to identify issues.
For this reason, logs are most effective when combined with proactive monitoring systems.
Key Features to Look for in an API Error Monitoring Tool
Not all API monitoring solutions provide the same level of visibility. To effectively detect, diagnose, and prevent failures, teams should evaluate tools based on specific capabilities that support both proactive and reactive monitoring.
Below are essential features to prioritize.
1. Real-Time Alerting
Monitoring is only valuable if teams are notified quickly. Look for configurable alerts based on error rate thresholds, response time limits, or validation failures. Alerting should support configurable notification channels to ensure timely response.
2. Response Validation and Content Checks
Status codes alone do not guarantee correctness. A robust solution must validate response bodies, JSON structure, headers, and critical data fields. This ensures business logic is functioning properly, not just infrastructure.
3. Global Monitoring Locations
APIs can perform differently depending on geographic routing, CDN behavior, or regional or network-related performance differences. Monitoring from multiple locations helps detect localized outages and network issues.
4. Multi-Step and Transaction Monitoring
Many APIs rely on sequential calls such as authentication followed by data retrieval. Monitoring should simulate complete workflows, not just single endpoints.
5. SLA and Reporting Capabilities
If your organization commits to uptime guarantees, you need measurable data. SLA dashboards and historical reporting provide proof of reliability and help identify recurring issues.
6. Flexible REST API Configuration
Teams should be able to configure and modify monitoring tasks easily. Documentation such as how to configure REST Web API tasks and guides on editing existing REST API monitoring tasks highlight the importance of flexible setup and management.
When evaluating solutions, it is worth reviewing the full capabilities of Dotcom-Monitor’s API Monitoring solution, which combines synthetic monitoring, validation, alerting, and reporting into a unified platform designed for proactive reliability.
Selecting the right tool ensures your monitoring strategy supports both engineering efficiency and business continuity.
Example Metrics Displayed in API Monitoring Dashboards
A typical API monitoring dashboard aggregates several operational metrics.
Common panels include:
| Metric | Description |
| Endpoint uptime | Percentage availability of each API |
| Error rate | Ratio of failed vs successful requests |
| Response time | Average and percentile latency |
| Geographic performance | Latency across monitoring regions |
| Validation failures | Schema or payload validation errors |
| Dependency health | Status of upstream APIs |
Visual dashboards allow teams to quickly identify trends, anomalies, and regional outages.
Best Practices for Effective API Error Monitoring
Implementing API error monitoring is only the first step. To maximize its effectiveness, teams must apply clear operational practices that align monitoring with business priorities.
1. Monitor from Multiple Geographic Locations
APIs may behave differently depending on routing, regional infrastructure, or CDN performance. Testing from a single location can create blind spots. Distributed monitoring helps identify localized outages and network degradation before they impact large user segments.
2. Combine Synthetic Monitoring with Internal Observability
Relying solely on internal logs or exception tracking limits visibility. A balanced approach includes proactive synthetic tests alongside application-level diagnostics. This layered strategy improves mean time to detection and accelerates root cause analysis.
3. Define Intelligent Alert Thresholds
Overly sensitive alerts cause fatigue. Loose thresholds delay detection. Establish baseline performance metrics and define acceptable error-rate percentages. Alerts should trigger when meaningful deviations occur, not during minor fluctuations.
4. Validate Business Logic, Not Just Status Codes
An endpoint returning 200 OK does not guarantee correctness. Monitoring should confirm required fields, data formats, and critical values. For example, payment totals or authentication tokens must match expected outputs.
5. Monitor Third-Party Dependencies
External services can introduce instability. Proactively testing integrations reduces the risk of cascading failures across microservices.
6. Standardize Monitoring Configuration
Consistency matters. Using documented setup procedures such as web API monitoring setup guidelines ensures teams configure tasks correctly and maintain reliability across environments.
By applying these best practices, organizations move beyond reactive debugging and toward continuous reliability management. When supported by a comprehensive platform such as Dotcom-Monitor’s API Monitoring tool, these practices help detect anomalies early, protect SLAs, and safeguard user experience at scale.
How Dotcom-Monitor Helps You Detect API Failures Before Users Do
Preventing API failures from reaching users requires continuous, external validation. Rather than waiting for exceptions to surface in production logs, proactive monitoring actively tests endpoints from external global monitoring locations
With Dotcom-Monitor’s API Monitoring software, teams can configure synthetic tests that run at scheduled intervals from multiple global locations. These tests verify:
- Endpoint availability and uptime;
- HTTP status codes and error rates;
- Response times and latency thresholds;
- JSON structure and specific response fields;
- Authentication workflows and token validation.
Because tests execute independently of user traffic, failures can be detected even during off-peak hours. This reduces mean time to detection and allows teams to respond before customers are impacted.
Dotcom-Monitor also supports multi-step API transactions. For example, a workflow can authenticate, submit a request, validate the response payload, and confirm downstream actions. This ensures business logic remains intact across complex service chains.
In addition, built-in alerting options allow teams to configure real-time alerts based on defined monitoring conditions to support SLA tracking and incident response.. Performance data and uptime reports provide measurable insight into API health over time.
For organizations seeking a proactive reliability strategy, exploring the full capabilities of API monitoring from Dotcom-Monitor offers a practical path toward reducing downtime and strengthening API performance visibility.
By combining synthetic monitoring, response validation, and intelligent alerting, teams gain the confidence that their APIs are functioning as intended before users ever notice an issue.
Conclusion: From Reactive Debugging to Proactive API Reliability
API reliability is no longer just a developer concern. It is a business priority. Every failed request, timeout, or malformed response has the potential to disrupt user experiences, impact revenue, and erode trust.
API error monitoring provides the visibility needed to detect and resolve these issues quickly. However, as modern systems become more distributed and dependency-driven, reactive debugging alone is not enough. Teams must continuously validate endpoint availability, performance, and response integrity from an external perspective.
By combining internal diagnostics with proactive synthetic monitoring, organizations can:
- Detect failures earlier;
- Reduce mean time to resolution;
- Protect SLAs and customer commitments;
- Prevent minor degradations from becoming major outages.
Adopting a proactive strategy supported by a comprehensive API monitoring solution for modern teams enables organizations to monitor endpoints globally, validate critical business logic, and receive intelligent alerts before users are affected.
API error monitoring is not just about tracking failures. It is about building resilient systems that maintain performance and reliability at scale.
