 Quick Answer: Web transaction monitoring is a type of synthetic monitoring that uses scripted browser tests to simulate and validate multi-step user workflows, such as logins or checkouts. It proactively checks application functionality and performance from end-to-end, ensuring critical user journeys work correctly before customers are impacted.
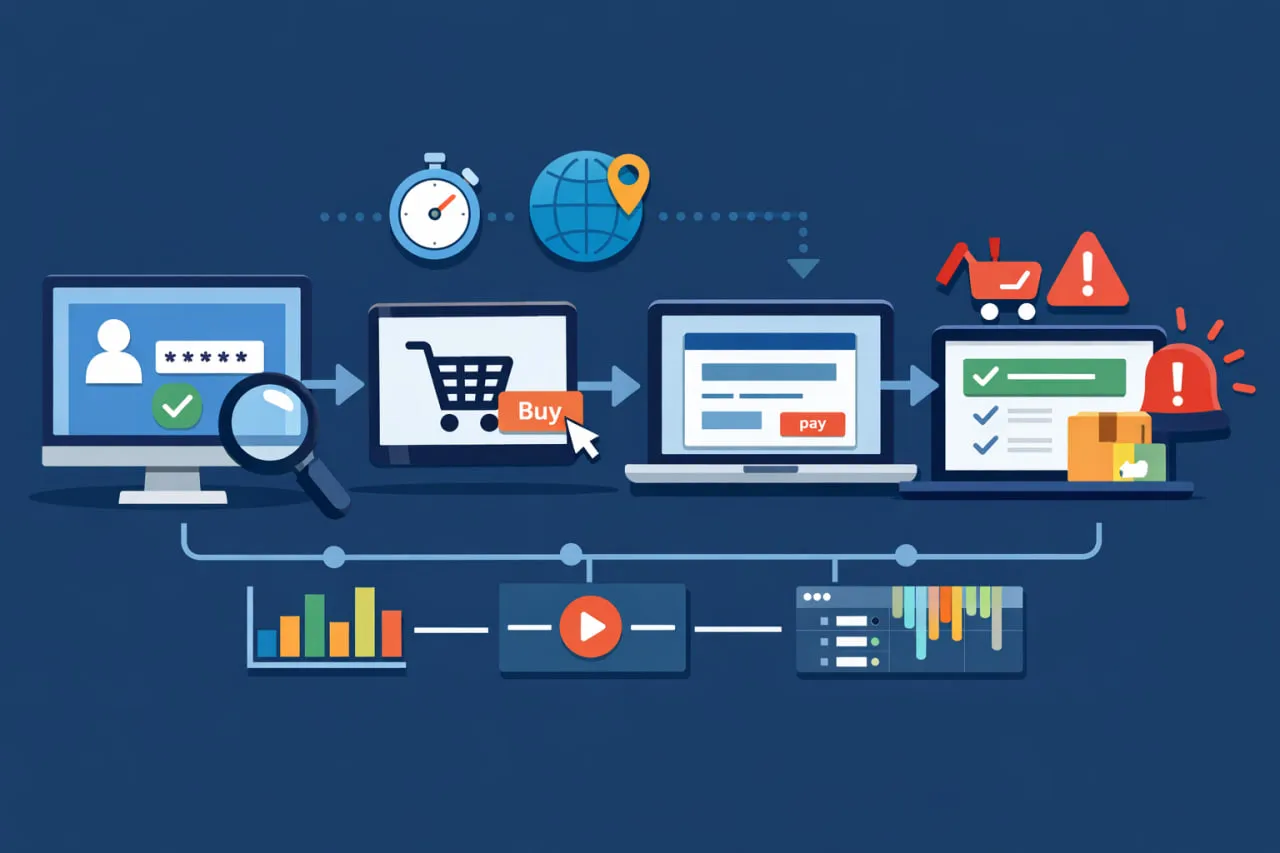
Web transaction monitoring is a form of synthetic monitoring that continuously tests critical, multi-step user workflows on a website or web application to verify that users can successfully complete key actions. Unlike simple uptime or API checks, it simulates a real user’s journey—such as logging in, submitting a form, or completing a checkout—to validate both functional correctness and performance from start to finish.
In Dotcom-Monitor, this capability is delivered through the UserView platform, which executes these scripted interactions in real desktop browsers from over 30 global monitoring locations. By validating the entire end-to-end user journey, including front-end rendering, JavaScript execution, and dynamic content, UserView detects silent failures that other monitoring types miss. Each step in a transaction is confirmed with explicit validation rules, ensuring that alerts are only triggered for genuine, user-impacting issues.
Why Do Broken or Slow Transactions Matter?
When a critical user workflow fails, the impact goes far beyond a simple error message. These failures directly affect revenue, user trust, and contractual obligations, making proactive monitoring an essential business practice, not just a technical one.
The most direct impact is on revenue. A broken checkout form doesn’t just frustrate a user; it results in an abandoned cart and lost sales. For B2B SaaS companies, a non-functional login or a broken “request a demo” form means lost leads and potential customers turning to competitors. These failures are particularly insidious because they often occur without triggering any server-side error—the page loads, the backend is healthy, but the user simply cannot complete their task.
Beyond immediate revenue, broken transactions erode user trust and brand reputation. Users expect a seamless digital experience, and when they encounter errors, slow performance, or broken functionality, it damages their perception of the brand. Research consistently shows that users who experience a single bad interaction are significantly less likely to return, and in competitive markets, they will simply switch to an alternative.
For many service providers, performance and availability are also contractually guaranteed through Service Level Agreements (SLAs). A transaction failure that goes undetected can lead to an SLA breach, resulting in financial penalties, strained client relationships, and damage to your professional reputation. Proactive transaction monitoring provides the evidence needed to both prevent breaches and demonstrate compliance.
According to Gartner®, Digital Experience Monitoring (DEM) tools are critical for understanding “the availability, performance and quality of the user experience.” [1] Web transaction monitoring is a core pillar of DEM because it directly measures the success or failure of the user journeys that define that experience.
How Does Web Transaction Monitoring Work?
Web transaction monitoring in Dotcom-Monitor is implemented through the UserView platform, which uses real browser engines to execute scripted user interactions at scheduled intervals. Unlike protocol-based checks that only validate server responses, UserView runs full browser sessions that behave like a real user—executing JavaScript, rendering the DOM, handling cookies, and following redirects exactly as a browser would in production. This process provides deep visibility into both application functionality and performance.
Scripting and Execution
Transaction scripts are created using the EveryStep Web Recorder, a tool that allows teams to visually record real browser interactions like clicks, typing, and navigation. These recordings are automatically converted into editable, step-based scripts that can be enhanced with conditional logic, waits, and specific validation rules. This approach combines the speed of no-code recording with the reliability of programmatic scripting.
Once a script is created, UserView executes it according to a defined schedule from a global network of over 30 monitoring locations. Each execution follows a deterministic flow:
- Browser Initialization: A real desktop browser instance is launched to fully support JavaScript execution and client-side rendering.
- Navigation and Interaction: The browser navigates to the target URL and performs the scripted actions, such as logging in, submitting a form, or interacting with dynamic elements.
- Asynchronous Handling: The platform automatically waits for background activities like AJAX calls and client-side rendering to complete before proceeding to the next step, which is crucial for monitoring modern Single-Page Applications (SPAs).
- Step-Level Validation: At each step, explicit validation rules are checked. A step only passes if the expected UI state is confirmed, such as the presence of specific text (“Order Confirmed”) or the visibility of a key element. This ensures that a transaction is functionally successful, not just that a page returned an HTTP 200 status.
Diagnostics, Alerting, and Reporting
Effective monitoring is not just about detecting failures—it’s about detecting the right failures and providing actionable data to resolve them quickly. When a transaction step fails, UserView automatically captures a suite of diagnostic evidence to eliminate guesswork and reduce Mean Time to Resolution (MTTR).
This evidence includes:
- A full video recording of the entire transaction execution.
- Screenshots captured at the moment of failure.
- A detailed waterfall chart that shows resource loading, network timing, and rendering behavior, synchronized with the video playback.
Alerts are only triggered when functional validation fails or performance thresholds are breached. To prevent alert fatigue from transient network issues, failures can be configured to require confirmation from multiple monitoring locations before an alert is sent. This intelligent alerting, combined with rich visual diagnostics, transforms monitoring from a simple detection tool into a powerful diagnostic system that engineers can act on immediately.
How Does It Compare to Other Monitoring Types?
Modern monitoring strategies rely on multiple tools, each observing a different layer of the application stack. Understanding where web transaction monitoring fits is essential for building effective coverage. While tools like page monitoring, API monitoring, and Real User Monitoring (RUM) provide valuable insights, they cannot validate the success of a complete user journey.
Here is how UserView, Dotcom-Monitor’s web transaction monitoring platform, compares to other common monitoring types:
| Monitoring Type | Primary Focus | Real Browser | What It Validates | Where It Falls Short |
| Page Monitoring (HTTP/S) | Basic availability | No | Server response time and HTTP status codes. | Cannot execute JavaScript, interact with page elements, or validate user actions. |
| API Monitoring | Backend endpoint health | No | API latency and response payload correctness. | Has no visibility into the UI, client-side rendering, or browser-specific failures. |
| BrowserView (Web Performance) | Front-end page performance | Yes | Detailed page load and rendering metrics (e.g., Core Web Vitals). | Measures the performance of a single page load, but does not validate multi-step workflows. |
| UserView (Web Transaction) | End-to-end user workflows | Yes | The functional success and performance of a complete user journey. | Requires initial scripting and ongoing maintenance as the application evolves. |
| Real User Monitoring (RUM) | Real-world user behavior | Yes (user’s) | Performance data and errors experienced by actual users. | Is reactive (requires user traffic), cannot proactively detect issues, and may miss problems on low-traffic pages. |
In short, while other monitoring types can tell you if your servers are online or if a single page is loading slowly, only web transaction monitoring can proactively confirm that a user can successfully log in, add an item to their cart, and complete the checkout process. It complements other tools by validating the critical user experience layer that directly impacts business outcomes.
Top 4 Web Transaction Monitoring Use Cases
Web transaction monitoring is most valuable when applied to the real production workflows that users rely on to access services, submit data, and complete transactions. These user journeys often fail in subtle ways that basic uptime or API monitoring cannot detect. Below are practical, field-tested use cases where transaction monitoring provides critical visibility.
Validating Logins, Checkouts, and Form Submissions
Revenue-critical workflows like user authentication and checkout are highly susceptible to silent failures. For example, a front-end deployment might introduce a JavaScript error that prevents the “Place Order” button from activating, even though the page itself loads correctly and all backend APIs report as healthy. A UserView transaction script that simulates the full checkout path—from adding an item to the cart to validating the confirmation message—will detect this failure immediately. Similarly, it can catch broken lead-generation or support forms where the submission hangs indefinitely, preventing silent revenue loss and customer frustration.
Ensuring Functionality of SPAs and Dynamic Applications
Modern Single-Page Applications (SPAs) rely on client-side routing and dynamic DOM updates, making them difficult to monitor with traditional tools. A dashboard application might load successfully, but a broken client-side route could prevent users from navigating between different views, with no page reload or HTTP error to signal the problem. Because UserView executes tests in a real browser, it can validate that these dynamic UI state changes occur as expected, confirming that the application is truly functional, not just that it loaded.
Verifying Application Health After Deployments
Integrating web transaction monitoring into a CI/CD pipeline provides a powerful automated regression test for your user interface. Before and after a new build is deployed, UserView can continuously execute scripts against critical workflows. If a release introduces a front-end regression—such as changing a button’s ID or breaking a key script—the transaction will fail, and the build can be automatically flagged or rolled back. This provides a crucial layer of confidence that backend health checks alone cannot offer, preventing critical bugs from ever reaching production.
Identifying Regional Performance and Availability Issues
Application reliability is inherently geographic. A checkout flow may succeed in North America but fail intermittently in Asia due to a misconfigured CDN, DNS resolution issue, or network latency. By running the same transaction from over 30 global monitoring locations, UserView allows teams to compare performance and success rates by region. This makes it possible to isolate and troubleshoot geographic issues that would otherwise remain invisible until customers complain.
3 Most Common Challenges Web Transaction Monitoring Solves
Even with the best planning, complex web applications present monitoring challenges that require sophisticated solutions. Understanding these challenges—and how to overcome them—is what separates a monitoring setup that generates noise from one that delivers real value.
Script Fragility
In agile and CI/CD environments, frequent UI changes can break monitoring scripts that rely on brittle selectors like auto-generated CSS classes or dynamic element IDs. This is one of the most common reasons teams abandon transaction monitoring. The EveryStep Web Recorder mitigates this by allowing teams to use more resilient selectors, such as visible text content or data attributes, which are less likely to change between deployments. When a script does break, the point-and-click interface makes it fast and easy to re-record only the affected steps without rewriting the entire script from scratch.
Alert Fatigue
Being overwhelmed by notifications for transient, non-critical issues is a real operational risk. When teams receive too many false alarms, they start ignoring alerts altogether—which means they can miss genuine, user-impacting failures. UserView addresses this by allowing you to configure alerts that only trigger after multiple consecutive failures or after confirmation from several geographic locations. You can also set performance thresholds so that minor fluctuations don’t generate noise, ensuring that your on-call engineers are only notified of persistent problems that require immediate attention.
Limited Coverage of Dynamic Content
Many monitoring tools struggle to validate content that loads asynchronously through JavaScript frameworks like React, Angular, or Vue. A page might report as “loaded” while critical UI elements are still rendering in the background. UserView’s intelligent waits automatically handle dynamic elements and AJAX calls, ensuring that scripts only proceed after the page is fully rendered and interactive. This is essential for accurately monitoring modern, JavaScript-heavy applications where the initial HTML response contains little meaningful content.
How to Choose the Right Web Transaction Monitoring Tool?
Selecting the right web transaction monitoring tool is crucial for ensuring comprehensive coverage and actionable insights. When evaluating different solutions, consider the following key capabilities:
| Feature | Importance | What to Look For |
| Scripting Flexibility | High | A tool that offers both a no-code recorder for speed and the ability to edit scripts for complex logic. The ability to handle dynamic content, SPAs, and iframes is essential. |
| Global Reach | High | A wide network of global monitoring locations to accurately simulate user experience from different geographic regions and identify regional performance issues. |
| Diagnostic Quality | High | Rich diagnostic data beyond a simple pass/fail status. Look for video recordings, waterfall charts, and detailed error logs to accelerate root cause analysis. |
| Alerting Intelligence | Medium | Configurable alerting to prevent alert fatigue, including multi-location failure confirmation and performance threshold alerting. |
| Integration Capabilities | Medium | Seamless integration with your existing notification channels (like Slack, PagerDuty, or Teams) and CI/CD tools. |
Beyond these table-stakes features, consider how well the tool fits into your existing workflow. For DevOps and SRE teams, the ability to trigger transaction tests as part of a CI/CD pipeline is a significant advantage, as it turns monitoring into an automated quality gate for every deployment. For organizations with internal applications behind firewalls, the availability of private monitoring agents is essential for extending synthetic monitoring to intranet environments.
Dotcom-Monitor’s UserView platform excels across all of these areas. It combines the easy-to-use EveryStep Web Recorder with a global network of over 30 monitoring locations, best-in-class diagnostic features including video capture and waterfall analysis, and support for both public and private monitoring agents. This makes it a comprehensive solution for modern web application monitoring, whether your applications are public-facing or internal.
How Do You Set Up a Web Transaction Monitor?
Setting up a web transaction monitor in Dotcom-Monitor is a straightforward process designed to get you from zero to monitoring in minutes. The following steps outline the typical workflow using the UserView platform and the EveryStep Web Recorder.
- Select the Platform and Create a Script: Start by opening the EveryStep Web Recorder. Navigate to your web application and perform the sequence of actions you want to monitor, just as a real user would. EveryStep records each click, keystroke, and navigation, converting it into an editable script.
- Refine and Add Validation: Once recorded, you can refine the script. Add validation steps to ensure the application is behaving correctly, such as using a “Keyword Assert” to verify that confirmation text appears on the page. You can also add waits, conditional logic, and other advanced features to handle dynamic content.
- Configure Monitoring Parameters: In UserView, define how the transaction will be monitored. This includes selecting the monitoring locations (from over 30 global checkpoints), setting the monitoring frequency, and configuring timeout and connection behavior.
- Set Up Alerting: Finally, configure your alerting rules. You can trigger alerts based on functional failures, performance threshold violations, or multi-location confirmations. Alerts can be sent to a variety of notification channels to ensure the right team members are notified immediately.
Bottom Line
Dotcom-Monitor’s web transaction monitoring provides deep, real-browser visibility into whether users can successfully complete critical actions—globally, reliably, and at scale. By combining UserView’s real-browser execution, the EveryStep Web Recorder, and a rich suite of diagnostic tools like video capture and waterfall analysis, it uncovers failures that traditional monitoring cannot detect. For any organization that depends on its digital workflows, this capability is a foundational pillar of performance, reliability, and user experience assurance.
References
- [1] Gartner, “Digital Experience Monitoring (DEM),” Gartner Glossary. [Online].
