La transición de IPv4 a IPv6 nunca iba a ser un cambio de la noche a la mañana. En cambio, la industria entró en la era de la red “dual-stack”, una coexistencia a largo plazo donde servidores, aplicaciones y APIs deben servir ambos protocolos simultáneamente de manera confiable.
Cuando los registros regionales de Internet como ARIN (Norteamérica) y RIPE (Europa) agotaron sus bloques restantes de direcciones IPv4 libres, se desencadenó un cambio inevitable. La explosión de despliegues empresariales en la nube y miles de millones de dispositivos de Internet de las Cosas (IoT) convirtieron la adopción nativa de IPv6 en una necesidad estructural más que en una opción para el futuro. Hoy, el costo en el mercado secundario por adquirir bloques escasos de IPv4 sigue aumentando, acelerando el impulso hacia infraestructuras prioritariamente IPv6.
Sin embargo, operar una infraestructura dual-stack introduce puntos ciegos. Si tu estrategia de monitoreo de red solo prueba puntos finales sobre IPv4, estás ciego a lo que un porcentaje cada vez mayor de tu audiencia global realmente experimenta.
Por qué el monitoreo IPv4 no detecta interrupciones en IPv6
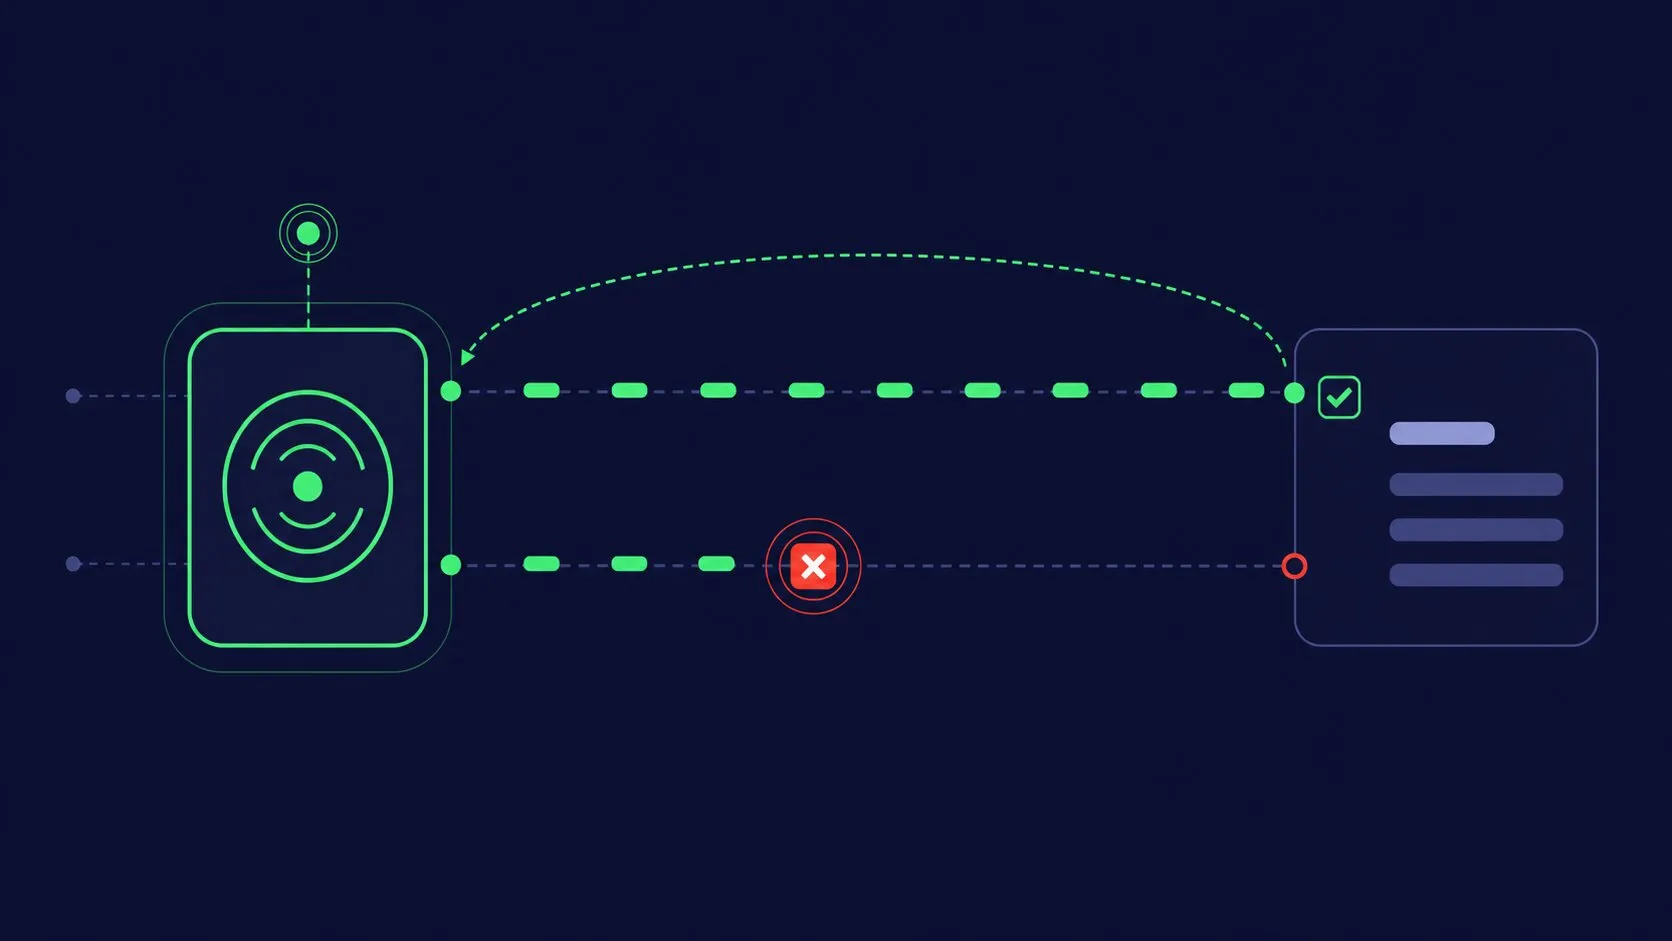
Es un error operacional común pensar que si una aplicación web maneja tráfico exitosamente sobre IPv4, está fundamentalmente saludable. En una configuración dual-stack, IPv4 e IPv6 funcionan como dos planos de enrutamiento completamente separados.
[Cliente Usuario]
│
├── (Ruta de Enrutamiento IPv4) ───► [Cortafuegos/LB IPv4] ───► [Motor de Servidor Saludable]
│
└── (Ruta de Enrutamiento IPv6) ───► [Gateway mal configurado] ───X [Pérdida de Paquetes / Tiempo de Espera]
Una falla en tu ruta IPv6—ya sea causada por un registro DNS AAAA incorrecto, una tabla de enrutamiento no optimizada o una política de cortafuegos que solo fue actualizada para IPv4—causará caídas catastróficas de rendimiento o incluso tiempo de inactividad para usuarios nativos de IPv6. Sin embargo, un chequeo sintético estándar IPv4 seguirá reportando un 100% de tiempo en línea.
Variaciones técnicas que afectan el rendimiento de la red
- Arquitectura de Cabecera y QoS: IPv4 se basa en un modelo de entrega “mejor esfuerzo” donde los routers de tránsito deben abrir y analizar los paquetes con frecuencia. IPv6 simplifica esto mediante una cabecera base fija de 40 bytes e implementa manejo nativo de Calidad de Servicio (QoS) usando un campo de Clase de Tráfico de 8 bits y una Etiqueta de Flujo de 20 bits. Aunque esto hace que el enrutamiento nativo IPv6 sea inherentemente más eficiente, también implica que tu infraestructura de tránsito maneja el tráfico de manera diferente.
- Escala y Alcance: Una sola subred IPv6 es tan masiva como la totalidad del internet IPv4 legado. Gestionar la propagación del enrutamiento y el filtrado de seguridad a esta escala incrementa drásticamente la complejidad.
El peligro de los “fantasmas” de terceros en entornos solo IPv6
Uno de los riesgos más insidiosos para el rendimiento web moderno ocurre cuando tu infraestructura central soporta IPv6 perfectamente, pero tus dependencias de terceros no.
Las aplicaciones modernas dependen en gran medida de recursos externos: Redes de Entrega de Contenido (CDNs), píxeles de seguimiento, repositorios de fuentes, motores analíticos y pasarelas de pago. Cuando un usuario nativo IPv6 interactúa con tu sitio desde un nodo de red solo IPv6, su navegador debe cargar cada recurso a través de una ruta IPv6.
El efecto cascada fragmentado
Cuando los scripts sintéticos cargan una página completa usando un agente de monitoreo solo IPv6, aparece una divergencia clara en comparación con perfiles tradicionales de prueba IPv4:
| Perfil de Prueba | HTML Principal | Recursos Multimedia CDN | Scripts y Seguidores de Terceros | Experiencia de Usuario Resultante |
|---|---|---|---|---|
| Monitoreo IPv4 | Resuelve (Registro A) | Resuelve | Resuelve | Renderizado de página impecable; todos los elementos visuales se muestran normalmente. |
| Monitoreo solo IPv6 | Resuelve (Registro AAAA) | No Resuelve | Tiempo agotado / Caída | Carga parcial de la página: diseños rotos, bloques de navegación ausentes, marcos de recursos vacíos y scripts transaccionales estancados. |
Si un script de terceros o proveedor de recursos no tiene un registro DNS AAAA válido o descarta paquetes IPv6, el navegador del usuario quedará colgado. Intentará resolver el recurso, llegará a un tiempo de espera de conexión y potencialmente bloqueará el resto de la ruta crítica de renderizado. El resultado es una interfaz de usuario rota, formularios de pago incompletos o una experiencia de aplicación completamente detenida, todo mientras tu panel de salud de infraestructura interna muestra indicadores verdes perfectos.
La trampa oculta: “Happy Eyeballs” y el enmascaramiento de la latencia
Los navegadores web modernos intentan mitigar el enrutamiento IPv6 deficiente implementando un algoritmo agresivo de conmutación por error conocido como Happy Eyeballs (RFC 8305).
Cuando un usuario realiza una solicitud, el navegador intenta conectarse simultáneamente por IPv4 e IPv6, dando a IPv6 una pequeña ventaja inicial (generalmente alrededor de 250 milisegundos). Si la ruta IPv6 es lenta, está rota o mal configurada, el navegador cambia inmediatamente su enfoque de nuevo al flujo IPv4 para evitar una falla total de conexión.
Aunque esto protege al usuario de un bloqueo total, crea un grave peligro para el monitoreo:
- Latencia Oculta: El retraso inicial mientras el navegador espera que la ruta IPv6 rota falle añade cientos de milisegundos a tus métricas reales de Tiempo hasta el Primer Byte (TTFB) y Largest Contentful Paint (LCP).
- Degradación Invisible: Tus usuarios sufren una experiencia lenta y degradada, pero porque la conexión finalmente tiene éxito mediante la conmutación a IPv4, las herramientas de monitoreo pasivo no detectan el cuello de botella estructural raíz de la red.
Mejores prácticas para un monitoreo integral en redes dual-stack
Para eliminar estos puntos ciegos, los marcos operacionales modernos requieren un monitoreo sintético dual-stack real externo y verdadero.
IMAGEN
Paso 1. Establecer auditorías base nativas:
Configura chequeos sintéticos simultáneos que ejecuten scripts de monitoreo idénticos sobre nodos puros nativos IPv4 y nodos puros nativos IPv6. Nunca confíes en mecanismos de transición heredados como Teredo o túneles 6to4, que introducen latencia sintética.
Paso 2. Auditar toda la cadena de dependencias de terceros:
Analiza gráficos de cascada de carga completa de página waterfall charts usando un agente solo IPv6. Aísla activamente cada script externo, píxel y archivo multimedia que produzca un tiempo de espera o fallo de resolución, forzando a los socios terceros a soportar registros DNS AAAA apropiados.
Paso 3. Validar la integridad básica de resolución DNS:
Verifica continuamente que tu proveedor DNS autoritativo resuelva con precisión registros A y registros AAAA globalmente con velocidad equivalente. Asegúrate de que tus parámetros TTL (Time to Live) estén ajustados para prevenir entradas de enrutamiento obsoletas durante un cambio infraestructural.
Paso 4. Implementar diagnósticos de red IPv6 automatizados:
Configura disparadores automáticos que ejecuten instantáneamente un Traceroute IPv6 dirigido en el momento en que ocurra una desviación de disponibilidad o rendimiento. Esto aísla si la caída ocurre en tu servidor origen o dentro de la tabla de enrutamiento de algún proveedor de tránsito aguas arriba.
Cómo Dotcom-Monitor resuelve la crisis de visibilidad dual-stack
Dotcom-Monitor proporciona un motor de infraestructura global y nativo construido específicamente para abordar las complejidades de la validación dual-stack. Al colocar nodos de monitoreo dedicados en auténticas infraestructuras nativas IPv4 e IPv6 globalmente, Dotcom-Monitor elimina las conjeturas de la visibilidad de red.
- Pruebas sintéticas de navegador (UserView): Simula transacciones reales complejas de múltiples pasos del usuario—como iniciar sesión o enviar formularios de pago—desde agentes dedicados y nativos IPv6. Esto permite a los equipos de ingeniería detectar dependencias rotas de terceros, fragmentación de diseños y fallos de protocolos antes que impacten a tus clientes reales.
- Validación de infraestructura y protocolo (ServerView): Ejecuta diagnósticos granulares de salud HTTP/S, API y DNS hasta una vez por minuto. Si una ruta IPv6 falla mientras la ruta IPv4 se mantiene limpia, Dotcom-Monitor aísla el error de protocolo específicamente, enviando notificaciones instantáneas y alertas de escalamiento directamente a tu equipo de guardia.
- Reportes detallados de cascada: Visualiza análisis profundos y comparativos del rendimiento entre tus capas de conexión, ayudándote a aislar violaciones de SLA y eliminar anomalías de latencia ocultas.
¿Listo para auditar la salud dual-stack de tu aplicación?
No permitas que scripts de terceros o cuellos de botella ocultos en la red degraden silenciosamente la experiencia de tu audiencia global. Usa el conjunto de herramientas de pruebas externas de Dotcom-Monitor para proteger tu disponibilidad en todos los caminos de conexión.
Comienza una prueba gratuita de 30 días con Dotcom-Monitor para desplegar nodos de prueba nativos IPv6.