VPN Monitoring: Site-to-Site Tunnels and Client-VPN Applications

Monitor every VPN tunnel — and every service protected behind it.
Continuously verify the health, latency, and reachability of your site-to-site VPN tunnels, and synthetically test the internal applications, APIs, and portals that only your client VPN users can reach. Dotcom-Monitor runs checks from the public internet and from Private Agents deployed inside your network — so you know a tunnel is down or an internal app is slow long before a user opens a ticket.
Three floating dark-mode cards on a deep navy background — a site-to-site VPN tunnel status table with one degraded tunnel, a single-tunnel diagnostic with rising RTT and path validation, and a VPN-surface KPI panel showing tunnels monitored, healthy count, internal apps covered, Private Agents deployed, and the latest alert.
10,000+

Organizations Worldwide

99.99%

Platform Uptime SLA

30+

Global Monitoring Locations

Since 1998

Website Monitoring Leader

Synthetic Monitoring for Private Networks

What Is VPN Monitoring?

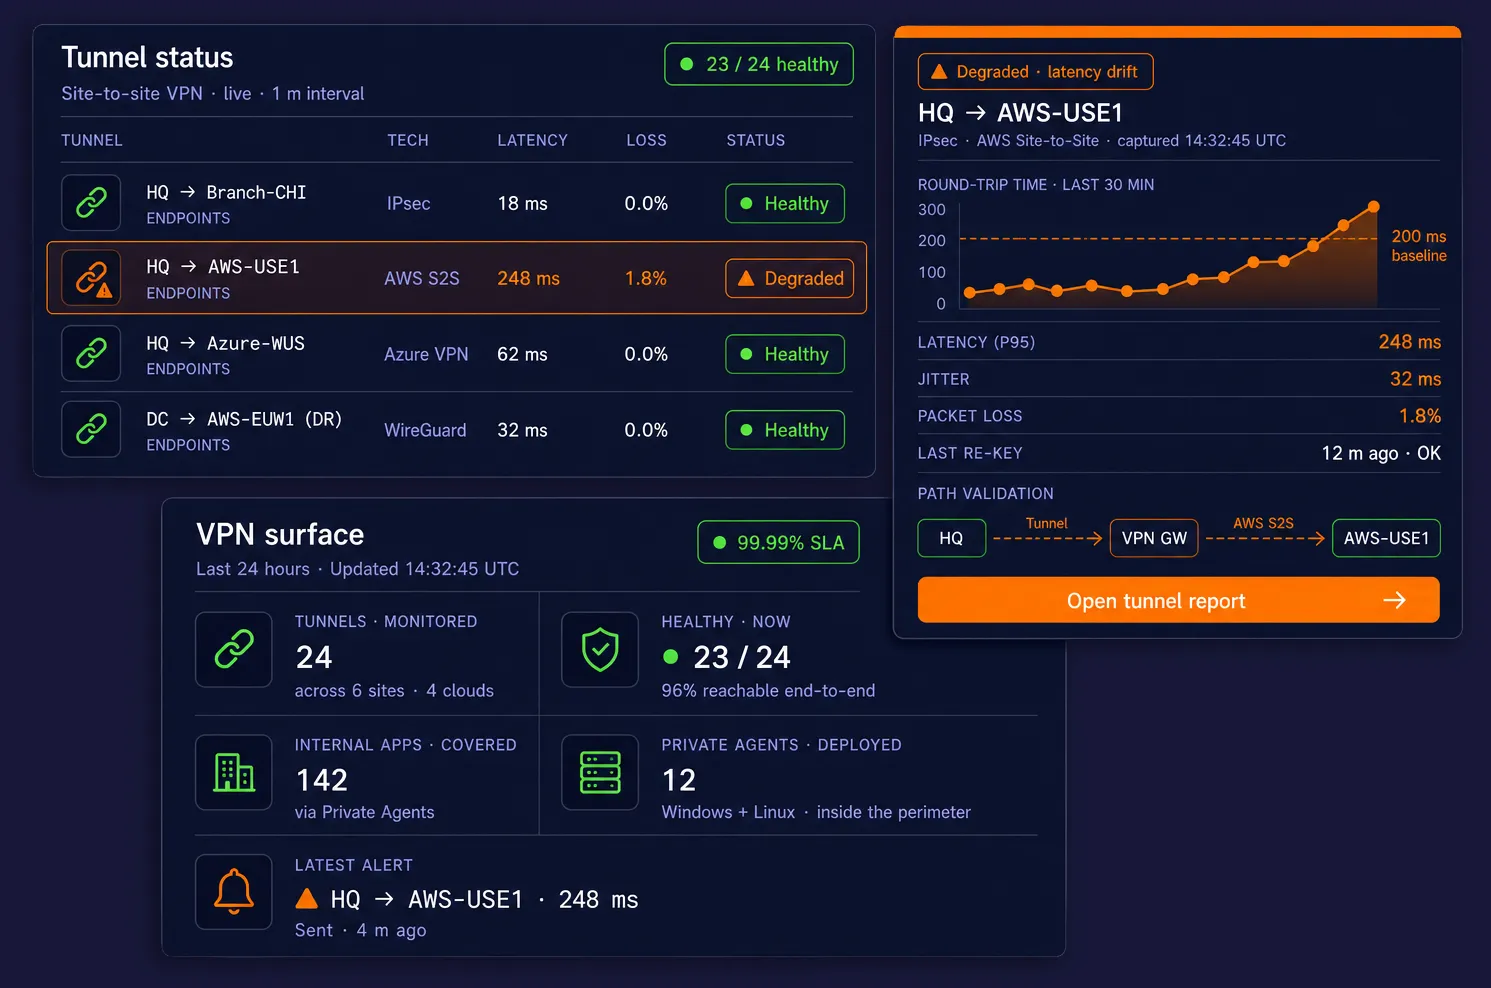
VPN monitoring is continuous, synthetic verification that your VPN-connected infrastructure is up, fast, and reachable — both the tunnels themselves and the services that live behind them. Dotcom-Monitor solves two distinct but related problems with the same platform: checking site-to-site VPN tunnel health between offices, data centers, and clouds, and validating applications protected by client VPN that external synthetic checks can’t reach.

Quick Answer

VPN monitoring is the continuous, automated testing of VPN tunnels and the services that depend on them, so you can detect tunnel drops, latency drift, packet loss, certificate expiry, and application outages before users report them.

It covers two distinct patterns: (1) site-to-site VPN monitoring, which watches IPsec, GRE, DMVPN, WireGuard, or cloud VPN tunnels between offices, data centers, and VPCs; and (2) client VPN application monitoring, which synthetically tests internal web apps, APIs, intranets, and databases that are only reachable when a user is connected to the corporate VPN.

Dotcom-Monitor performs both from a single platform using Private Agents inside your network plus 30+ public monitoring locations worldwide, with 1-minute check frequency, ICMP/TCP/HTTPS/SNMP probes, and alerts over email, SMS, Slack, Teams, PagerDuty, and webhooks.

Site-to-site VPN monitoring watches the tunnel itself. Is the IPsec SA up? Are packets making it from the Chicago office to the AWS VPC? Is round-trip time drifting? Did the firewall fail over and silently drop the tunnel? Dotcom-Monitor continuously pings, port-checks, and HTTP-probes endpoints on each side of every tunnel, so you detect flaps, re-key failures, and latency regressions within seconds.

Client VPN monitoring watches the applications your remote workforce depends on — SharePoint intranets, internal ERPs, Jira, database-backed dashboards, admin portals, licensing servers. These services have no public DNS and no public IP, so a monitor in the public cloud can’t see them. By deploying a Dotcom-Monitor Private Agent inside your network (or inside a machine that holds a client VPN session), the platform runs the same HTTPS, BrowserView, UserView (multi-step script), and MetricsView checks it runs on public-internet assets — and streams the results to your Dotcom-Monitor account.

One platform. One UI. One set of alerts, dashboards, and reports for public sites, SaaS endpoints, VPN tunnels, and everything hiding behind the firewall.

Two Problems. One Platform.

Tunnel layer

ICMP, TCP port, UDP, traceroute, SNMP, BGP reachability

App layer

HTTPS, REST, SOAP, GraphQL, WebSocket, multi-step scripts

UX layer

Real-browser BrowserView & UserView recordings

Where it runs

30+ public monitoring locations + unlimited Private Agents

Alerts

Email, SMS, voice, Slack, PagerDuty, Teams, webhook

Reporting

Live dashboards, SLA reports, XML/CSV/PDF export

Covered VPN Technologies

IPsec

Site-to-site, route-based, policy-based

SSL VPN

OpenVPN, Cisco AnyConnect, GlobalProtect, FortiClient

Modern

WireGuard, Tailscale, ZTNA overlays

Cloud

AWS Site-to-Site, Azure VPN Gateway, Google Cloud VPN

Legacy

GRE, DMVPN, MPLS with IPsec, L2TP

1

Pick the Layer

Tunnel health, internal app, or both.

2

Deploy a Private Agent

Lightweight agent for anything not on the public internet.

3

Configure Checks

Ping, port, HTTPS, browser, or multi-step script.

4

Alert & Report

Slack / PagerDuty on failure, SLA reports on demand.

How It Works, Visually

Two Monitoring Patterns. One Platform.

Whether you’re watching the tunnel between two sites or the applications protected by client VPN, the same Private Agent architecture powers both workflows. Here’s how each pattern looks on the wire.

1

Site-to-Site VPN Tunnel Monitoring

A Private Agent on each side of the tunnel runs ICMP, TCP port, HTTPS, and SNMP checks across the encrypted link. Every result streams back to the Dotcom-Monitor platform over a single outbound HTTPS connection — so you detect tunnel drops, latency spikes, and packet loss within seconds, without opening any inbound firewall rule.

2

Client VPN Application Monitoring

A Private Agent deployed inside the trusted network (or on a host holding a persistent client VPN session) runs HTTPS, BrowserView, and UserView checks against the internal applications your remote workforce depends on. The agent sees exactly what a VPN-connected employee sees — SSO, split-horizon DNS, internal SSL certs, the full login flow.

Core Capabilities

Everything You Need to Prove a VPN Works — End to End

From the cryptographic handshake on the tunnel to the login flow on the internal app behind it, Dotcom-Monitor covers every check the network, ops, and security teams need to run.

Tunnel Reachability Checks

Tunnel Performance Metrics

Internal Web App Monitoring

Real-Browser & Multi-Step Checks

Certificate & Crypto Health

DNS & Name Resolution

Private Agent Deployment

Alerting & Escalation

SLA Dashboards & Reports

How It Works

From Tunnel Blindspot to Full Visibility in Four Steps

Whether you’re monitoring ten site-to-site tunnels between data centers or a handful of internal apps that only remote employees hit, the setup is the same.

01

Map What Needs Watching

List your tunnels (HQ↔AWS, HQ↔Azure, HQ↔branch) and the internal services remote users hit through client VPN. For each, decide whether a public monitoring location can reach it or whether a Private Agent is required.

02

Deploy a Private Agent

Install the Private Agent on a Windows or Linux host inside your trusted network — a VM, a jumpbox, or a dedicated appliance works. The agent opens a single outbound HTTPS session to Dotcom-Monitor. No firewall holes punched.

03

Configure Your Monitors

Create ServerView devices for tunnel pings and port checks, HTTPS or BrowserView devices for internal apps, and UserView scripts for multi-step logins. Assign each monitor to a public location, a Private Agent, or both.

04

Alert, Report, Iterate

Route alerts to Slack, PagerDuty, or your ticketing system. Build dashboards for the NOC. Schedule SLA reports for leadership. Tune thresholds as you learn what normal tunnel latency and app response time actually look like.

Two Approaches, One Platform

Site-to-Site VPN vs. Client VPN Monitoring

The failure modes are different, the monitoring patterns are different, and Dotcom-Monitor supports both natively — managed side-by-side in the same account.

Site-to-Site VPN Monitoring

Continuous health checks across the tunnel between offices, data centers, and clouds.

Primary question

Is the tunnel up, fast, and not losing packets?

Deploy pattern

One Private Agent on each side of the tunnel — or a single agent that probes the remote subnet across it

Recommended checks

ICMP Ping, TCP Port, UDP, Traceroute, SNMP (MetricsView), HTTPS to a known internal endpoint on the far side

Key metrics

Round-trip latency, jitter, packet loss %, tunnel uptime, re-key interval, BGP neighbor state

Typical alerts

Tunnel down > 60s, loss > 2%, latency > baseline + 3σ, SNMP tunnel-state flap

Covered tech

IPsec, GRE, DMVPN, WireGuard, AWS S2S, Azure VPN GW, GCP Cloud VPN, Cisco / Fortinet / Palo Alto / Check Point

Frequency

As tight as 1 minute for critical tunnels

Reports

Per-tunnel uptime %, latency trends, month-over-month SLA evidence

Client VPN Monitoring

Synthetic testing of internal apps that external checks can’t see — from the same perspective as a remote employee.

Primary question

Can my remote workforce actually reach and use the internal app?

Deploy pattern

Private Agent inside the trusted network, or on a host holding a persistent client VPN session, so checks originate from the “inside”

Recommended checks

HTTPS / REST / SOAP / GraphQL, BrowserView (real Chrome), UserView (multi-step login scripts), SSL cert expiry, DNS

Key metrics

Page load time, TTFB, step duration, SSL handshake, HTTP status, keyword match, DOM load

Typical alerts

Login step fails, page load > SLA, 5xx from internal API, cert expires in < 14 days

Covered tech

Cisco AnyConnect, GlobalProtect, FortiClient, OpenVPN, WireGuard, Tailscale, any ZTNA overlay

Frequency

1 to 15 minute intervals depending on criticality

Reports

Per-app uptime, waterfall breakdowns, screenshot & HAR on every failure

Start Monitoring Your VPNs in Under an Hour

Install the Private Agent, point it at the services you care about, and watch every tunnel and every internal app light up in your Dotcom-Monitor dashboard — with real alerts, real SLA reports, and real waterfalls on failure.

Use Cases

What Teams Build with VPN Monitoring

Network, DevOps, and SRE teams use Dotcom-Monitor to turn VPN blindspots into first-class citizens of their observability stack.

Multi-Cloud Tunnel SLAs

Prove the uptime and latency of every IPsec tunnel to AWS, Azure, and GCP — per cloud, per region — and hand the report to finance when they ask why the bill has three VPN gateways on it.

Branch Office Health

Watch every branch-to-HQ tunnel from a single dashboard. Flag the branch that silently drops its tunnel every Tuesday at 3 AM before the store manager calls the help desk.

Intranet & SharePoint Monitoring

Run BrowserView and UserView scripts against your internal SharePoint, Confluence, or ServiceNow instance and catch slow page loads, broken search, and failed SSO before employees escalate.

Internal API Availability

Protect the internal APIs that downstream microservices, partners, or integrations depend on — HTTPS checks with keyword and JSONPath assertions, running every 60 seconds from inside the perimeter.

Remote Workforce Experience

Measure what a VPN-connected employee actually experiences: ERP login, ticketing, time tracking, shared drives. Answer “is it the VPN or is it the app?” with data instead of guesswork.

Internal SSL Cert Expiry

Catch expiring certificates on internal hosts — CA-issued or self-signed — weeks before they expire. No more Monday-morning outages because an admin portal’s cert rolled over on Saturday.

Data Center to DR Site

Verify the primary-to-DR replication tunnel is healthy and latency-stable every minute. Detect silent brownouts that would turn a failover test into a failover failure.

Legacy App Gating

Older on-prem apps with no built-in health endpoint get synthetic coverage through ServerView port checks and UserView login scripts — without touching the application.

Compliance & Audit Evidence

Generate timestamped, scheduled SLA reports for SOC 2, ISO 27001, and internal audit — proving that VPN-protected services met availability commitments across every measured period.

Failure Modes You Can't See From the Outside

The Things Only VPN Monitoring Catches

A public-internet uptime check will never tell you about these. A Dotcom-Monitor Private Agent watching from inside your network will.

Failure
What Users Experience
How Dotcom-Monitor Detects It
IPsec SA expiry / re-key failure
Tunnel silently drops; traffic blackholes
ICMP / TCP checks across the tunnel fail; alert in under 60s
Firewall failover without session sync
Existing tunnel sessions break; new ones reconnect but slowly
Spike in latency + intermittent loss on ServerView checks
BGP neighbor flap
Routes withdrawn; subnet unreachable through tunnel
TCP port check to remote host fails; SNMP BGP state flags down
MTU / fragmentation issues
Small pings work, large payloads hang
HTTPS checks to internal apps fail or stall on download
Internal SSL certificate expired
Browser trust warnings on intranet
HTTPS monitor reports cert days-until-expiry + hard fail
Split-horizon DNS drift
Users resolve wrong IP — public instead of internal
DNS task validates expected record from inside the VPN
Internal SSO / MFA broken
Login loop; users can reach the page but can’t authenticate
UserView multi-step script fails at the auth step with screenshot
Intranet slow under backup window
Pages take 20+ seconds during nightly backups
BrowserView baselines normal load time and alerts on deviation
VPN concentrator CPU saturation
Login queue builds; new tunnels can’t establish
MetricsView SNMP polling alerts on CPU / session-count thresholds
Private DNS or NTP service down
Cascading auth and cert-chain failures across internal services
ServerView DNS + NTP tasks run on a Private Agent inside the network

Every check can be filtered, grouped, and reported on by site, tunnel, Private Agent, department, or schedule.

Why Teams Choose Dotcom-Monitor for VPN Monitoring

Built for Network Ops, DevOps, and SRE Together

One platform for public sites, SaaS endpoints, VPN tunnels, and everything protected behind them — so every team is reading from the same source of truth.

Zero Inbound Exposure

Private Agents make a single outbound HTTPS connection. No firewall holes, no VPN back into your network, no inbound rules to get past InfoSec.

Sub-Minute Detection

Check frequency as tight as 1 minute on tunnels and critical apps — so you know a tunnel dropped before the pager call from a user.

Every Protocol, One Agent

The same Private Agent runs HTTPS, REST, SOAP, GraphQL, WebSocket, BrowserView, UserView, ServerView, and MetricsView.

Public + Private in One View

Correlate a public-internet degradation with an internal app symptom in a single dashboard. Triage stops being a war-room guessing game.

Audit-Ready SLA Reports

Scheduled PDF / Excel exports prove every VPN-protected service met its availability commitment — for SOC 2, ISO 27001, and internal governance.

Alerts Where You Already Live

Slack, Microsoft Teams, PagerDuty, OpsGenie, ServiceNow, Jira, webhooks, email, SMS, voice call — with on-call rotation and escalation built in.

Unlimited Private Agents

Deploy one agent per site, per DC, per VPC, per cloud region. No per-agent licensing — the plan is priced on monitors, not machines.

Automate Everything

Provision monitors from Terraform, GitHub Actions, Jenkins, or any CI/CD pipeline via the Dotcom-Monitor REST API. No UI clicks required.

What Our Customers Say

"We had a site-to-site tunnel between our data center and AWS that would silently drop every few weeks at 3 AM. Public uptime checks showed everything was fine. A Dotcom-Monitor Private Agent pinging across the tunnel caught it within a minute and paged the right on-call. It paid for itself the first time it fired."
Network Engineering Lead
Financial Services · Verified customer

See Your VPNs Like Dotcom-Monitor Sees Them

Every 30-day trial includes unlimited Private Agents, every monitoring platform, every global location, and every integration. Stand up the agent, point it at a tunnel, watch the first data come in.

Frequently Asked Questions

Common Questions About VPN Monitoring with Dotcom-Monitor

VPN monitoring is the continuous, synthetic testing of virtual private network tunnels and the applications that depend on them. It answers three questions on a schedule: Is the tunnel up? Is it fast enough? And can the services behind it actually be reached from the users and locations that need them? Modern VPN monitoring combines ICMP and TCP probes for tunnel reachability, SNMP polling of firewall and VPN-concentrator metrics, and HTTPS / browser-level checks against internal applications — all executed from inside the network by a Private Agent, or from across the public internet by distributed monitoring locations.

Because VPNs are almost always on the critical path for remote work, branch connectivity, and hybrid-cloud traffic — and because they fail silently. A site-to-site tunnel can stay “up” in the firewall UI while dropping packets, re-keying constantly, or routing over a degraded ISP. A client VPN can authenticate users successfully while the intranet app behind it returns 500s. Without dedicated VPN monitoring, these failures are only discovered when users complain. Continuous synthetic VPN monitoring surfaces tunnel drops, latency regressions, certificate expirations, split-horizon DNS drift, and internal-application outages in seconds — before they become support tickets or SLA breaches.

You monitor a VPN connection by placing a monitoring probe on each side of the tunnel — or at least on one side with a known test target on the other — and running scheduled checks end-to-end. With Dotcom-Monitor: (1) install a Private Agent inside the network (Windows or Linux, ~5 minutes), (2) create ServerView tasks for ICMP ping, TCP port checks, and traceroute across the tunnel, (3) add HTTPS or BrowserView tasks against an internal application to validate end-to-end usability, and (4) optionally add MetricsView SNMP polling against the VPN concentrator for tunnel counters and throughput. Results stream back over a single outbound HTTPS connection — no inbound firewall rules required.

Combine four layers: reachability (ICMP ping to a stable host on the far-side LAN every 60 seconds), path validation (traceroute confirming the route traverses the tunnel and not a fallback internet path), service checks (TCP port or HTTPS probes against a real service on the remote subnet), and device telemetry (SNMP polling of the VPN gateway for tunnel state, packets in/out, CPU, and session count). Alert on both hard failures and trend thresholds — a tunnel whose latency has doubled over 24 hours is just as actionable as one that went down. Dotcom-Monitor delivers all four from one agent, one UI, and one set of alerts.

The metrics that correlate with actual user impact are: tunnel up/down state, round-trip latency (ms), jitter (variation in latency), packet loss percentage, tunnel re-key frequency, throughput in/out, active session count, HTTPS response time for internal applications, TLS certificate days-until-expiry for internal certs, and DNS resolution time against internal resolvers. Dotcom-Monitor captures all of these natively through ServerView (reachability), MetricsView (SNMP), and BrowserView (application-level).

Dotcom-Monitor pricing is based on the number of monitored targets and check frequency, not the number of VPN tunnels, Private Agents, or monitoring locations. Private Agents are unlimited on all paid plans, so you can deploy one per site, VPC, or cloud region without additional cost. A 30-day full-access free trial with no credit card is available, which lets you monitor real tunnels and internal apps end-to-end before committing. For a precise quote tied to your tunnel and app inventory, request a demo.

You can get partial coverage, but not end-to-end coverage. SNMP tells you what the VPN gateway thinks is happening (tunnel up, sessions active, bytes transferred) — which is valuable but misleading when the device is healthy while packets are being black-holed downstream. Nagios and other self-hosted tools can run ICMP and HTTP checks, but require you to build, host, patch, and scale the monitoring infrastructure yourself, and rarely include browser-level or multi-step transaction testing. Dotcom-Monitor combines SNMP, ICMP, TCP, HTTPS, and real-browser checks in one SaaS platform, with 30+ external monitoring locations plus unlimited Private Agents — so you see both what the gateway reports and what users actually experience.

A Private Agent is a lightweight Windows or Linux service that runs inside your trusted network. It receives monitoring jobs from the Dotcom-Monitor platform over a single outbound HTTPS connection, executes them from inside the perimeter, and streams results back. You need one whenever the target isn’t reachable from the public internet — which covers most site-to-site VPN endpoints and virtually every client-VPN-protected application. No inbound firewall rules required.

The most reliable pattern is to place a Private Agent on each side of the tunnel (or at least on one side with a known test IP on the remote side) and configure ServerView tasks: ICMP Ping to the far-side LAN, TCP port checks to a service on the remote subnet, traceroute to confirm the path traverses the tunnel, and SNMP polling on the firewall / VPN concentrator via MetricsView. Add an HTTPS check against a known internal endpoint on the far side as a functional end-to-end test. Alert when any of these fail or when latency / loss exceeds your baseline.

Deploy a Private Agent on a host that either sits inside the network the client VPN routes into, or holds a persistent client VPN session itself (for example, a Linux VM running OpenVPN or WireGuard as a client). The agent will execute HTTPS, BrowserView, UserView, and ServerView tasks against the internal application exactly as a remote user would see it — including SSO, MFA, split-horizon DNS, and internal SSL certificates.

Yes. Dotcom-Monitor is VPN-technology-agnostic — it monitors the result of the tunnel, not the tunnel’s control plane. It works with IPsec (site-to-site, route-based, policy-based), GRE, DMVPN, MPLS with IPsec, WireGuard, Tailscale and other ZTNA overlays, OpenVPN, Cisco AnyConnect, Palo Alto GlobalProtect, Fortinet FortiClient, and all the major cloud VPN gateways (AWS Site-to-Site, Azure VPN Gateway, Google Cloud VPN).

Yes — ICMP Ping tasks in ServerView report round-trip time, jitter, and packet loss percentage for every check run. You can also pull higher-fidelity metrics (tunnel session counts, throughput, CPU) directly from your firewall or VPN concentrator via SNMP using MetricsView. Both are visualized in dashboards, alerted on, and available through the XML Reporting Service for export to Grafana or Power BI.

Dotcom-Monitor handles both. HTTPS monitors running on a Private Agent will validate internal certificates (CA-issued or self-signed, with the root installed on the agent host) and alert on days-until-expiry. DNS tasks can target your internal resolvers specifically, so you can confirm that an internal hostname resolves correctly from the VPN side and detect split-horizon drift between external and internal answers.

No — Private Agents are unlimited on all paid plans. Deploy one per site, data center, VPC, or cloud region as your topology requires. Dotcom-Monitor pricing is based on the number of monitors you run, not the number of agents or locations you run them from.

As often as every 60 seconds on most platforms, and as tight as 1 minute for ServerView tunnel checks. High-frequency monitoring gives you sub-minute detection of tunnel drops and brownouts. For less critical services you can run checks every 5, 15, or 30 minutes to conserve check quota.

Every device can route to one or more alert groups. Supported channels include email, SMS, voice call, Slack, Microsoft Teams, PagerDuty, OpsGenie, ServiceNow, Jira, and arbitrary webhooks. Alert groups support on-call rotation, escalation policies, quiet hours, and filtering — so a flapping tunnel at 3 AM pages the right person, not the whole team.

Yes. Every object in the platform — devices, tasks, groups, schedules, alerts, locations, Private Agents — is manageable via the Dotcom-Monitor Web API. Teams commonly wire it into Terraform, Pulumi, Jenkins, GitHub Actions, Azure DevOps, and GitLab CI so that monitors for a new tunnel or internal app are provisioned the moment the infrastructure is.

Public uptime checks can only see what’s on the public internet. They can’t see a dropped site-to-site tunnel, a slow intranet, an expired internal cert, or a broken SSO flow on a VPN-protected app. Dotcom-Monitor is unique in combining the public-internet perspective (30+ monitoring locations worldwide) with the insider perspective (unlimited Private Agents) in a single platform, a single UI, and a single reporting pipeline.

Most customers go from account creation to first alert in under an hour. Installing the Private Agent is a standard Windows service or Linux package install. Configuring monitors is done in the UI or via the REST API. The platform is fully SaaS — no servers to stand up, no back-end to maintain, no license keys to reconcile.

Your VPN Is Only as Reliable as You Can Prove It Is.

Join 10,000+ organizations using Dotcom-Monitor to catch failures before users do — on the public internet, across every VPN tunnel, and deep inside every private network.