 Modern web applications have shifted their center of gravity. The page is no longer the system— the runtime is. Frameworks like React, Angular, Vue, Next.js, SvelteKit, Remix, and Nuxt treat HTML as a bootloader, and the real application emerges only after hydration, routing, data fetching, and continual re-rendering. What users experience depends entirely on JavaScript execution, not static markup.
Teams usually discover this shift when the UI appears to load but nothing works. Buttons do nothing, panels stay empty, and flows break without any obvious server-side error. The router—not the page—is what determines whether the application is actually usable, yet most monitoring tools never observe it.
If you rely on page-centric monitoring for SPA, CSR, SSR, or hybrid architectures, you are watching the shell instead of the application. This article lays out how to monitor routing-driven systems properly, and why synthetic flows and RUM must follow the runtime rather than the initial HTML.
Monitoring After the Page Load
In a multi-page app, the page lifecycle was the application lifecycle. You measured load time, DOM readiness, errors, and server responses. The dependencies were stable and visible.
Client-side routing breaks that assumption. The first load is only one of many loads. Real failures now occur in states that browsers do not reset: dynamic component trees, accumulated store data, fetch caches, route guards, feature flags, and transitions between one logical “page” and another without a URL reload. If your monitoring stops at DOMContentLoaded, you miss 90% of the runtime.
The operational question becomes: how do you measure an application that no longer “starts over” when the user changes screens?
The answer is: you follow the router.
Why Client-Side Routing Breaks Traditional Monitoring Models
Routing frameworks intercept navigation events, render new views in place, and make asynchronous calls to remote services. The URL may change, or it may not. The DOM may partially update, or it may re-render entirely. There is no concept of “page complete.” There is only “view mounted,” “data resolved,” and “store updated.”
Traditional uptime checks assume:
- A fresh page load.
- A deterministic HTML response.
- A complete DOM before interaction.
None of those assumptions survive in SPA/CSR architectures. A route transition can fail while the URL appears valid. A component can mount while its data layer is broken. A feature flag service can return different payloads for different personas, leading to wildly inconsistent rendering that synthetic monitors must detect—not ignore as “transient.”
Monitoring becomes behavioral instead of document-based. You can no longer check a URL, instead you must validate an experience.
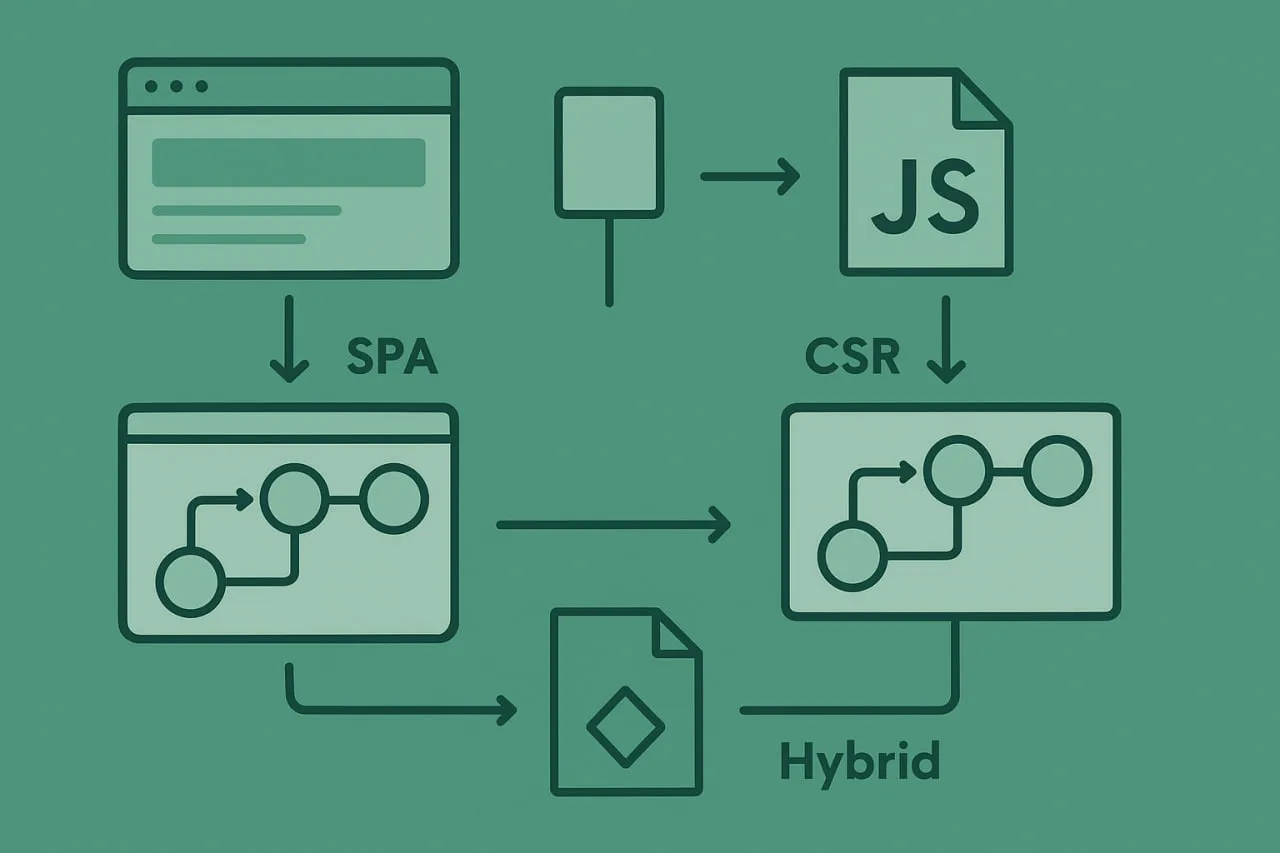
The Architectural Spectrum: SPA, CSR, SSR, SSG, and Hybrid
Web development has splintered into a spectrum of rendering models:
- Pure SPA/CSR loads a single HTML page and hands everything over to JavaScript. Navigation is entirely client-driven. UserView-style monitoring must understand execution, not pages.
- SSR frameworks (Next.js, Nuxt, SvelteKit) bring back a server-rendered first load but use client-side routing for subsequent navigation. The result: the first paint behaves like an MPA, but every interaction after behaves like an SPA.
- SSG and ISR produce static HTML upfront, but hydration still dictates whether the application works. Static pages can look correct while their hydrated components fail silently.
- Hybrid models mix modes per route or per environment. A logged-out user may get SSR. while a logged-in user may get CSR.
The architecture influences only the first render. Monitoring must focus on the runtime that follows.
Real Failure Modes in SPA/CSR Applications
Routing-driven applications introduce an entirely new category of failures that traditional monitors never see.
Hydration failures are common: the HTML shell renders, but the JavaScript encounters a mismatch between server-rendered markup and client-rendered markup. The app looks alive but is frozen.
Router initialization failures appear when route definitions conflict, lazy modules fail to load, or the router cannot resolve the current state. The user sees a functional chrome but no content.
State-store corruption arises when Redux, Vuex, NgRx, Zustand, or other stores carry malformed state across navigations. Since SPAs accumulate state instead of resetting it, failures appear deep into multi-step flows—precisely where most monitors stop measuring.
Silent API failures occur when the router successfully navigates, but the data layer returns 500 or 403 responses. The view loads but shows incomplete or empty widgets. Monitoring must know this is a failure, not a degraded success.
Stale bundles are a constant threat. CDNs frequently serve outdated JS, causing version mismatches that crash hydration or routing. These failures differ per region, which synthetic monitoring is uniquely suited to detect.
Each of these failure modes happens after the page load. Most occur only after a sequence of user actions. If your monitoring models do not include multi-step synthetic flows, you will not see them until users complain.
Measuring Navigation in Routing-Heavy Frameworks
Navigation success in SPAs cannot be determined by waiting for the DOM to settle. The runtime never settles.
Instead, monitoring must measure:
- Time from user action (click/tap) to routed view.
- Component mount completion, not document readiness.
- Data resolution—did the necessary XHR/fetch calls complete, and did the UI consume them?
- UI confirmation—did the page actually render the expected interactive state?
“Load time” metrics become meaningless. What matters is transition latency, hydration completeness, and data dependency integrity.
A monitor must observe the timeline of the user journey instead of the lifecycle of the document.
Synthetic Monitoring for Multi-Step Routing Flows
Monitoring routing-driven applications requires full browser execution, not lightweight HTTP checks. Route transitions don’t behave like page loads, and even many scripted browser tests fail because they assume predictable URL changes or static DOM states. A synthetic flow has to behave like an actual user: it must click, navigate, and interact in ways that cause the router to fire. It also has to recognize router events even when the URL stays the same, track the DOM as it mutates in response to component updates, and follow the asynchronous work that each transition triggers.
Most importantly, a test must confirm that the UI actually reaches the expected state. That means watching the data layer resolve, waiting for the mounted components that depend on it, and verifying the rendered interface rather than timing a document load. This is the only reliable way to know whether a routed view is complete and functional.
Failures often hide between steps. A SPA may navigate successfully several times before accumulated state, memory pressure, or a route-guard edge case finally breaks the flow. These are the issues that users encounter but simple monitors never see. That’s why synthetic monitoring for modern frontends must model realistic sequences instead of isolated interactions, and why routing-aware testing has become essential infrastructure rather than a convenience.
Monitoring the API Layer Behind the Router
SPAs treat the backend as a constellation of microservices. Navigation triggers API calls to:
- GraphQL endpoints
- REST services
- Search and recommendation engines
- Feature flag services
- Personalization endpoints
- Authentication and authorization layers
The router may succeed while the underlying APIs fail. From a user’s perspective, the application is broken even though the shell loads.
Monitoring must correlate route success with service success. If the UI loads a component but fails to populate it because an API responded slowly or incorrectly, the synthetic flow must treat that as a failure. Otherwise, monitoring paints a green dashboard while users are stuck on half-rendered screens.
The Cache, CDN, and Bundle Dimension
Routing-driven applications rely far more heavily on CDNs and asset pipelines than traditional server-rendered sites, and the stability of the entire experience depends on bundle integrity. When caching rules are misconfigured, when ETags or version hashes drift, or when a CDN region serves an outdated chunk, the router can break even while the server continues returning 200-OK. These failures aren’t theoretical—they show up as hydration mismatches between the HTML and the JavaScript, as pages that load the correct shell but execute the wrong bundle, and as lazy-loaded modules that fail because their corresponding chunk no longer matches the current build.
These issues rarely appear uniformly across the globe. One region may receive fresh assets while another lags by minutes or hours, creating inconsistent behavior that only some users experience. And because SPAs depend on a warm runtime, many of these failures reveal themselves only after a sequence of navigations, not during a clean first load.
Monitoring must be able to surface these inconsistencies. A single-region test or a synthetic check that always begins with a cold page load will miss the majority of CDN-related routing failures. Only multi-region, stateful synthetic flows provide a reliable guardrail, because they expose the bundle and cache behavior users actually see—not the simplified version monitoring tools often assume.
Monitoring SSR and Hybrid Frameworks Properly
SSR introduces a common blind spot: the server-rendered HTML looks correct, so teams assume monitoring is complete. But SSR is only half of the framework. Hydration must succeed before user interactions become available. If hydration fails, the page is an inert postcard.
Monitoring must separate:
- SSR performance and availability
- Hydration completeness
- CSR navigation performance
- Warm navigation stability
Hybrid frameworks complicate it further. A single route may behave differently depending on authentication state, geolocation, AB testing assignments, or feature-flag variations.
This means synthetic monitoring must evaluate multiple personas. A single login flow is insufficient. A single route path is insufficient. Hybrid frameworks shift behavior under your feet, and the monitor must walk all the paths users might.
Synthetic Monitoring Strategies That Actually Work for SPAs
Effective monitoring adopts a behavioral, runtime-driven model.
You simulate user interactions that drive the router rather than measuring what the server sends. You wait for visible outcomes rather than DOM readiness. You observe API calls automatically rather than manually. You treat missing widget content as a failure rather than an acceptable partial success.
Monitors that capture console logs reveal hydration errors, router crashes, and failed dynamic imports. Tools that track XHR/fetch events reveal data failures hidden behind successful navigation. Assertions on rendered UI ensure that the application behaves as the user expects, not merely as the server responded.
Monitoring becomes a lens into runtime correctness, not page correctness.
RUM + Synthetic: A Combined Visibility Model for Routing Frameworks
RUM (Real User Monitoring) provides organic, real-world performance data. It surfaces regional degradation, device disparities, long-tail latency, and user behavior patterns.
Synthetic monitoring provides deterministic workflows, consistent regression detection, and controlled conditions.
Routing-driven applications require both.
RUM alone cannot detect future regressions. Synthetic alone cannot capture real-world variability. Together, they form the complete monitoring surface for SPAs and hybrids:
- Synthetic finds breakages early.
- RUM confirms the impact.
- Synthetic reproduces the issue.
- RUM validates the fix.
This virtuous cycle is essential for complex frontends that shift behavior dynamically.
Version Drift, Release Velocity, and the Role of Synthetic Monitoring
Modern frontend build pipelines produce new versions constantly, and deployment systems often distribute those versions unevenly. A CDN edge may take minutes to purge a stale asset, while an ISR page may regenerate at different intervals, and a rollout may expose a new bundle to only a percentage of users. In this environment, two people loading “the same page” may in fact be running incompatible builds of the application.
Synthetic monitoring becomes the stabilizing force in this landscape. It reveals when the HTML and JavaScript no longer match, when an edge region serves outdated bundles, when feature flags activate in unexpected combinations, or when lazy-loaded modules point to missing or invalid chunks. These are not edge cases—they are routine artifacts of high-velocity frontend development. Version drift is one of the most common causes of hydration failures, routing errors, and inconsistent rendering. Only synthetic tests exercising the real application, in real browser environments, consistently expose these issues before users do.
A Model Monitoring Blueprint for CSR/SPA/SSR Applications
A robust monitoring strategy for routing-driven applications cannot rely on a single type of check. It needs layers. At the highest frequency, you validate whether the runtime boots and whether the router initializes correctly. At a moderate cadence, you exercise key navigational paths and confirm that core views render with the expected data attached. Deeper workflows run less often but simulate complete user journeys, revealing how state behaves across sequences of transitions rather than on isolated screens.
API monitoring must sit alongside this, because routing succeeds only when the underlying services deliver consistent responses. Asset integrity checks complement it by ensuring that bundles, chunks, and CDN-served artifacts belong to the same build lineage. And persona-based testing rounds out the blueprint by capturing the routing variations introduced by authentication, roles, locales, and feature flags. The combination produces operational visibility across the entire runtime rather than a narrow view of the initial load.
How Dotcom-Monitor Supports Routing-Aware Monitoring
Routing-driven applications require monitoring that captures behavior rather than snapshots of markup. That is the lens we use at Dotcom-Monitor. Our browser-based tests evaluate applications the same way users do by following route transitions, observing async data flows, and validating that components become interactive after hydration. Because we run from multiple geographies and device profiles, we uncover CDN drift, network-sensitive routing issues, and the subtle failures that appear only after several navigations.
Our workflow scripting models real user journeys across authenticated and unauthenticated paths, which allows us to expose routing and state issues that page-bound checks never see. We focus on the runtime itself—the router, the data layer, and the evolving state of the application—because that is what defines modern frontend reliability. For SPA, CSR, SSR, and hybrid architectures, this depth of visibility is now a requirement, not an enhancement.
Conclusion: Monitoring the Runtime, Not the Page
Client-side routing has permanently changed how the web behaves. The application no longer restarts on every navigation. Failures do not present as broken pages—they present as broken behaviors. Monitoring must evolve to meet this shift.
The tools that measure page loads, static DOM trees, or server responses cannot represent the behavior of modern SPAs, SSR, and hybrid architectures. Monitoring must follow the router, the state layer, the bundle graph, and the data dependencies that define the real user experience.
The future of monitoring is runtime-aware. It is behavioral, route-driven, version-sensitive, and deeply integrated with how frameworks execute. Organizations that continue to monitor only the first paint will maintain dashboards that say “green” while users stare at blank panels.
Routing frameworks moved the complexity from the server into the browser. Monitoring must move with it.
