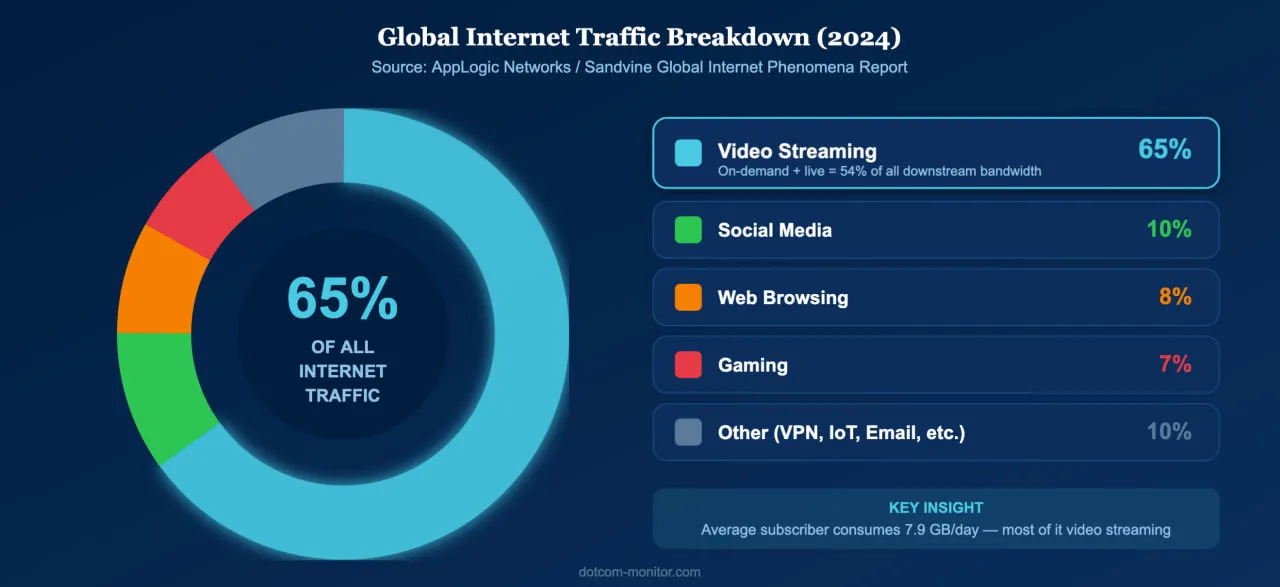
Video is the single largest driver of internet traffic worldwide. According to the Sandvine Global Internet Phenomena Report, video accounts for 65% of all internet traffic, with on-demand streaming alone consuming over half of all downstream bandwidth on fixed networks. In the United States, households spend nearly five hours per day streaming content, and 94.6% of internet users worldwide watch online video monthly. Yet behind every smooth playback experience is a fragile chain of encoding, delivery, and rendering — and when any link breaks, viewers leave.
That is where streaming video monitoring becomes essential. By continuously testing video and audio streams from multiple global locations, organizations can detect buffering events, playback failures, and quality degradation before they drive audiences away.
Why Streaming Video Quality Can’t Be an Afterthought
Streaming now dominates internet traffic, and even brief quality issues cause measurable viewer loss and revenue damage.
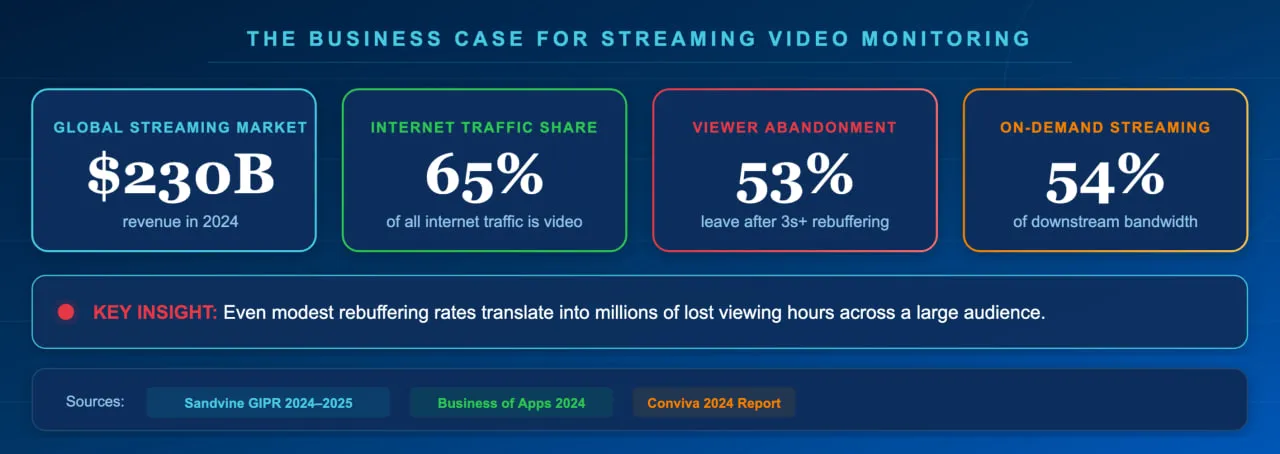
The scale of streaming in 2026 is staggering. Nielsen reports that streaming captured 44.8% of total U.S. television viewing in May 2025, surpassing cable and broadcast combined. The global video streaming industry generated over $230 billion in revenue in 2024, according to Business of Apps, and continues to grow. Connected TV streaming reached 96.4 million U.S. households in 2025, and the live streaming market is forecast to reach $345 billion by 2030.
With this much at stake, quality failures carry a significant financial and reputational cost. Research from Mux shows that viewers tolerate very little buffering before abandoning — many leave after a single rebuffering event lasting more than two seconds. Akamai’s analytics found that each instance of rebuffering results in roughly a 1% viewer abandonment rate, which for a major broadcaster handling 370 million video plays per year translated to nearly 500,000 lost viewing hours and $85,000 in lost ad revenue per rebuffering instance. Industry best practice is to keep the rebuffering ratio — the percentage of viewing time spent buffering — below 1%, with top-performing platforms targeting 0.5% or less.
For any business that depends on streaming media — whether for entertainment, education, live commerce, or internal communications — proactive monitoring is not optional. Even modest rebuffering rates translate into millions of lost viewing hours across a large audience.
Key Streaming Quality Metrics Every Business Should Track
Track connection time, buffering time, rebuffering ratio, frame rate, bitrate, and exit-before-video-start rate to cover the full viewer experience.
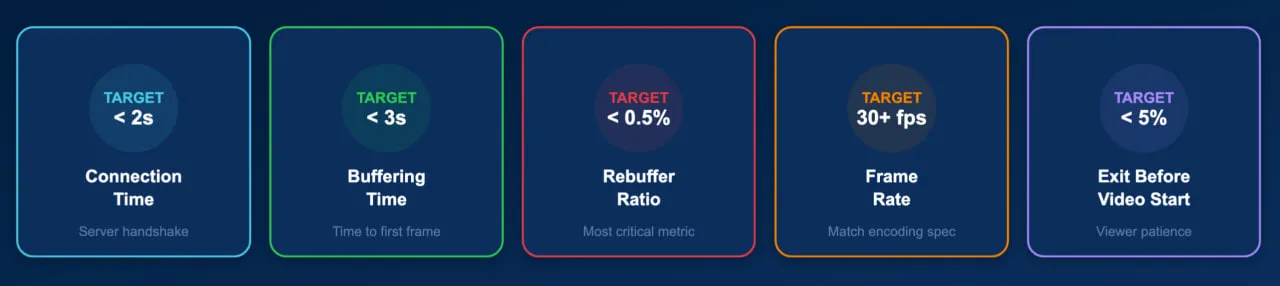
Effective streaming video monitoring breaks video playback into a set of measurable quality-of-experience (QoE) metrics. Each metric isolates a different stage of the viewing experience, from initial connection to sustained playback quality.
| Metric | What It Measures | Target Threshold |
|---|---|---|
| Connection Time | Time to establish a connection with the media server | Under 2 seconds |
| Buffering Time | Initial delay before playback begins (time to first frame) | Under 3 seconds |
| Rebuffering Ratio | Percentage of viewing time spent waiting for content to load mid-playback | Below 1% (target 0.5%) |
| Frame Rate | Number of video frames displayed per second — drops cause visible stuttering | 24–60 fps (content-dependent) |
| Bitrate | Data throughput during playback — higher bitrate means higher visual quality | Stable at expected encoding level |
| Average Bytes per Second | Raw data transfer rate; detects bandwidth throttling or CDN issues | Consistent with stream encoding |
| EBVS (Exit Before Video Start) | Percentage of viewers who leave before the video begins playing | Below 5% |
| Playback Failure Rate | Percentage of attempted plays that fail entirely | Below 1% |
These metrics are interconnected. A slow connection time increases buffering time, which raises the EBVS rate. A CDN failure might not cause a complete playback error but could force the adaptive bitrate player to drop resolution dramatically, degrading the viewer experience even though the stream technically plays. Comprehensive monitoring tracks all of these dimensions simultaneously.
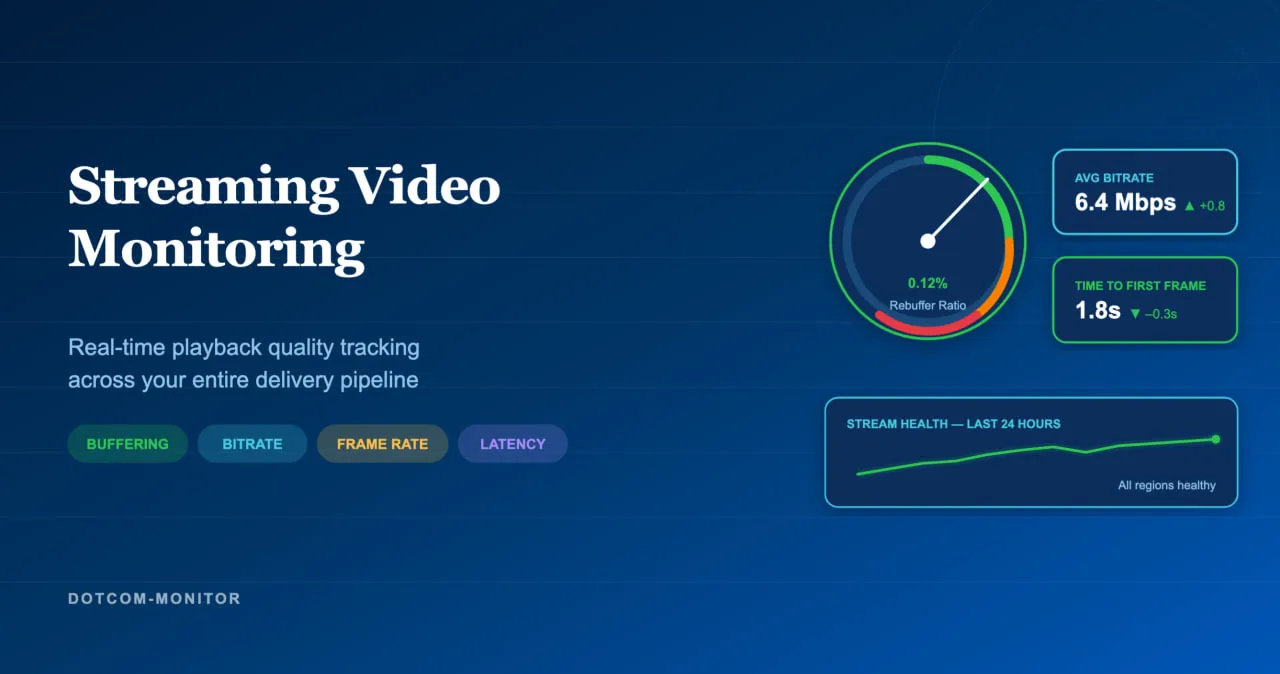
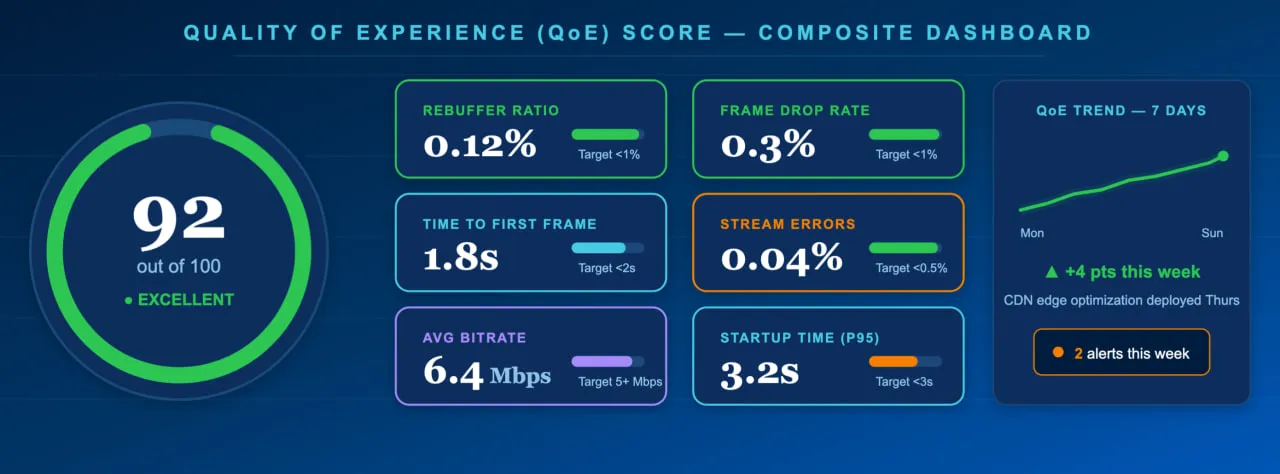
In practice, leading streaming teams roll up these individual metrics into a single composite Quality of Experience (QoE) score that makes it easy to spot problems at a glance. Here’s what a healthy QoE dashboard looks like:
How Streaming Video Monitoring Works
A monitoring agent connects to your media server from global locations, buffers and plays the stream for 30 seconds, then reports quality metrics and errors.
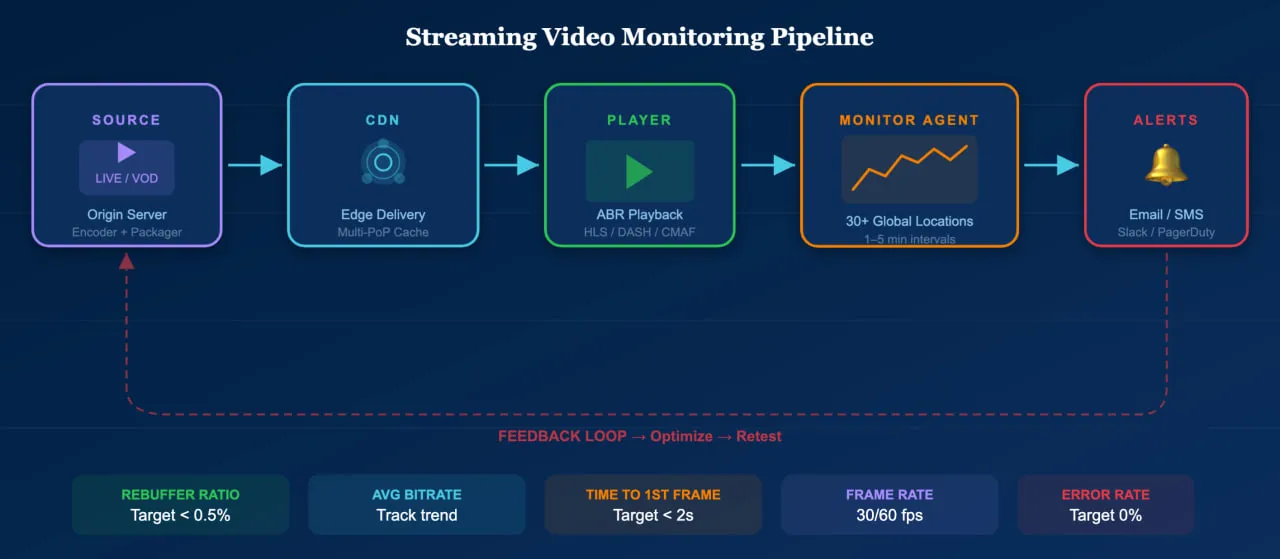
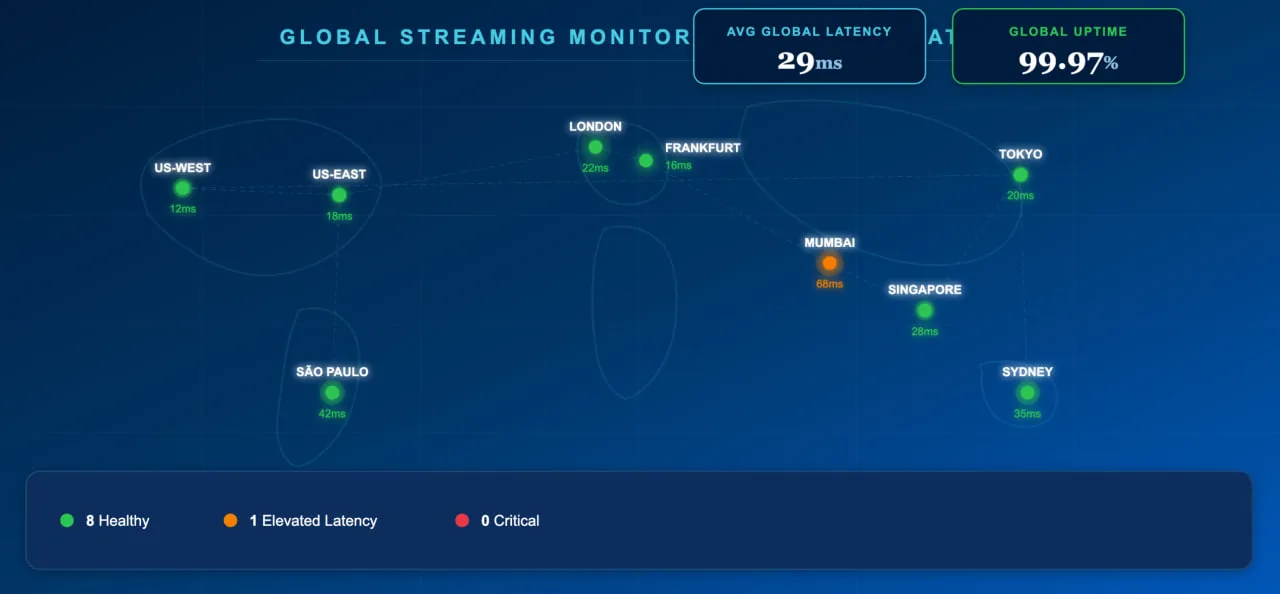
Streaming video monitoring simulates a real viewer. The monitoring agent connects to the media server, buffers the content, and plays the selected stream for a defined period — typically 30 seconds — while recording every measurable aspect of the experience. This process is repeated at regular intervals from monitoring locations around the world, providing continuous visibility into stream health across different regions and network conditions.
During each test, the agent measures average response time, connection time, buffering time, the number of received and buffered packages, frame rate, bitrate, and average bytes per second. If any metric exceeds a defined threshold — or if playback fails entirely — the system triggers alerts via email, SMS, phone call, or integrations with tools like Slack and PagerDuty.
This approach differs from real-user monitoring (RUM) in an important way: synthetic monitoring tests streams proactively, even when no real viewer is watching. This means it catches issues during off-peak hours, after deployments, or in regions where you may not yet have significant audience — before those issues affect a single viewer.
Supported Protocols and Formats
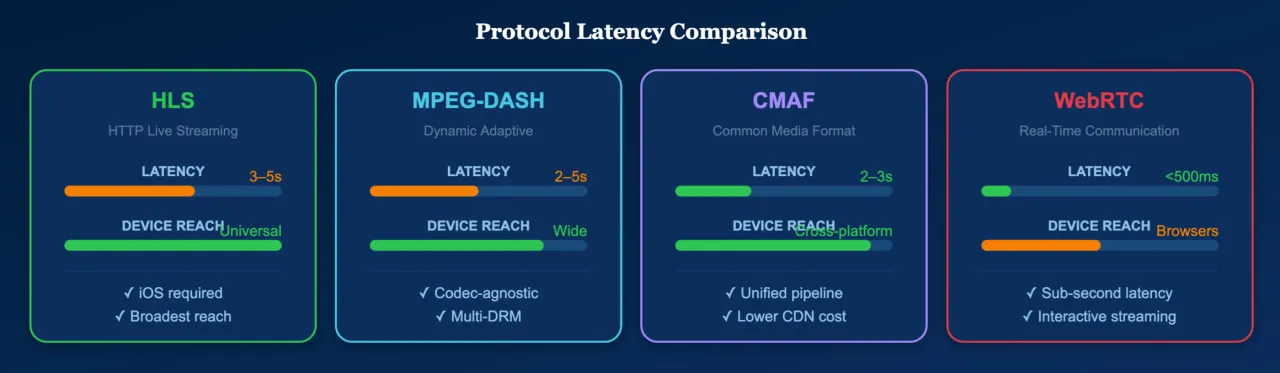
The modern streaming ecosystem runs on a handful of dominant protocols, each serving different use cases. While HLS offers the broadest device compatibility — and is non-negotiable for reaching iOS users — teams with control over their player environment often favor MPEG-DASH for its greater flexibility with codecs and DRM configurations.
| Protocol | Type | Typical Latency | Primary Use |
|---|---|---|---|
| HLS (HTTP Live Streaming) | Adaptive bitrate | 6–30 seconds (2–3s with LL-HLS) | Dominant protocol; required for Apple devices |
| MPEG-DASH | Adaptive bitrate (open standard) | 2–10 seconds | Used by Netflix, YouTube; codec-agnostic |
| CMAF | Container format (works with HLS + DASH) | 3–5 seconds | Unifies HLS/DASH delivery; reduces encoding overhead |
| WebRTC | Peer-to-peer real-time | Sub-second | Video calls, interactive streaming, auctions |
| SRT | Contribution/transport | Low (configurable) | Secure ingest from remote locations |
Dotcom-Monitor’s streaming media monitoring supports hundreds of codecs and file formats — including H.264, H.265 (HEVC), AV1, VP9, AAC, MP4, WebM, Ogg, and legacy formats — ensuring coverage regardless of your encoding choices or the age of your infrastructure.
Common Streaming Problems and How Monitoring Catches Them
Streaming failures rarely announce themselves. Instead, they manifest as a degraded experience that silently erodes viewer engagement. Here are the most impactful issues and how monitoring catches them.

Rebuffering and Stalling
The most damaging quality issue. Studies show that up to 40% of viewers abandon a video after just one rebuffering event. Monitoring detects rebuffering by measuring the ratio of time spent buffering to total playback time. When the rebuffering ratio spikes above your threshold, alerts fire immediately — often before viewer complaints surface. In production environments, rebuffering spikes are most often traced back to three common culprits: a misconfigured CDN edge, a saturated network link at the origin, or a sudden traffic surge during a live event that overwhelms a specific point of presence (PoP).
Slow Time to First Frame
Every second of startup delay increases the exit-before-video-start rate. If pre-roll ad delays reach five seconds, 13.6% of viewers abandon the stream. Monitoring tracks connection time and initial buffering time separately, isolating whether delays originate from the media server, CDN, DNS resolution, or ad insertion pipeline.
Bitrate Oscillation and Quality Drops
Adaptive bitrate streaming adjusts quality based on network conditions, but excessive or rapid quality switching creates a jarring experience. Monitoring tracks bitrate stability over the playback session, flagging streams where the player frequently downshifts — which often indicates CDN capacity problems or bandwidth contention at specific monitoring locations.
Regional and CDN-Specific Failures
A stream may perform perfectly from your origin datacenter while failing for viewers in another region due to CDN edge server issues, ISP peering problems, or geographic routing errors. Multi-location monitoring from 30+ global checkpoints catches these region-specific failures that internal testing would miss entirely.
Encoding and Codec Errors
Transcoding pipeline failures can produce streams that are technically deliverable but visually corrupted — frozen frames, audio desync, or artifacts. Frame rate monitoring detects these issues because corrupted segments typically cause frame rate drops or playback interruptions that manifest in the monitoring data.

These problems become especially acute during live events, where millions of concurrent viewers amplify even minor issues. The timeline below shows how a real championship game unfolds from a monitoring perspective — with traffic spikes, CDN alerts, and rebuffering incidents detected and resolved in near real time:

How to Improve Streaming Video Performance
Use adaptive bitrate encoding, multi-CDN delivery, optimized codecs, edge caching, and continuous monitoring to keep streams fast and reliable.
Monitoring identifies problems; optimization fixes them. These are the highest-impact strategies for improving streaming performance in 2026.
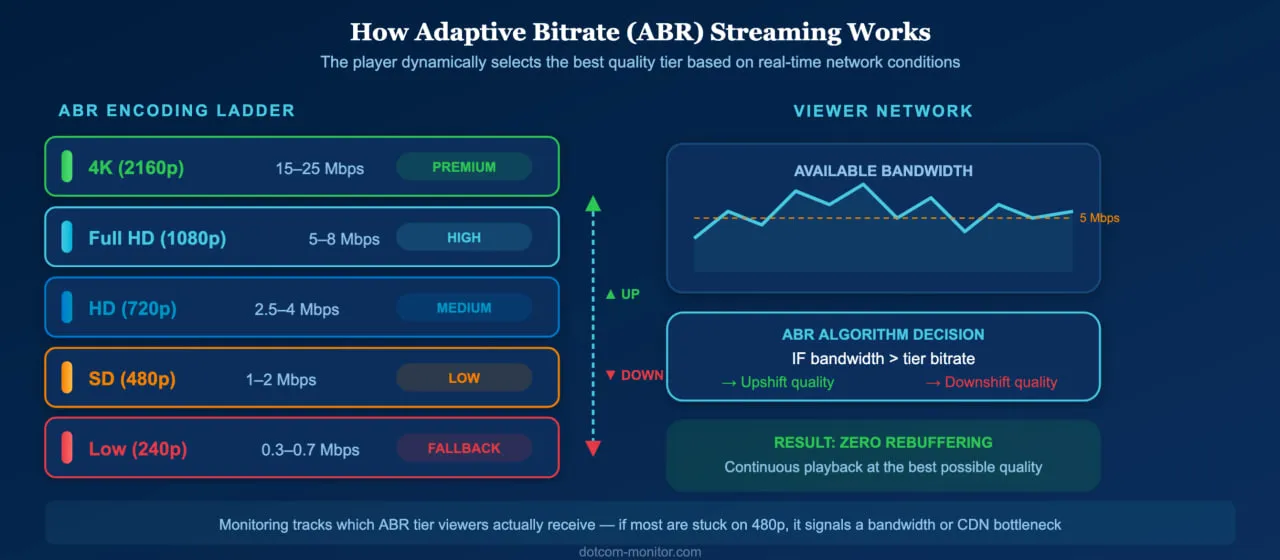
Implement Adaptive Bitrate Streaming
Adaptive bitrate (ABR) streaming — via HLS or DASH — automatically adjusts video quality based on the viewer’s network conditions and device capabilities. This prevents buffering by downshifting quality when bandwidth drops, rather than stalling playback. Modern ABR implementations use AI-powered algorithms to predict network conditions and pre-buffer accordingly.
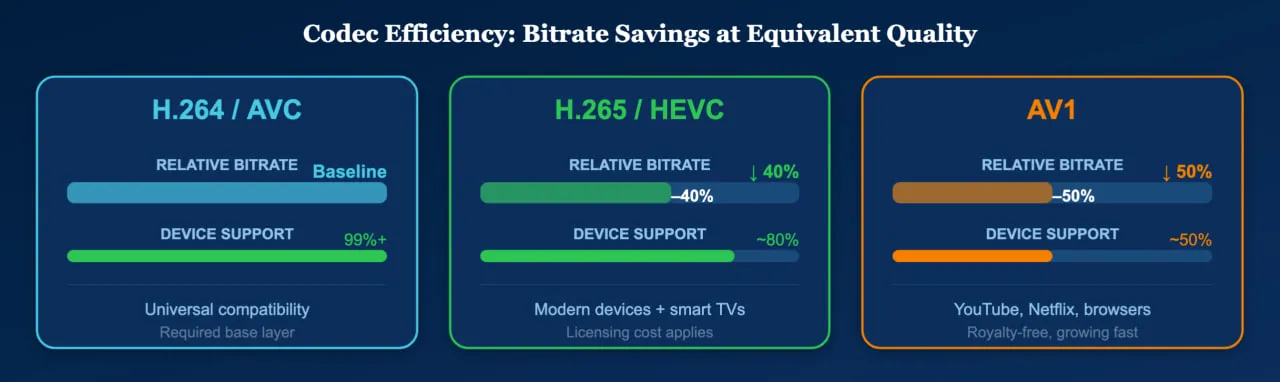
Use Efficient Codecs
Next-generation codecs like H.265 (HEVC) and AV1 deliver equivalent visual quality at 30–50% lower bitrates than H.264. This directly reduces buffering risk and improves the experience for viewers on constrained networks. While H.264 remains the universal baseline for device compatibility, encoding your ABR ladder with HEVC or AV1 for capable devices yields measurable quality improvements. In practice, teams that maintain an H.264 base layer alongside HEVC or AV1 upper tiers get the best of both worlds: broad reach and premium quality where the device supports it.
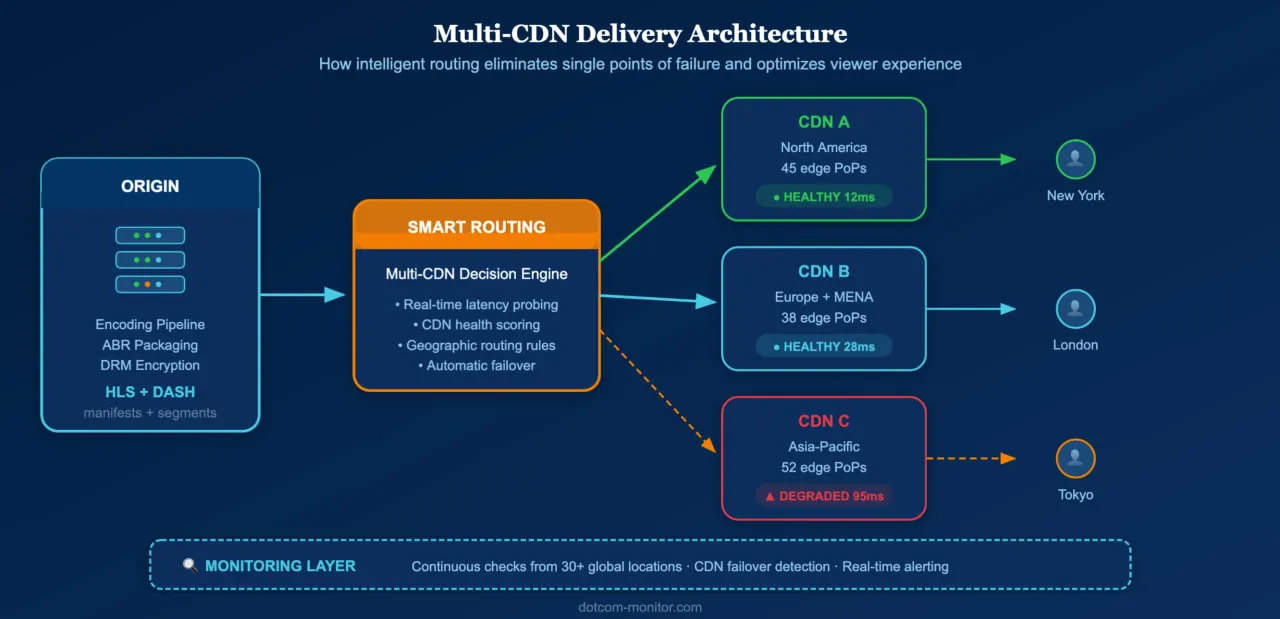
Deploy Multi-CDN Delivery
Relying on a single CDN creates a single point of failure. Multi-CDN strategies route viewers to the best-performing edge server based on real-time conditions, improving both redundancy and performance. Monitoring data from multiple locations provides the performance intelligence needed to evaluate and optimize CDN selection.
Optimize for Low-Latency Delivery
For live streaming, latency is critical. Traditional HLS can introduce 10–30 seconds of delay; Low-Latency HLS (LL-HLS) and CMAF with chunked transfer encoding reduce this to 2–5 seconds. For interactive use cases like live commerce and sports betting, WebRTC achieves sub-second latency. Monitoring should verify that your latency targets are consistently met across all audience regions.
Monitor Continuously, Not Reactively
The most important optimization is institutional: shift from reactive troubleshooting to continuous monitoring. A streaming video monitoring solution running tests every one to five minutes from 30+ global locations will catch CDN degradation, encoding pipeline failures, and regional outages hours before viewer complaints reach your support team. For live events, real-time monitoring with sub-minute intervals is essential — the top ten internet traffic days of 2024 all coincided with live-streamed sporting events, according to the AppLogic Networks GIPR, which underscores just how much is at stake during peak moments.
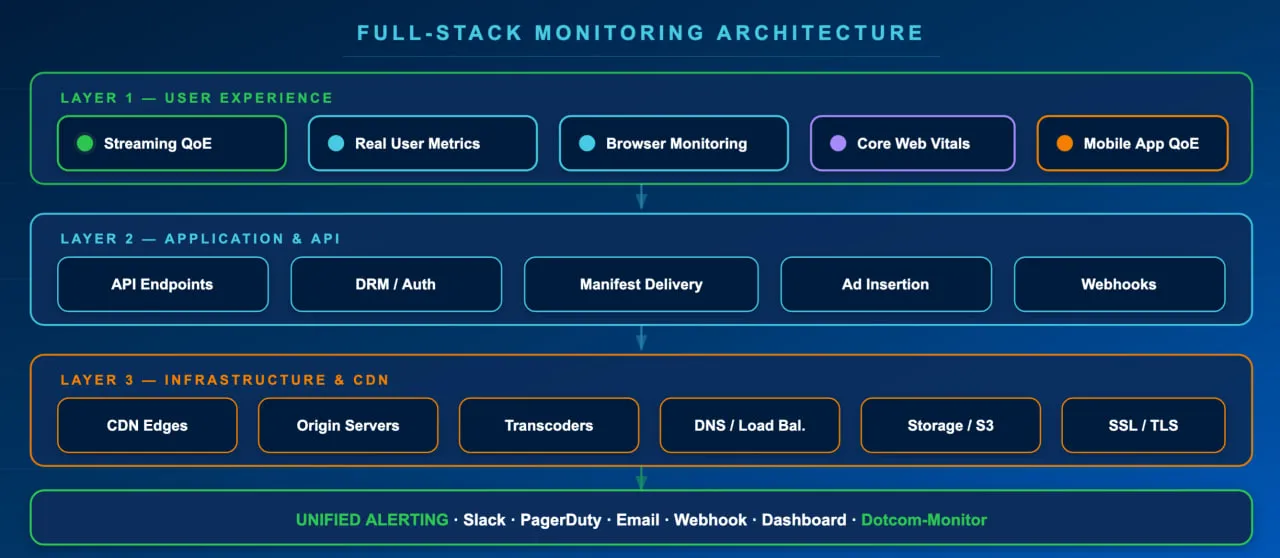
Beyond Streams: Why Full-Stack Monitoring Matters
Streaming video monitoring covers the video delivery pipeline, but streams do not exist in isolation. The web pages hosting your video player must also perform well — slow page loads delay video startup, and site speed directly impacts both SEO rankings and user engagement.
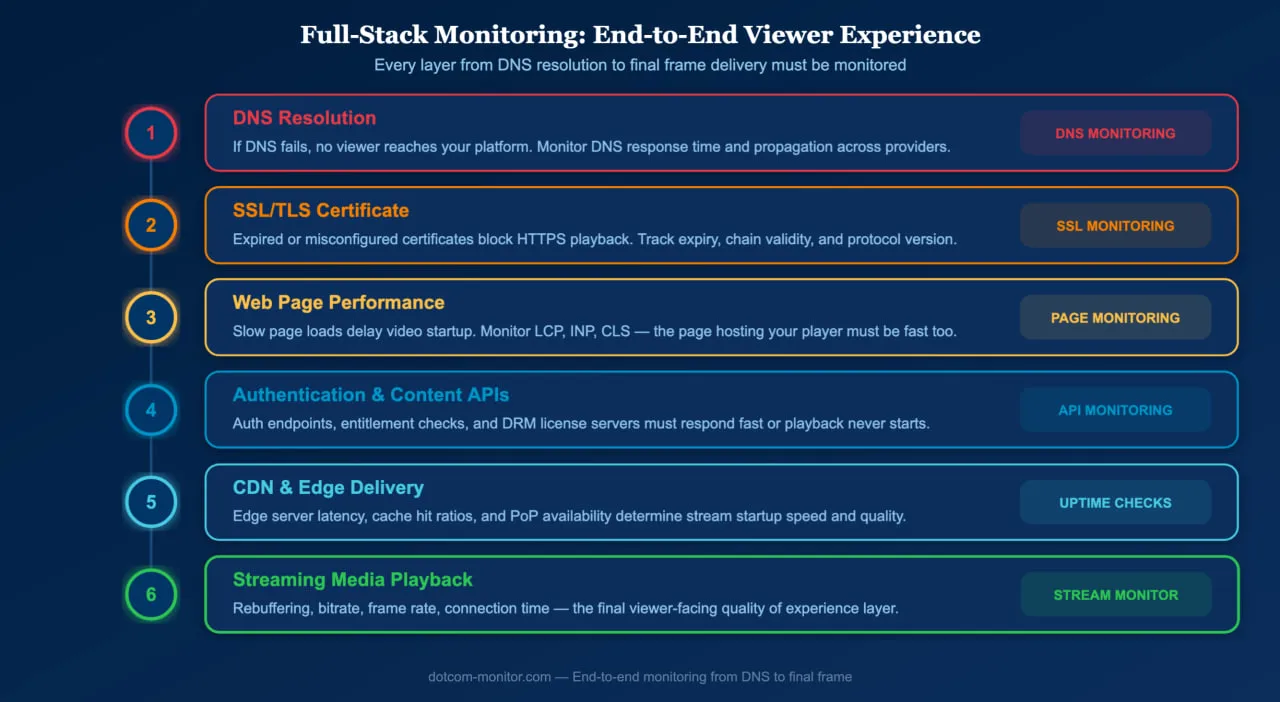
A comprehensive monitoring strategy includes website uptime monitoring to ensure your platform is reachable, web page monitoring to track load performance of the pages hosting your player, API monitoring for authentication and content delivery APIs, DNS monitoring to catch resolution failures that prevent viewers from reaching your streams, SSL certificate monitoring to prevent HTTPS errors that block playback, and streaming media monitoring for the video and audio content itself.
Together, these layers provide end-to-end visibility into the viewer experience — from DNS resolution to final frame delivery.
Start monitoring your streams today
Dotcom-Monitor’s streaming video monitoring supports hundreds of formats and codecs, tests from 30+ global locations, and alerts your team the moment quality degrades.
