Automate Every Part of Your Monitoring with the Dotcom-Monitor API

Programmatically create monitors, manage devices and tasks, orchestrate load tests, and stream real-time performance data into your own dashboards, SIEMs, and CI/CD pipelines — with a documented REST Web API and the XML Reporting Service (XRS).
Three floating dark-mode cards on a deep navy background — a Web API JSON request creating a new HTTPS monitor, an XRS XML response with a timing breakdown, and a live API-surface KPI panel showing requests, devices, locations, sessions, and last deploy.
10,000+

Organizations Worldwide
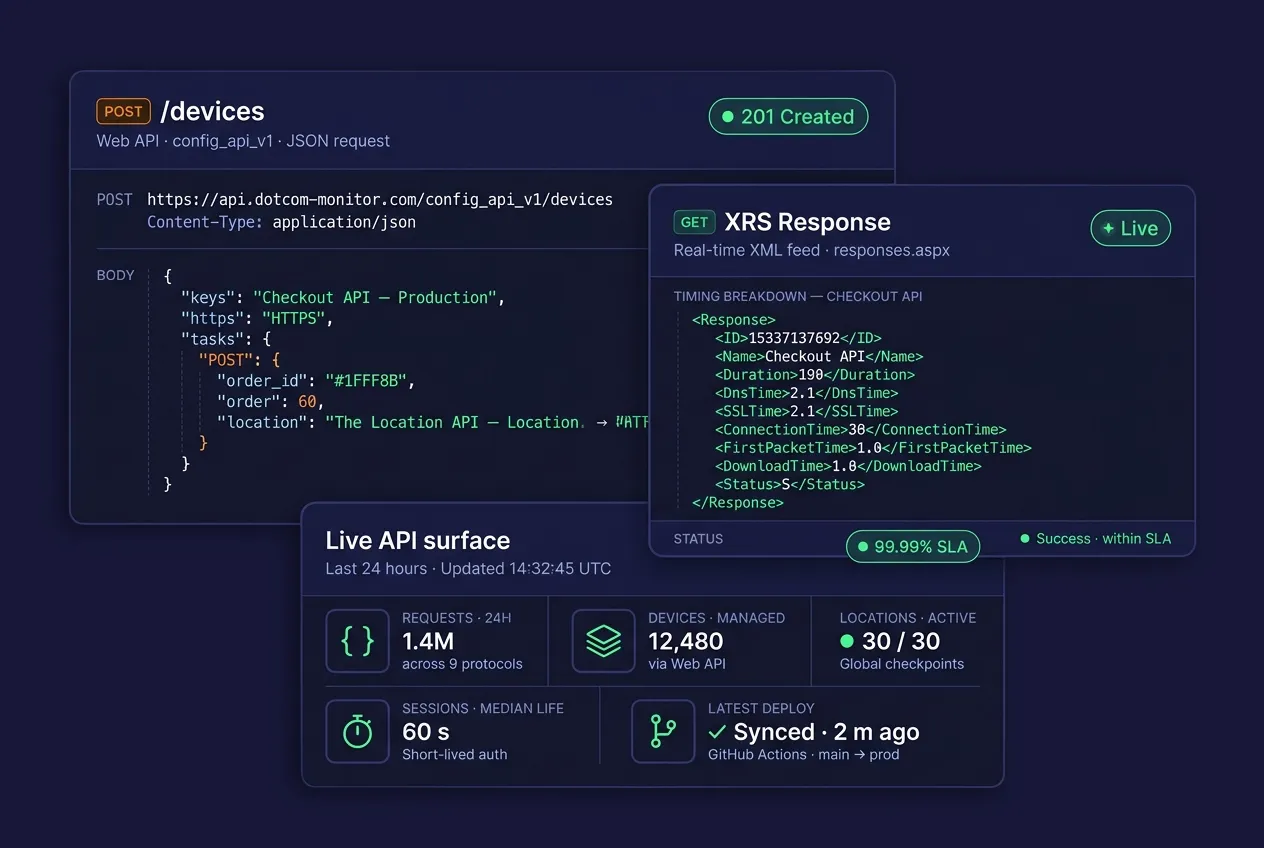
99.99%

Platform Uptime SLA

30+

Global Monitoring Locations

Since 1998

Website Monitoring Leader

Programmatic Monitoring

What Is the Dotcom-Monitor API?

The Dotcom-Monitor platform is fully scriptable. Anything you can do in the web interface — from spinning up a new HTTP monitor to pulling a three-month performance report — you can do programmatically through two complementary services: the REST-based Web API for configuration and the XML Reporting Service (XRS) for real-time data extraction.

The Web API is a structured, JSON-based HTTP interface that exposes monitoring and load-testing operations to your own systems. Use it to provision new monitors on every deployment, roll thousands of devices under configuration-as-code, wire monitoring into your existing ticketing tools, or embed live performance data inside customer-facing status pages.

The XML Reporting Service (XRS) is a free on-demand data feed that returns monitoring results as XML documents. Point it at any reporting dashboard, BI tool, Excel workbook, or internal database to build custom views without waiting on engineering.

Together they give your platform, SRE, and DevOps teams full programmatic control — no UI clicks required.

Web API — Quick Reference

https://api.dotcom-monitor.com/config_api_v1/

Format

JSON request / JSON response

Methods

GET (read) · POST / PUT (write / update)

Auth

Per-request, 60-second session; optional IP whitelist

Transport

HTTP or HTTPS

XRS — Quick Reference

https://xmlreporter.dotcom-monitor.com/reporting/xml/

Format

XML response over HTTP(S) GET

Auth

Account UID (PID) generated in Manage > Integrations

Data Depth

Raw responses up to 6 months back

Cost

Free, included with every account

1

Generate a Key

Create a Web API or XML Feed integration in your account.

2

Configure

POST JSON to create devices, tasks, groups, schedules, and alerts.
3

Monitor

Runs execute from 30+ global locations on your defined schedule.
4

Extract

Pull results via XRS into dashboards, BI, Excel, or internal apps.
Core API Capabilities

Everything the UI Can Do — As Code

Every monitoring object in your account is a first-class API resource. Manage them individually or in bulk across environments.

Full Monitor Configuration

Device, Task & Group Management

Locations & Schedules

Alerts & Notification Integrations

XRS Real-Time Reporting Feed

How It Works

From Zero to Automated Monitoring in Four Steps

No SDK install required. If your system can make an HTTP request, it can talk to Dotcom-Monitor.

01

Create an Integration

In your Dotcom-Monitor account, go to Manage > Integrations and create a new Web API integration (for configuration) or XML Feed integration (for reporting). Optionally restrict access by IP address.

02

Authenticate

Each request authenticates against your integration. Sessions expire after 60 seconds of inactivity, keeping access short-lived and secure. XRS requests use your generated Account UID (PID).

03

Send JSON Requests

Call GET for reads or POST/PUT for writes. Set Content-Type: application/json when sending a body. Errors return structured JSON.

04

Automate Everywhere

Wire the API into Terraform, Jenkins, GitHub Actions, Azure DevOps, or your own scripts. Trigger monitor provisioning on deploy, pull performance data into BI, or auto-page on SLA breaches.

Technical Specifications

Two APIs. One Account. Complete Control.

The Web API handles configuration; XRS handles reporting. They share a single authentication model and work with every Dotcom-Monitor solution.

Web API (Config & Control)

Manage your monitoring infrastructure programmatically.

Base URL

api.dotcom-monitor.com/config_api_v1/

Protocols

HTTP, HTTPS

Request format

JSON (application/json)

Response format

JSON

Methods

GET (read) · POST, PUT (write / update)

Authentication

Web API Integration key, per-request session (60s timeout)

Access control

IP whitelist optional

Covers

Monitoring + LoadView methods

Objects managed

Devices, tasks, groups, schedules, filters, alerts, locations, load tests, users

Error handling

Structured JSON with error codes & messages

XML Reporting Service (XRS)

Stream real-time monitoring data into anything that speaks XML.

Base URL

xmlreporter.dotcom-monitor.com/reporting/xml/

Protocols

HTTP, HTTPS

Request format

HTTP(S) GET with URL parameters

Response format

XML document

Authentication

Account UID (PID), generated as an XML Feed integration

Scope

Account-wide or limited to specific Departments

Report types

Device config, status, raw responses, summaries (hour / day / week / month / year), 3-month stats

Data window

Up to the last 6 months for raw responses

Filters

Location, schedule, device, success / failure, department, date range

Output targets

Dashboards, SQL, Excel, Power BI, custom apps

Developer-Friendly

Simple HTTP.
No SDKs Required.

Every monitoring object — devices, tasks, alerts, groups, schedules — is represented as a JSON resource. Here’s what it looks like to pull monitoring data from XRS and push a new device through the Web API. Drop these into a curl, a bash script, a Python job, or a CI step — whatever your team already uses.

Returned fields include DnsTime, SSLTime, ConnectionTime, RequestTime, FirstPacketTime (TTFB), DownloadTime, and Duration, plus location, status, and monitoring timestamp — ready to drop into any waterfall view.

# Pull real-time XRS report — summary by location
GET https://xmlreporter.dotcom-monitor.com/reporting/xml/responses.aspx
     ?PID=4229AF4F0FB545AEA75EAF2013E51BB7
     &Site=12345
     &Type=Overall
     &location=NY, USA

# Response (trimmed)
<Response>
  <ID>3424533543</ID>
  <Name>Checkout API</Name>
  <URL>https://shop.example.com/api/checkout</URL>
  <Duration>114</Duration>
  <DnsTime>0</DnsTime>
  <SSLTime>18</SSLTime>
  <ConnectionTime>15</ConnectionTime>
  <FirstPacketTime>97</FirstPacketTime>
  <DownloadTime>2</DownloadTime>
  <Status>S</Status>
</Response>

# Create a new HTTPS monitor via Web API
POST https://api.dotcom-monitor.com/config_api_v1/devices
Content-Type: application/json

{
  "name": "Checkout API — Production",
  "platform": "HTTPS",
  "tasks": [{
    "url": "https://shop.example.com/api/checkout",
    "method": "POST",
    "keyword": "order_id"
  }],
  "frequency": 60,
  "locations": ["NY-USA", "FR-PARIS", "SG"]
}

Start Automating Your Monitoring in 5 Minutes

Every paid plan includes full Web API and XRS access — no add-ons, no per-call metering, no extra billing tier.

Use Cases

What Teams Build with the API

Platform teams, SREs, and DevOps engineers use the Dotcom-Monitor API to bring monitoring into the workflows they already live in.

Monitoring-as-Code

Version every monitor alongside the service it protects. Provision, update, and retire devices through your existing Terraform or Pulumi pipeline — no drift between staging and production.

Post-Deploy Smoke Tests

Trigger on-demand HTTPS and multi-step transaction checks from Jenkins, GitHub Actions, or Azure DevOps after every deploy. Fail the build when a new release breaks a critical endpoint.

Custom Status Pages & Dashboards

Feed XRS data into customer-facing uptime pages, internal NOC displays, or executive SLA reports. Pull only the fields you want, formatted exactly the way you need them.

SLA Evidence & Compliance Reporting

Automate monthly SLA exports (uptime %, P95 / P99 response time, downtime incidents) directly from XRS into Excel or PDF — documented, timestamped, and audit-ready.

Bulk Device Provisioning

Spin up hundreds of monitors in one pass after an acquisition, a migration, or a CDN cutover. Clone existing device templates and assign the right groups, schedules, and alert routes at scale.

Third-Party Dashboard Embedding

Pipe monitoring data into Grafana, Power BI, Tableau, or Datadog alongside your other telemetry — external synthetic checks correlated with internal APM traces.

Multi-Tenant Account Management

MSPs and enterprise teams can manage hundreds of departments and thousands of devices in a single programmatic sweep, with department-scoped XRS feeds for each customer.

Incident Enrichment

When a monitor fires, pull the waterfall, cipher, and timing breakdown via XRS and attach it to the PagerDuty or ServiceNow incident automatically — cutting triage time.

XRS Deep-Dive

Real-Time Reporting, Exactly the Way You Need It

The XML Reporting Service is a flexible, free, on-demand feed. Ask for summary data or raw responses. Filter by location, schedule, or success state. Return just the fields you care about.

Report type
What you get
Typical use
Account utilization
Used and available resources per monitoring solution
License & capacity planning, billing reconciliation
Device status
Current state & status of individual devices or sets
Live status pages, NOC wall dashboards
Response details
Highly customizable per-request timing & content
Detailed diagnostics, custom waterfalls, incident enrichment
Device & task config
Exported monitoring configuration snapshots
Backups, cross-environment cloning, audit trails
Summary data
Uptime, downtime, success count, failure count, performance, StDev
Executive summaries, SLA reports
Raw responses
Every check result for a device, up to 6 months back
Forensic analysis, historical comparisons
Hourly aggregates
Response data bucketed into 1-hour windows
Peak-load identification, hourly trend analysis
Daily aggregates
Response data bucketed into 24-hour windows
Daily ops reviews, business-day vs. weekend comparisons
Weekly / monthly / yearly
Summaries across longer time horizons
Board-level trending, YoY performance reports
3-month statistics
Statistical data calculated over a rolling 3-month window
Baseline-derived alerting, anomaly detection

Every report can be filtered by monitoring location, schedule, Dotcom-Monitor Filter, success or failure state, department, and custom date range.

Why Teams Use the API

Built for DevOps, SRE & Platform Engineering

The Dotcom-Monitor API removes manual UI clicks from your monitoring workflow so your team can scale synthetic coverage without scaling headcount.

Eliminate Drift

Keep monitoring configuration in source control. Apply the same monitors across environments with confidence.

Shift Monitoring Left

Add synthetic checks in the same PR as the service they cover. Monitoring lands with the code, not weeks later.

Scale Without Clicks

Onboard a hundred new domains or a thousand new endpoints with a single script. No click fatigue.

Granular Security

Short-lived sessions, optional IP whitelisting, and department-scoped integration keys keep access tight.

Fits Any Stack

Plain HTTP + JSON (or GET + XML for reporting). No SDK lock-in. Works with every language and CI/CD tool.

Own Your Data

Pull your monitoring data into your own data warehouse, BI platform, or compliance archive on your schedule.

Unified Surface

One API spans monitoring and LoadView load testing — no separate tool, no separate credentials.

No Extra Cost

API and XRS access are included with every paid plan. No per-call metering, no upcharge for automation.

What Our Customers Say

"One of Dotcom's best features is the push/pull API capabilities that provide us with network performance data. We use this to monitor for performance issues as well as page loading stats. Dotcom-Monitor allows us to monitor multiple services within one interface and platform. It's allowed us to operate more efficiently."
Gregory S.
Manager, Broadcast Media · Verified Capterra review

Ready to Put Your Monitoring on Autopilot?

Every 30-day trial includes full Web API and XRS access — plus every monitoring solution, every location, and every integration. See what automated monitoring feels like.

Frequently Asked Questions

Common Questions About the Dotcom-Monitor API

The Web API (config_api_v1) is a JSON-based REST interface for creating and managing monitoring configuration — devices, tasks, groups, schedules, alerts, and load tests. The XML Reporting Service (XRS) is a separate free feed that returns monitoring results as XML via HTTP GET. Most teams use both: Web API to configure, XRS to extract results.

In your Dotcom-Monitor account go to Manage > Integrations > New Integration and create either a Web API integration (for configuration) or an XML Feed integration (for XRS). Every Web API request authenticates against that integration and sessions expire after 60 seconds of inactivity. XRS uses the generated Account UID as a PID URL parameter. You can also restrict access by IP address.

The Web API is fully JSON — both request bodies and responses. Set Content-Type: application/json when sending a JSON body. XRS returns XML documents over HTTP(S) GET, so the request is just a URL with query parameters.

The Web API covers every Dotcom-Monitor monitoring platform: HTTPS, REST, SOAP, GraphQL, WebSocket, ServerView, BrowserView, UserView (EveryStep scripts), and MetricsView — as well as all protocol monitors (DNS, SSL, Email, FTP, ICMP Ping, TCP Port, Traceroute, VoIP, and more). It also covers the full LoadView load-testing surface.

API and XRS access are included with every paid plan — there is no per-call metering and no add-on fee. Sessions expire after 60 seconds of inactivity, which naturally throttles long-running scripts. If you need IP-restricted access or enterprise-level throughput, contact Sales about Enterprise options.

XRS can return raw response data for up to the last 6 months. Summary and statistical reports (hourly / daily / weekly / monthly / yearly aggregates and 3-month statistics) are available over longer time horizons. You specify the start and end date/time for each report.

Yes — any tool that can make an HTTP call can drive the API. Teams commonly integrate with Jenkins, GitHub Actions, GitLab CI, Azure DevOps, CircleCI, and Terraform to provision monitors on deploy, run post-release smoke tests, and gate production rollouts on monitoring health.

Yes. When you create a Web API Integration you can allow access from all authenticated requests or restrict access to a list of trusted IP addresses. See the How to Whitelist IPs for Web API Access article in the Knowledge Base for details.

Yes. Users on a root account can manage departments programmatically, and an XML Feed integration can be scoped to specific departments. Department-limited users can only pull XRS reports for their own department, which supports clean separation for MSPs and multi-tenant setups.

Full documentation lives in the Dotcom-Monitor Knowledge Base, including the Getting Started with the API guide, the Monitoring and LoadView method references with JSON examples, and the XRS request-parameter reference. Ready-to-use code templates are available in the Code Examples section.

Automate Monitoring.Reclaim Engineering Time.

Join 10,000+ organizations using Dotcom-Monitor to catch failures before customers do — and using the API and XRS to make that coverage effortless to manage.