- REST
- SOAP
- GraphQL
- gRPC
- WebSocket
- Webhooks
Web API Monitoring: Choosing the Right Protocol
REST, SOAP, GraphQL, gRPC, WebSockets, and Webhooks each serve different integration patterns. This guide compares transport layers, data formats, and monitoring approaches to help you select and validate the right protocol for your architecture. Dotcom-Monitor supports all six protocols with protocol-specific assertions, authentication, and global testing.
5-Min Setup
Import Postman
First Alerts
In 10 minutes
30-Day Trial
All features
24/7 Support
Expert team
Protocol Comparison
Dotcom-Monitor supports all major Web API protocols. Choose the right monitoring approach based on your integration architecture.
Protocol | Transport | Data Format | Typical Use Case |
|---|---|---|---|
REST | HTTP/HTTPS | JSON, XML | CRUD resources, stateless operations |
SOAP | HTTP, SMTP | XML | Enterprise services, WS-Security |
GraphQL | HTTP/HTTPS | JSON | Flexible queries, nested data |
gRPC | HTTP/2 | Protobuf | Microservices, low-latency RPC |
WebSockets | TCP (WS/WSS) | Custom, JSON | Real-time feeds, bidirectional streams |
Webhooks | HTTP/HTTPS | JSON | Event notifications, push updates |
Monitoring Across All Protocols
Dotcom-Monitor’s Web API monitoring adapts to each protocol’s characteristics. REST and GraphQL monitors validate JSONPath assertions, SOAP monitors parse XML with XPath, gRPC monitors decode Protobuf responses, WebSocket monitors track bidirectional message flows, and Webhook monitors verify delivery and retry logic. All protocols support multi-step workflows, authentication, and global location testing.
How Dotcom-Monitor Monitors Each Protocol
Protocol-specific monitoring capabilities tailored to the unique characteristics of REST, SOAP, GraphQL, gRPC, WebSockets, and Webhooks.
REST API
Dotcom-Monitor's REST Web API Device checks your REST endpoints for uptime, performance, proper data, and authentication correctness across all HTTP methods.
HTTP Methods
Full support for GET, POST, PUT, DELETE, PATCH requests with custom headers and form submissions
Authentication
OAuth 2.0, JWT, Bearer tokens, Basic/Digest authentication, and custom header-based auth
Validation
JSONPath assertions validate nested response structures, status codes, and response times
Multi-Step Workflows
Chain up to 20 API calls with data extraction and variable passing between steps
SSL Monitoring
Certificate validation, expiration tracking, and automated renewal reminders
SOAP
SOAP monitoring replicates client requests to test SOAP-based web services for availability, errors, and proper content with WSDL import support.
WSDL Support
SOAP Wizard imports WSDL URLs and auto-generates valid test parameters for immediate monitoring
XML Validation
XPath assertions validate XML response payloads and SOAP envelope structures
Authentication
Basic, Digest, and NTLM authentication schemes for Windows and enterprise environments
Custom Headers
Application-specific SOAP headers for authentication, payment methods, and routing
DNS Control
Custom DNS resolution modes and IP-to-hostname mapping for private networks
GraphQL
GraphQL monitoring uses the REST Web API Device to send queries and mutations via POST requests, validating nested data structures and field-level errors.
Query & Mutation Support
Send GraphQL queries, mutations, and subscriptions with variable injection
Nested Validation
JSONPath validates deeply nested GraphQL response structures and detects field-level errors
Query Complexity
Track query performance, resolver latency, and complexity metrics
Authentication
OAuth 2.0, JWT, API keys, and custom GraphQL-specific headers (X-GraphQL-Operation-Name)
Multi-Step Workflows
Extract data from one query and pass as variables to subsequent mutations
gRPC
gRPC monitoring leverages HTTP/2 transport and Protobuf decoding to monitor unary, streaming, and bidirectional RPC calls with mTLS support.
HTTP/2 Transport
Native HTTP/2 protocol support for gRPC service monitoring with multiplexing
Protobuf Decoding
Decode Protobuf-encoded responses and validate message structures
Streaming Support
Monitor unary, server streaming, client streaming, and bidirectional streaming RPCs
mTLS Authentication
Certificate-based mutual TLS authentication for secure service-to-service communication
Latency Percentiles
Track P50, P95, P99 latency percentiles for performance SLA compliance
WebSockets
WebSocket monitoring tracks persistent bidirectional connections, validates message delivery, and tests reconnection logic for real-time applications.
Connection Tracking
Monitor WebSocket handshake (HTTP upgrade) and persistent connection uptime
Message Validation
Validate messages sent and received in both client-to-server and server-to-client directions
Reconnection Logic
Test automatic reconnection on disconnect and track reconnection success rates
Message Latency
Measure time between message send and receive for real-time performance
Silent Disconnect Detection
Detect connection timeouts, proxy issues, and silent disconnects
Webhooks
Webhook monitoring validates event-driven push notifications, confirms payload delivery, verifies HMAC signatures, and tracks retry logic.
Delivery Verification
Confirm webhook payload delivery and track delivery success rates
Retry Logic Testing
Validate retry attempts on failure and exponential backoff behavior
Signature Validation
Verify HMAC signatures (X-Hub-Signature, X-Webhook-Signature) for security
Payload Validation
Validate JSON/XML webhook payloads and event data correctness
Endpoint Availability
Monitor webhook endpoint response times and availability
Common Capabilities Across All Protocols
Global Monitoring Network
30+ monitoring locations worldwide with geo-specific routing validation and regional latency tracking.
Real-Time Alerting
Instant alerts via email, SMS, Slack, PagerDuty with configurable thresholds and escalation policies.
SLA Reporting
Uptime percentages, latency trends, certificate expiration reports, and custom scheduled reports.
Use Cases by Protocol
Real-world monitoring scenarios for each Web API protocol. Dotcom-Monitor adapts to your integration architecture.
REST
E-Commerce Checkout Flows
Monitor multi-step checkout APIs from product search through payment confirmation. Validate cart operations, inventory checks, payment gateway responses, and order creation. Detect abandoned cart API failures before customers complain.
Example Flow
GET /products → POST /cart/add → POST /checkout → GET /order/status
Key Metrics
- Cart abandonment rate
- Payment success rate
- Order confirmation latency
SOAP
Enterprise Integration
Monitor legacy SOAP services for B2B data exchange, ERP integration, and financial transactions. Validate WSDL compliance, WS-Security authentication, and XML payload structure. Track SLA compliance for partner-facing APIs.
Example Flow
GetCustomerInfo → ProcessOrder → UpdateInventory
Key Metrics
- WSDL validation
- WS-Security auth
- Partner SLA adherence
GraphQL
Modern Frontend APIs
Monitor GraphQL queries and mutations for single-page applications. Validate nested data structures, field-level errors, and query performance. Detect N+1 query problems and resolver timeouts.
Example Flow
query { user { orders { items { product } } } }
Key Metrics
- Query complexity
- Resolver latency
- Field-level errors
gRPC
Microservices Communication
Monitor inter-service gRPC calls in distributed architectures. Validate Protobuf serialization, bidirectional streaming, and service mesh routing. Track latency percentiles for SLO compliance.
Example Flow
UserService.GetProfile → OrderService.CreateOrder
Key Metrics
- P50/P95/P99 latency
- Stream health
- Service mesh routing
WebSockets
Real-Time Data Feeds
Monitor WebSocket connections for live dashboards, chat applications, and streaming data. Validate connection establishment, message delivery, and reconnection logic. Detect dropped connections and message loss.
Example Flow
ws://api.example.com/live-feed → message validation
Key Metrics
- Connection uptime
- Message latency
- Reconnection success
Webhooks
Event-Driven Notifications
Monitor webhook delivery for payment processors, CRM integrations, and third-party services. Validate payload structure, retry logic, and signature verification. Track delivery success rates and latency.
Example Flow
POST /webhooks/payment → validate signature → process event
Key Metrics
- Delivery success rate
- Retry attempts
- Signature validation
What Our Customers Say
Real reviews from verified Capterra users — see why teams choose Dotcom-Monitor for API and website monitoring.
"I absolutely love the comprehensive monitoring services Dotcom-Monitor provides. The real-time alerts and detailed performance analytics have been a game-changer for our website's uptime and speed. The global monitoring feature ensures that our site is optimized everywhere, and the intuitive dashboard makes it easy to track performance. Their customer support is exceptional — always responsive and efficient."
Tomer C.
Managing Director · Facilities Services
Verified Capterra review · March 2025
"One of Dotcom's best features is the push/pull API capabilities that provide us with network performance data. We use this to monitor for performance issues as well as page loading stats. Dotcom-Monitor allows us to monitor multiple services within one interface and platform. It's allowed us to operate more efficiently."
Gregory S.
Manager · Broadcast Media
Verified Capterra review · May 2020
"I have been thoroughly impressed with the level of detail and comprehensiveness of the reports generated by the software. Moreover, the support team at Dotcom-Monitor has exceeded my expectations. On almost a daily basis, I reach out with various questions and they have consistently demonstrated unwavering patience, providing detailed and insightful answers."
Shirin R.
Software Test Engineer · Computer Software
Verified Capterra review · February 2023
4.5
Capterra
80 reviews
4.6
Ease of Use
Capterra Score reviews
4.6
Customer Service
Capterra Score reviews
All reviews sourced from Capterra verified reviews. Ratings as of January 2026.
Get answers
Frequently Asked Questions
Common questions about Web API monitoring, protocols, and implementation.
Dotcom-Monitor supports REST, SOAP, GraphQL, gRPC, WebSockets, and Webhooks. REST monitors validate JSONPath assertions and HTTP methods. SOAP monitors parse WSDL and validate XML with XPath. GraphQL monitors handle queries, mutations, and nested data structures. gRPC monitors decode Protobuf responses. WebSocket monitors track bidirectional message flows. Webhook monitors verify delivery and retry logic.
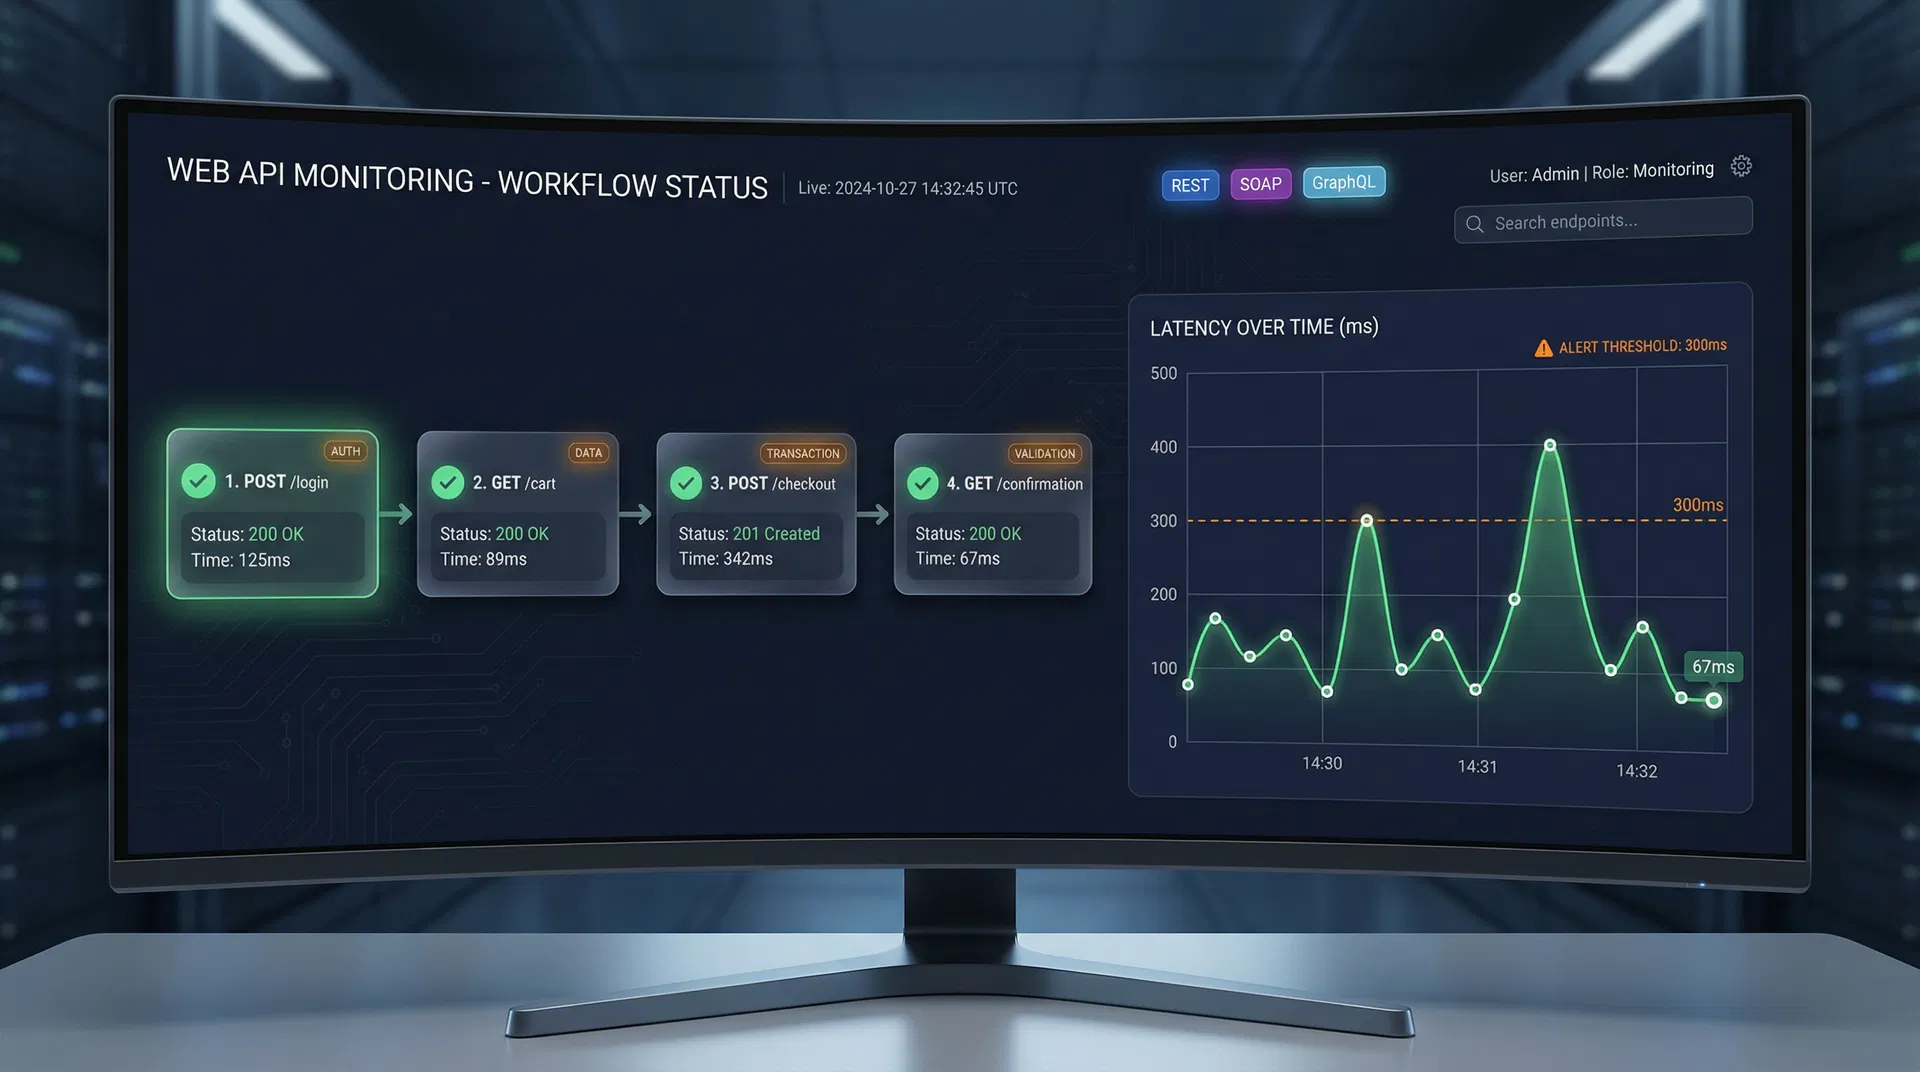
Multi-step monitors chain up to 20 API calls in sequence. Each step can extract data from the previous response using JSONPath or XPath, then pass it to the next request as a header, query parameter, or body field. For example, step 1 might POST to /login and extract a JWT token, step 2 uses that token in the Authorization header for GET /cart, and step 3 uses the cart ID from step 2 to POST /checkout. Each step tracks timing, status codes, and response payloads independently.
Dotcom-Monitor supports OAuth 2.0 (with automatic token refresh), JWT, API keys, Basic Auth, and custom header schemes. Credentials are encrypted in the Secure Vault. For OAuth 2.0, the monitor can automatically refresh access tokens when they expire. Certificate-based authentication (mTLS) is supported for gRPC and HTTPS endpoints. SOAP monitors support WS-Security username tokens and X.509 certificates.
Yes. Dotcom-Monitor imports Postman Collections (v2.1) and Insomnia exports with one click. The import process converts requests, headers, authentication, and environment variables into Dotcom-Monitor monitors. Multi-step workflows are preserved, and JSONPath assertions can be added after import. Variables like {{baseUrl}} and {{authToken}} are automatically mapped to Dotcom-Monitor variables.
Use JSONPath assertions for REST and GraphQL (e.g., $.status == “success” or $.items.length > 0). Use XPath for SOAP XML responses (e.g., //OrderStatus/text() = “Confirmed”). You can also validate HTTP status codes (200, 201, 204, 400, 500), response headers (Content-Type, Cache-Control), and response time thresholds (e.g., step 1 < 500ms, step 3 < 2000ms). Regex pattern matching is available for custom validation.
When a monitor fails (status code error, assertion failure, timeout, or DNS resolution failure), Dotcom-Monitor sends alerts to Slack, PagerDuty, Microsoft Teams, email, or webhook within 30 seconds. The alert includes step-by-step diagnostics: DNS resolution time, SSL handshake duration, response time per step, full response payloads, and error messages. Monitors retry 3 times before triggering an alert to avoid false positives.
Yes. Dotcom-Monitor’s Private Agent runs inside your network to monitor internal APIs, staging environments, and firewall-protected endpoints. The agent connects outbound to Dotcom-Monitor’s platform (no inbound firewall rules required), executes monitors on your schedule, and reports results back. Private Agents support all protocols (REST, SOAP, GraphQL, gRPC, WebSockets, Webhooks) and all authentication methods.
Dotcom-Monitor provides a REST API and Terraform provider to manage monitors as code. You can create, update, or delete monitors from CI/CD pipelines using YAML configuration files. Trigger on-demand API checks from Jenkins, GitLab CI, GitHub Actions, or CircleCI. Fail builds if API response times exceed thresholds or assertions fail. Export monitor configurations to version control for audit trails.
Ready to Monitor Your APIs?
Explore Dotcom-Monitor’s complete API monitoring platform with support for all protocols, multi-step transactions, and global coverage.
- No credit card needed
- REST, SOAP, multi-step, and alerting included
- 24x7 expert support